


Digital mobility and connectivity grow more important every day. We know consumers keep their mobile devices nearby, check them frequently, and occasionally use multiple devices at once. But what do they actually click on, download, explore, peruse, and avoid on their mobile devices? – Salesforce
Indonesia is a clearly state of mobile with growing number of internet penetration that mainly driven from mobile device. How is the Indonesian Mobile Behavior differs? Let’s observe from our survey result below. JAKPAT surveyed 2846 respondents from user of JAKPAT Mobile Apps randomly to 17-40 age range and all provinces in Indonesia to find out their mobile behavior. Survey is done in 5 Hours via JAKPAT Dashboard. This survey is a replication survey of Mobile Behavior Report from Salesforce.
Own Multiple Devices 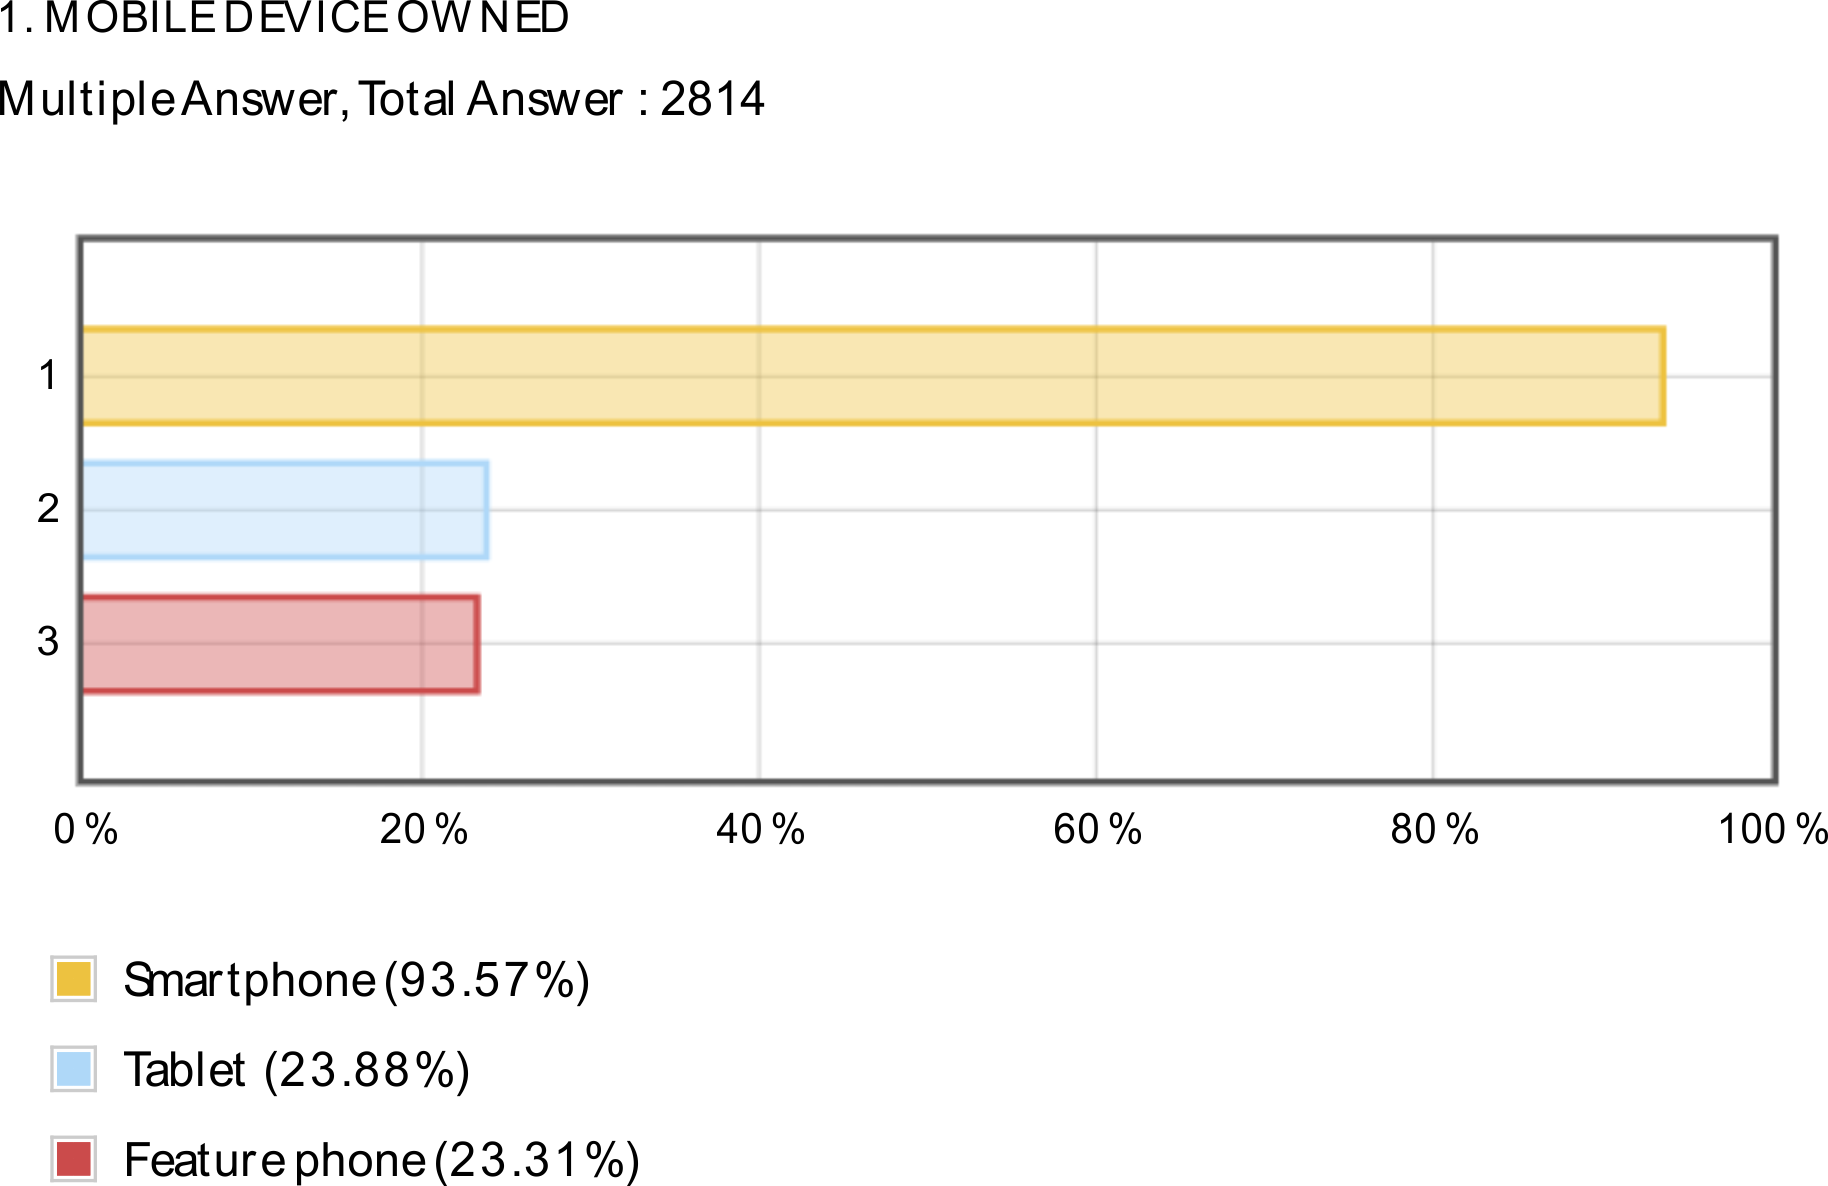 We asked whether what mobile devices that most respondents own. Though we can assume that all respondents participated are using smartphones indeed. But when we asked what are the devices they owned, there are over 20% respondents stated they also owned whether tablet and feature phone instead of only smartphone or only tablet.
Spends 5-6 Hours A Day on Mobile Device 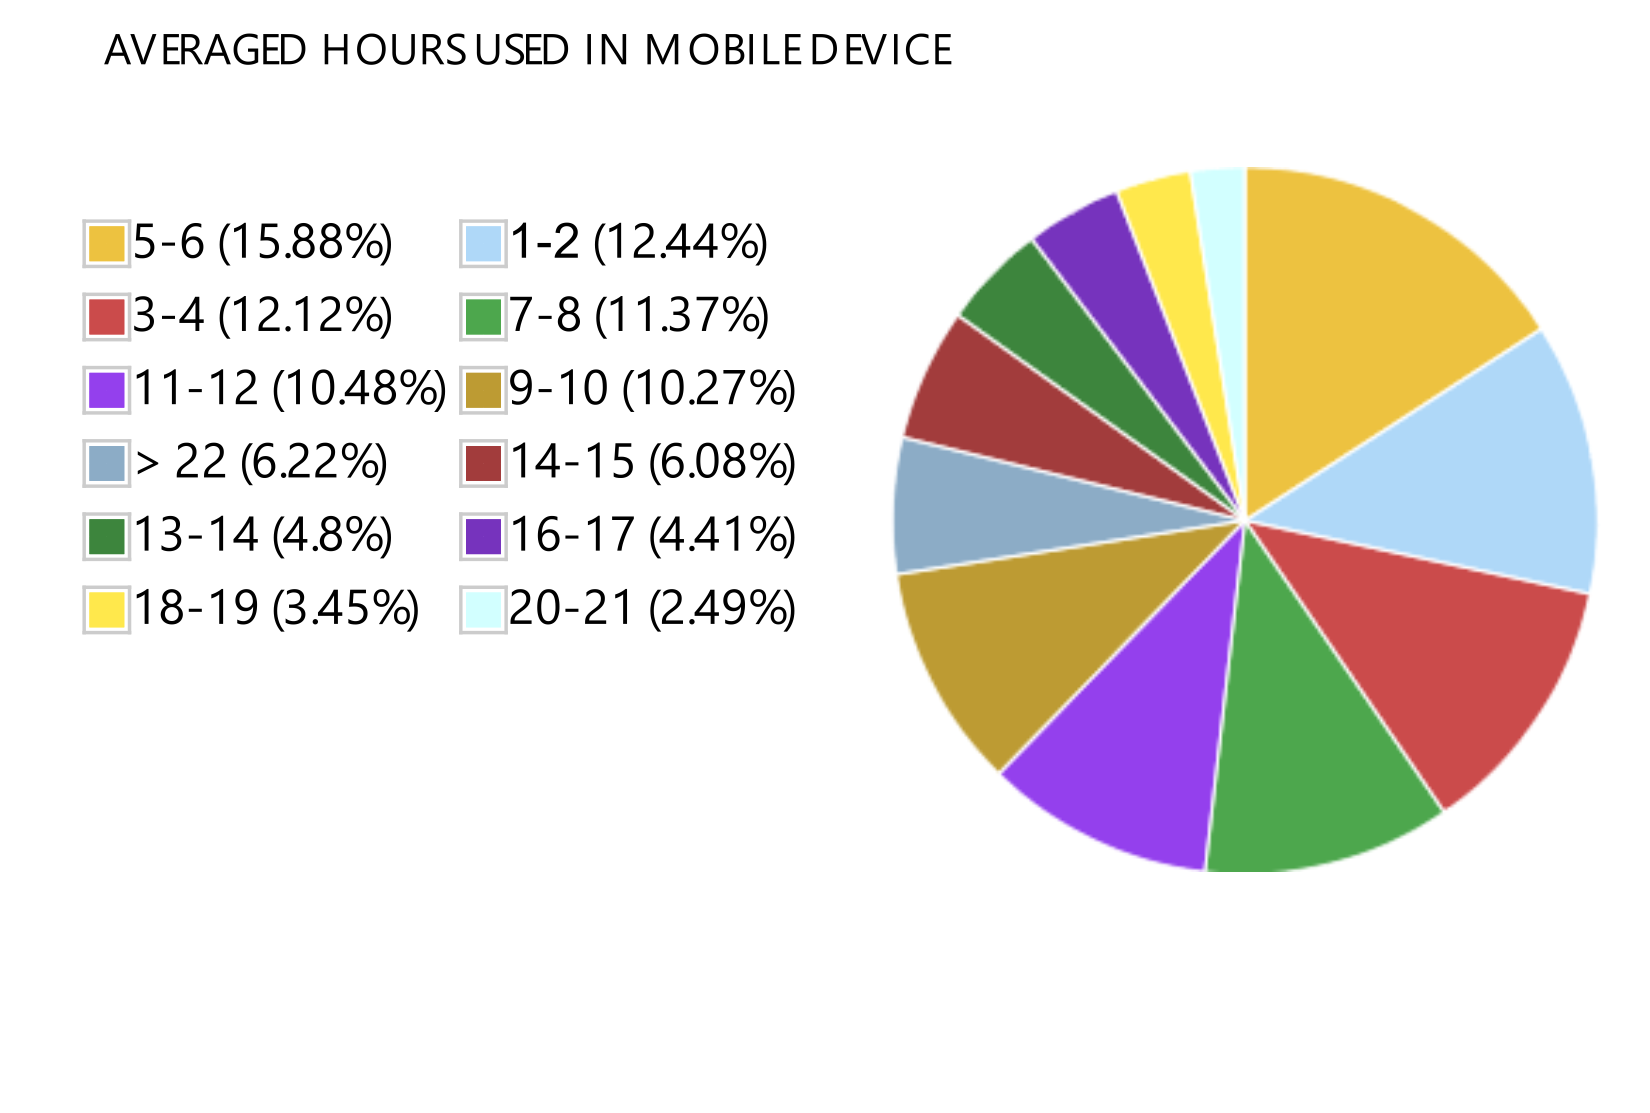 Most of respondents or 16.04% frequently using mobile device for 5-6 hours per day. Below that hours range, 12.33% respondents admits using 1-2 hours in a day to use their mobile device, 12.07% admits spending 3-4 hours a day, and 11.27% admits using 7-8 hours from their day. Above that range, 10,53% often using their mobile device 11-12 hours a day and 10,35% admits spending 9-10 hours using their mobile device. The other hours range that included in addiction category consist only of few percentage; 6,20% using more than 22 hours a day, 6,02% using 14-15 hours a day, 4,48% using 16-17 hours a day, 3,45% using 18-19 hours a day, and 2,50% using 20-21 hours per day.
Spend More Time on Mobile Device At Weekend 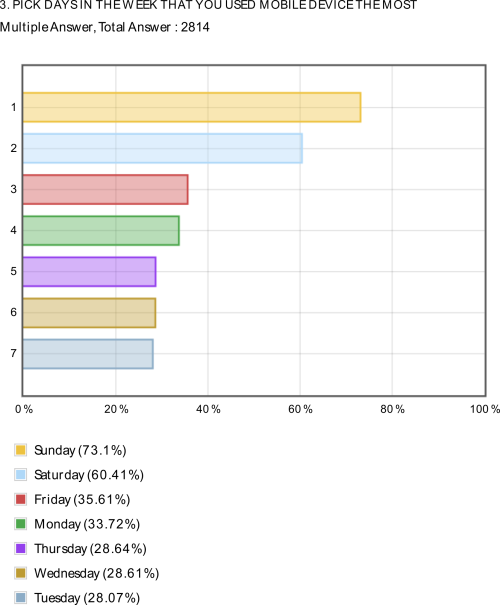 The most favorite day which people willing to spend their time using mobile device is Sunday (73.1%). Followed by Saturday (60.41%), then Friday (35.61%), and Monday (33.72%). Then we may assume that weekend is best timing to reach your user via smartphone because those are two days when they’re using it longer. Suprisingly though they are weekdays, Monday and Friday is higher than other weekdays.
Networking, Browsing, Gaming, Streaming. 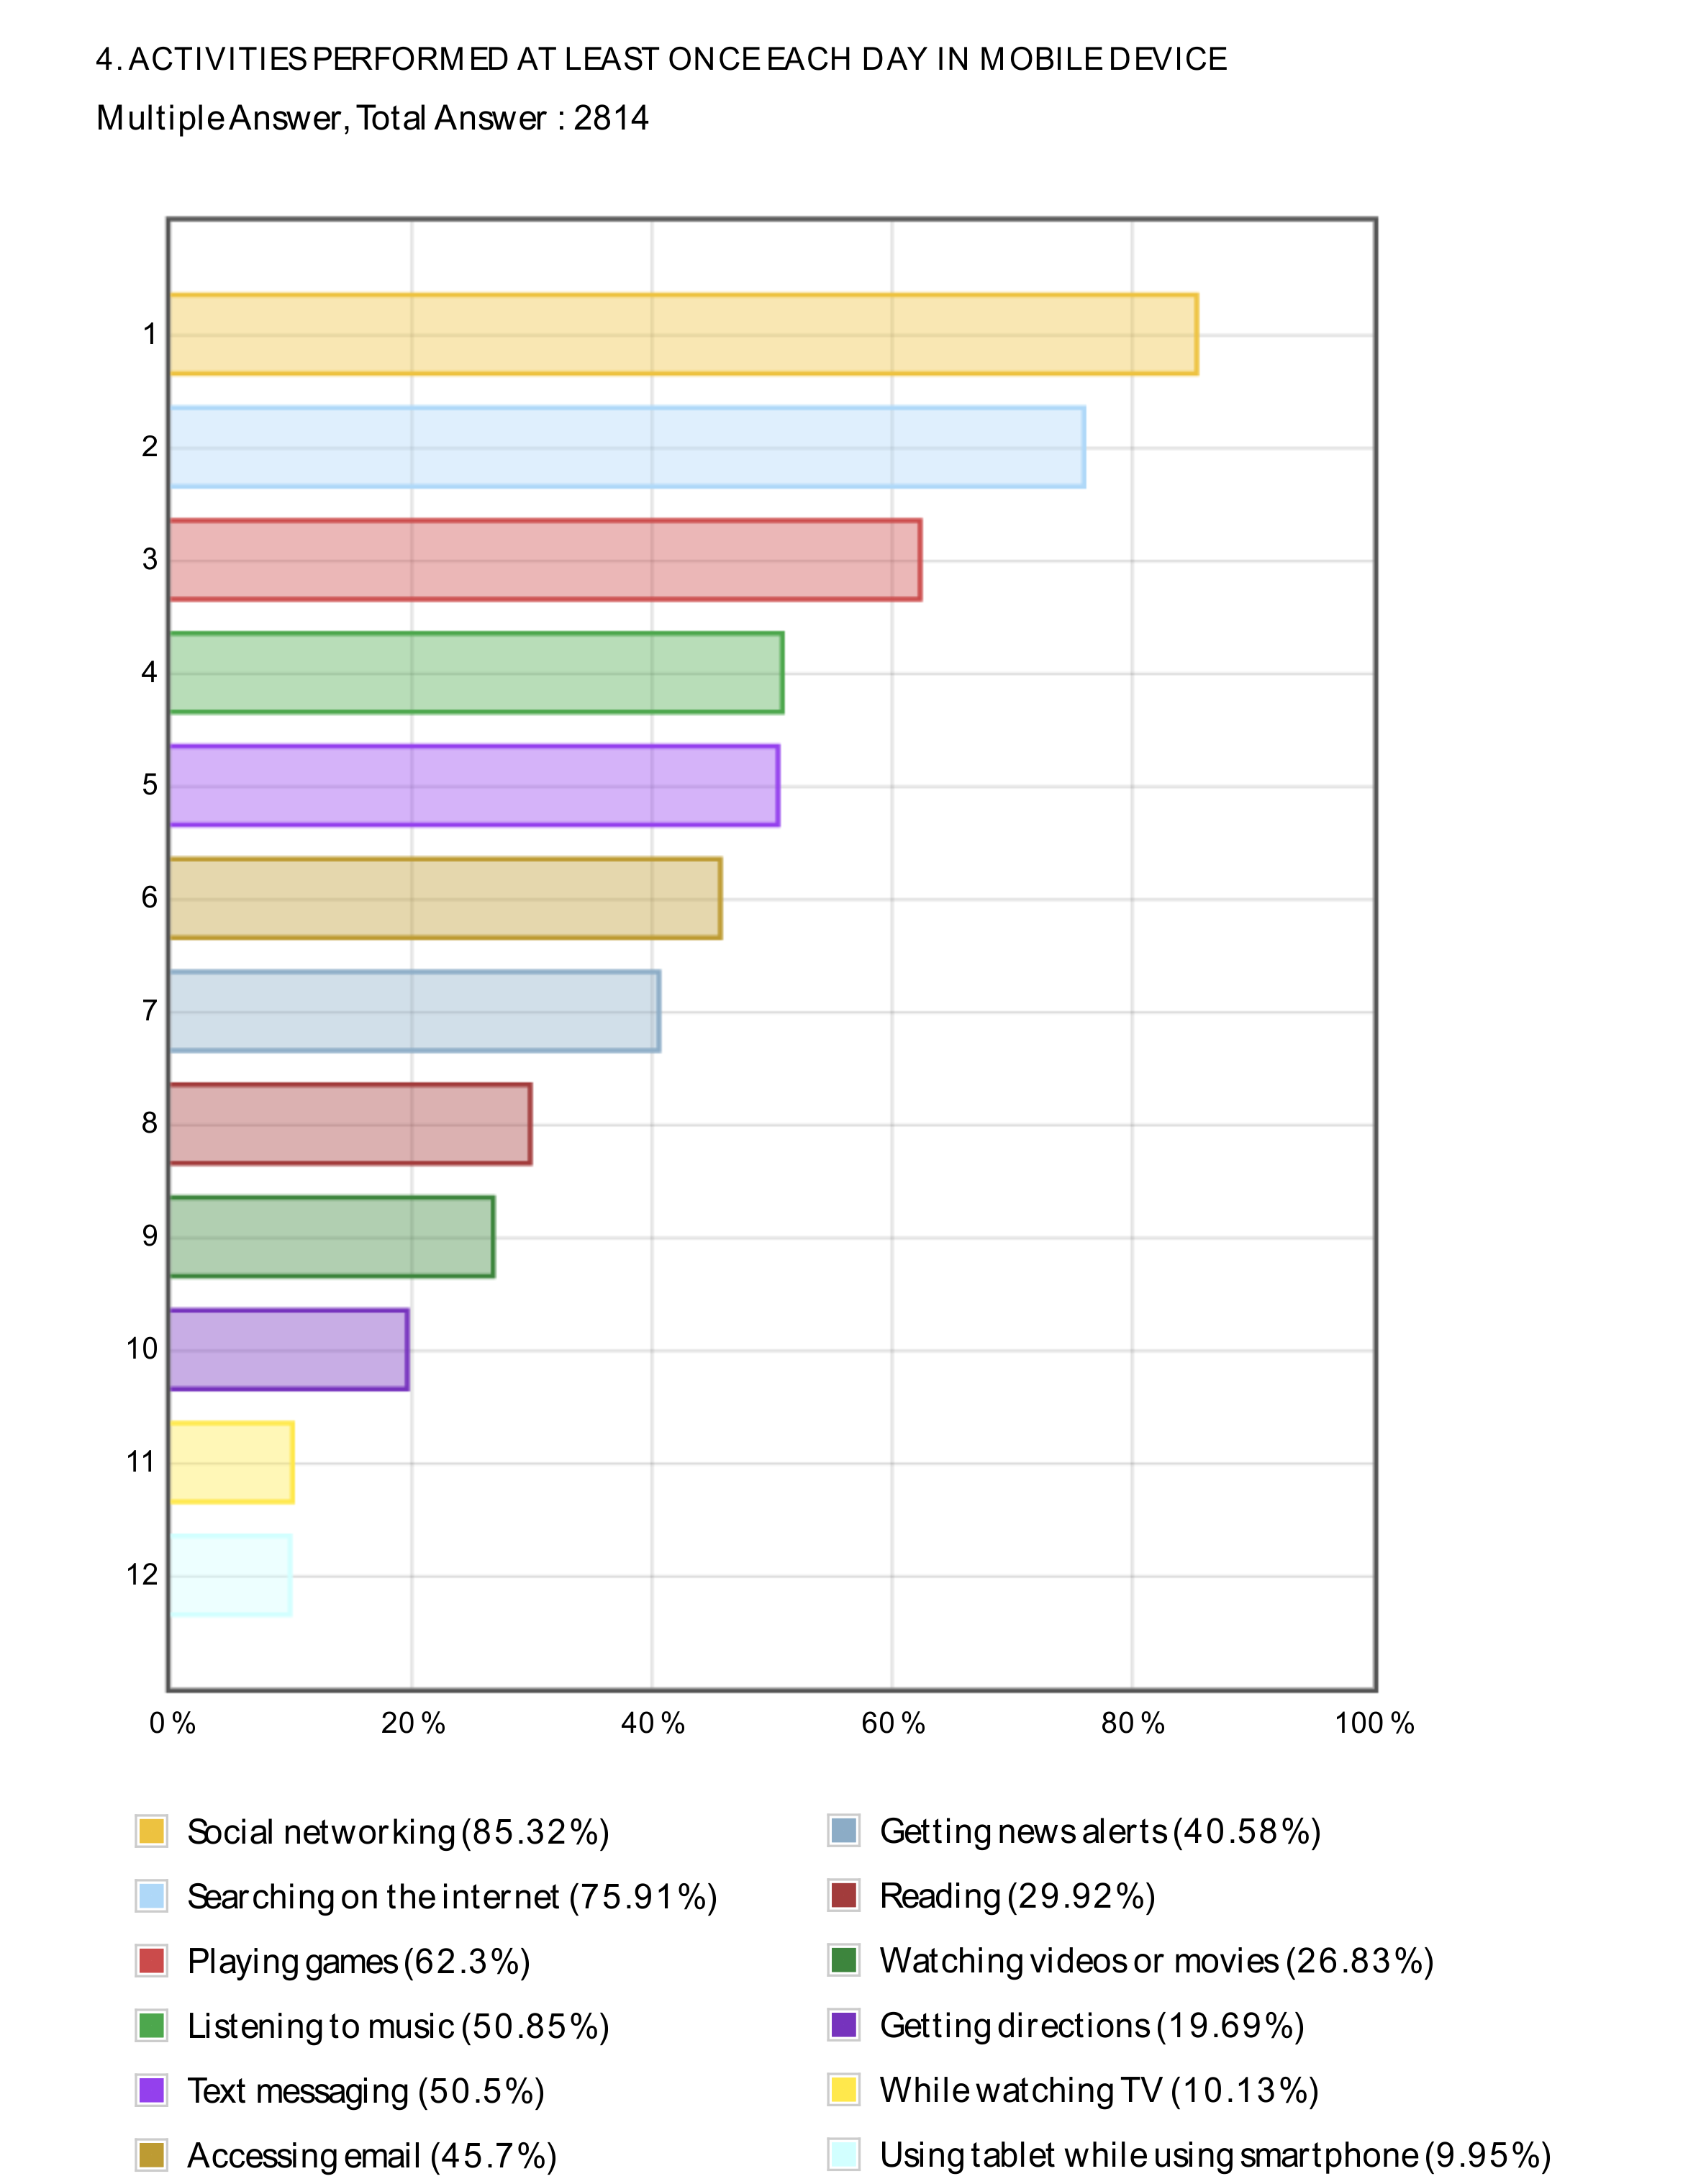 Top 5 Activities done at least once a day from their mobile device are Social Networking (85.32%), Browsing (75.91%), Gaming (62.3%), and Listen to the Music (50.85%). Following are activities like Texting (50.5%), Access email (45.7%), Getting News Alert (40.58%), Reading (29.92%). Watch video or movies on their mobile device are positioned below above activities.
How do users use their mobile device then? 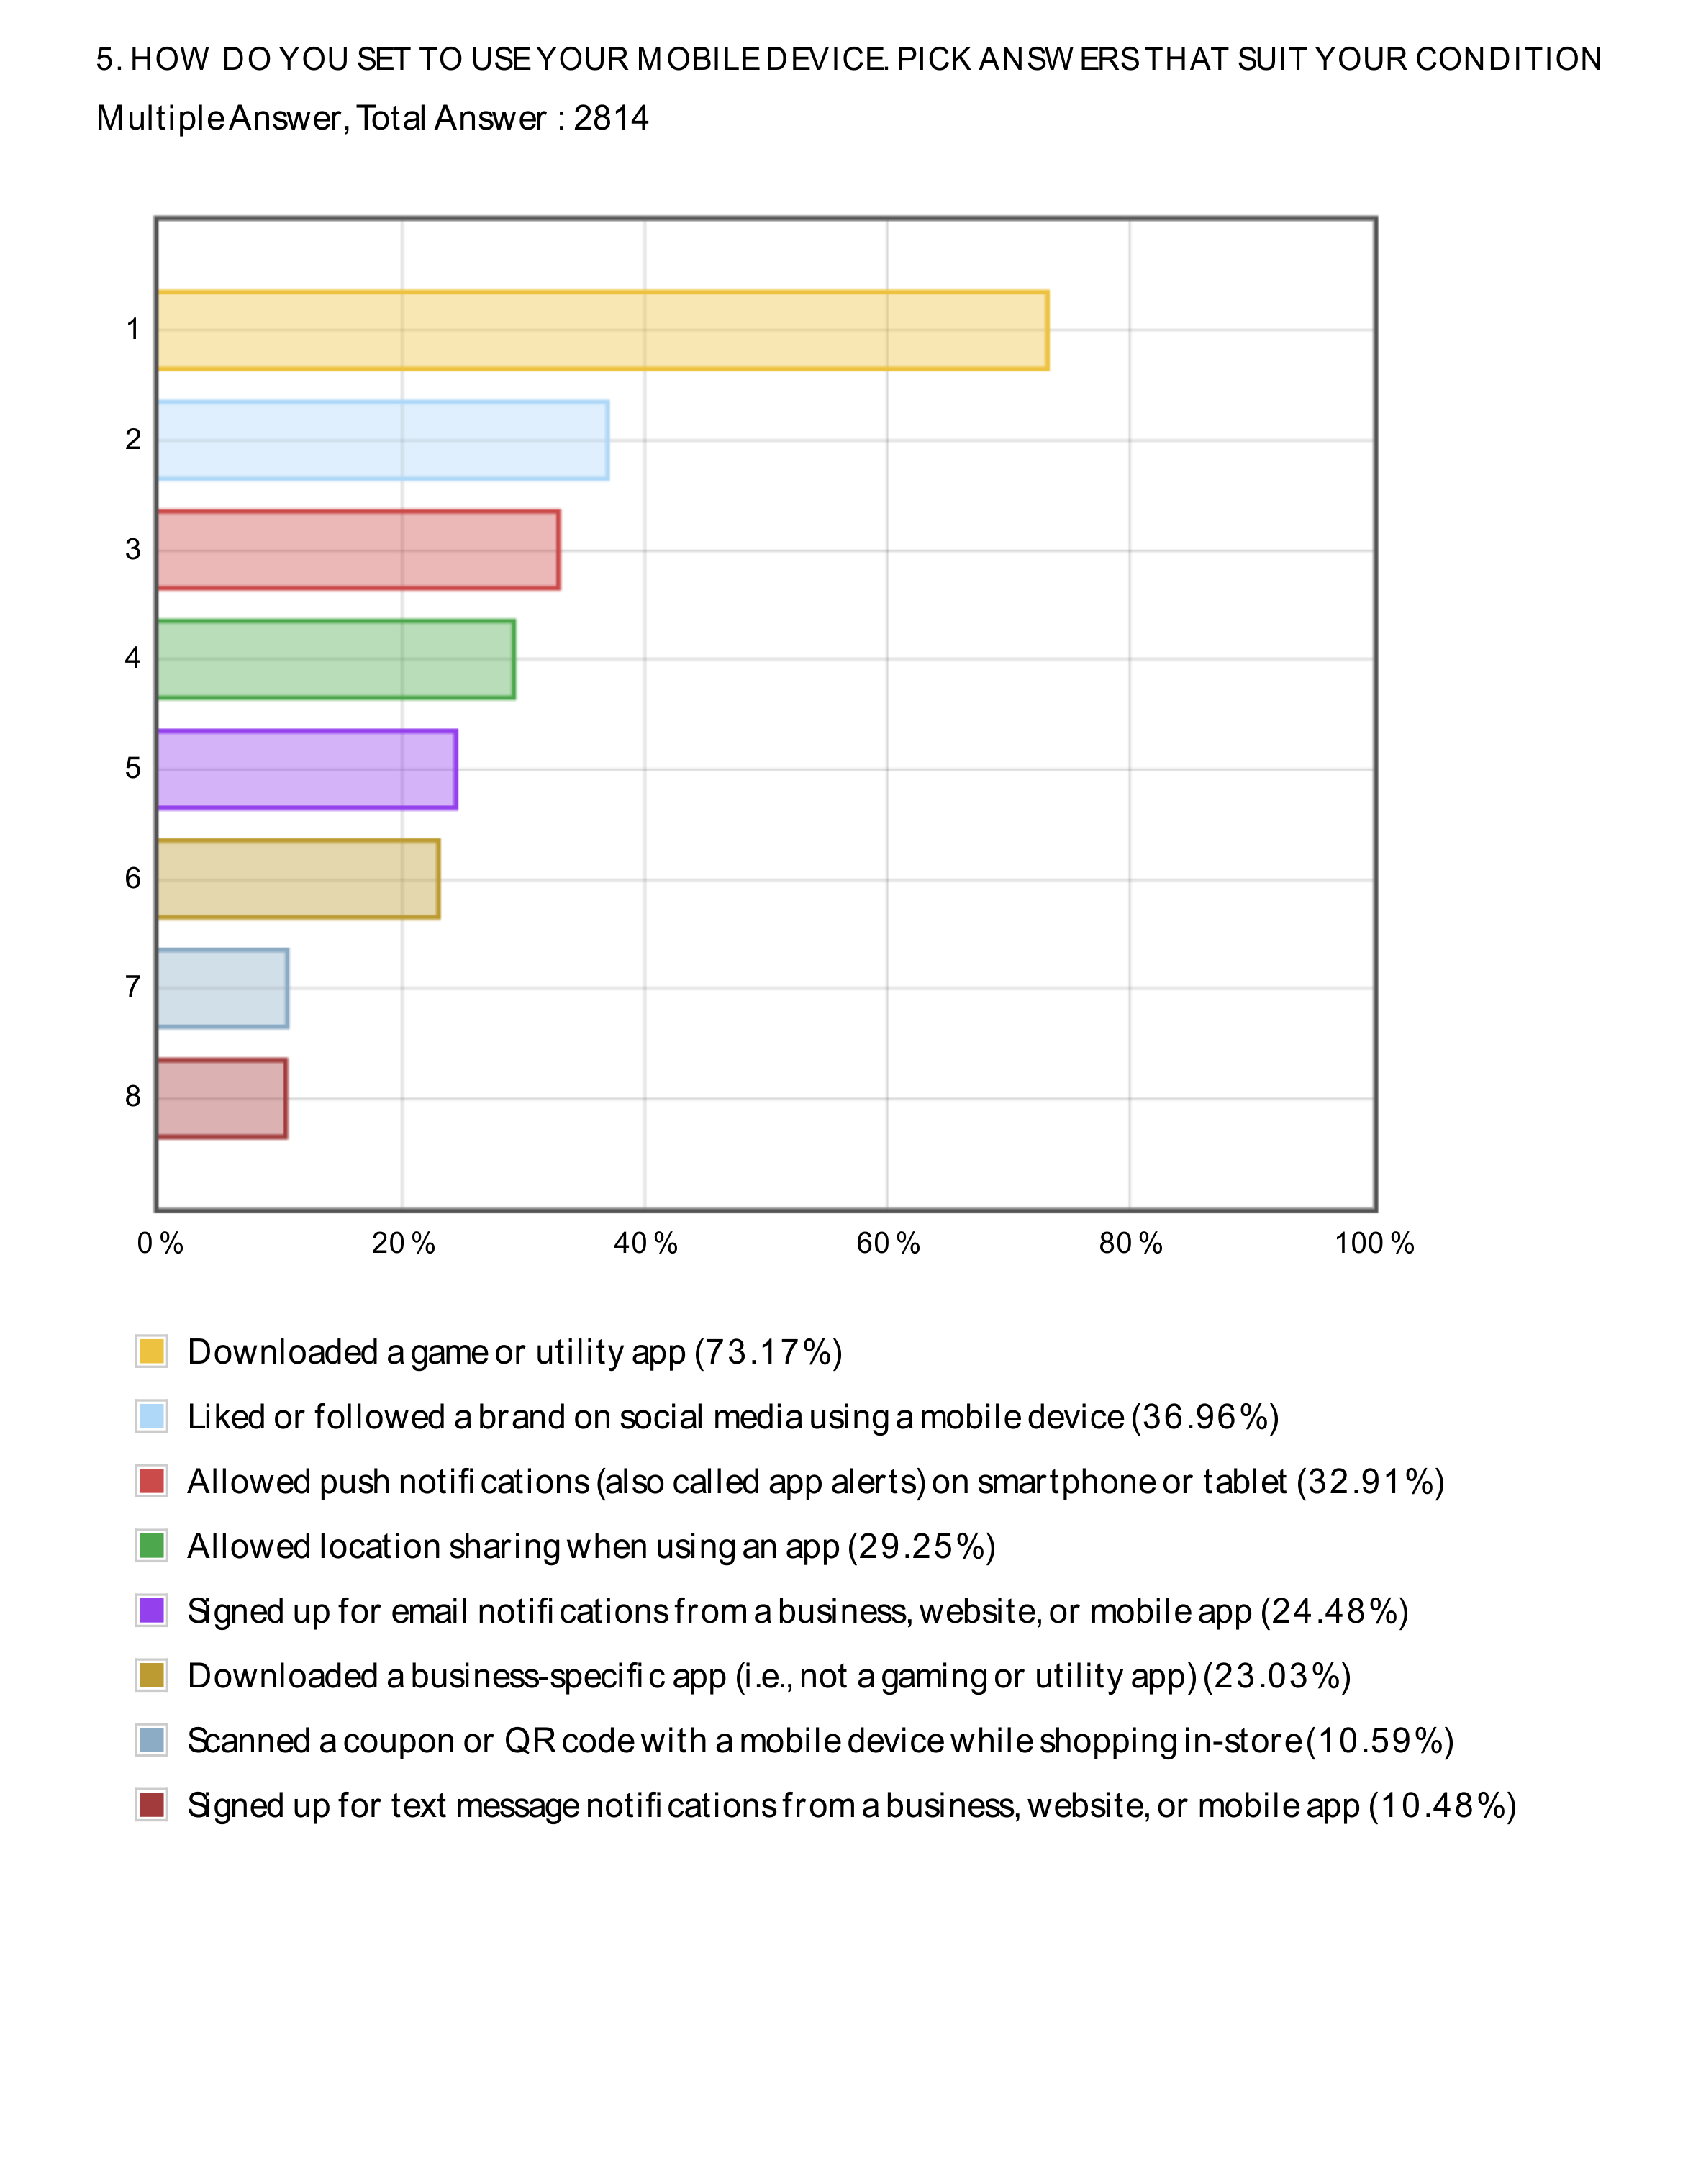 So then How users habit in using their mobile device?
We ask them to pick from the list the activities that suits their habit in using their mobile device. 73.17% respondents admits to downloaded a game or utility app in their smartphone. 36.96% admits they liked or followed a brand on social media through mobile device. In the same line, 32.91% respondents allow push notifications on their smartphone or tablet. 29.25% respondents allow location sharing when using an app and 24.48% respondents signed up for email notifications from a business, website, or mobile application.
Mobile Apps vs Mobile Browser 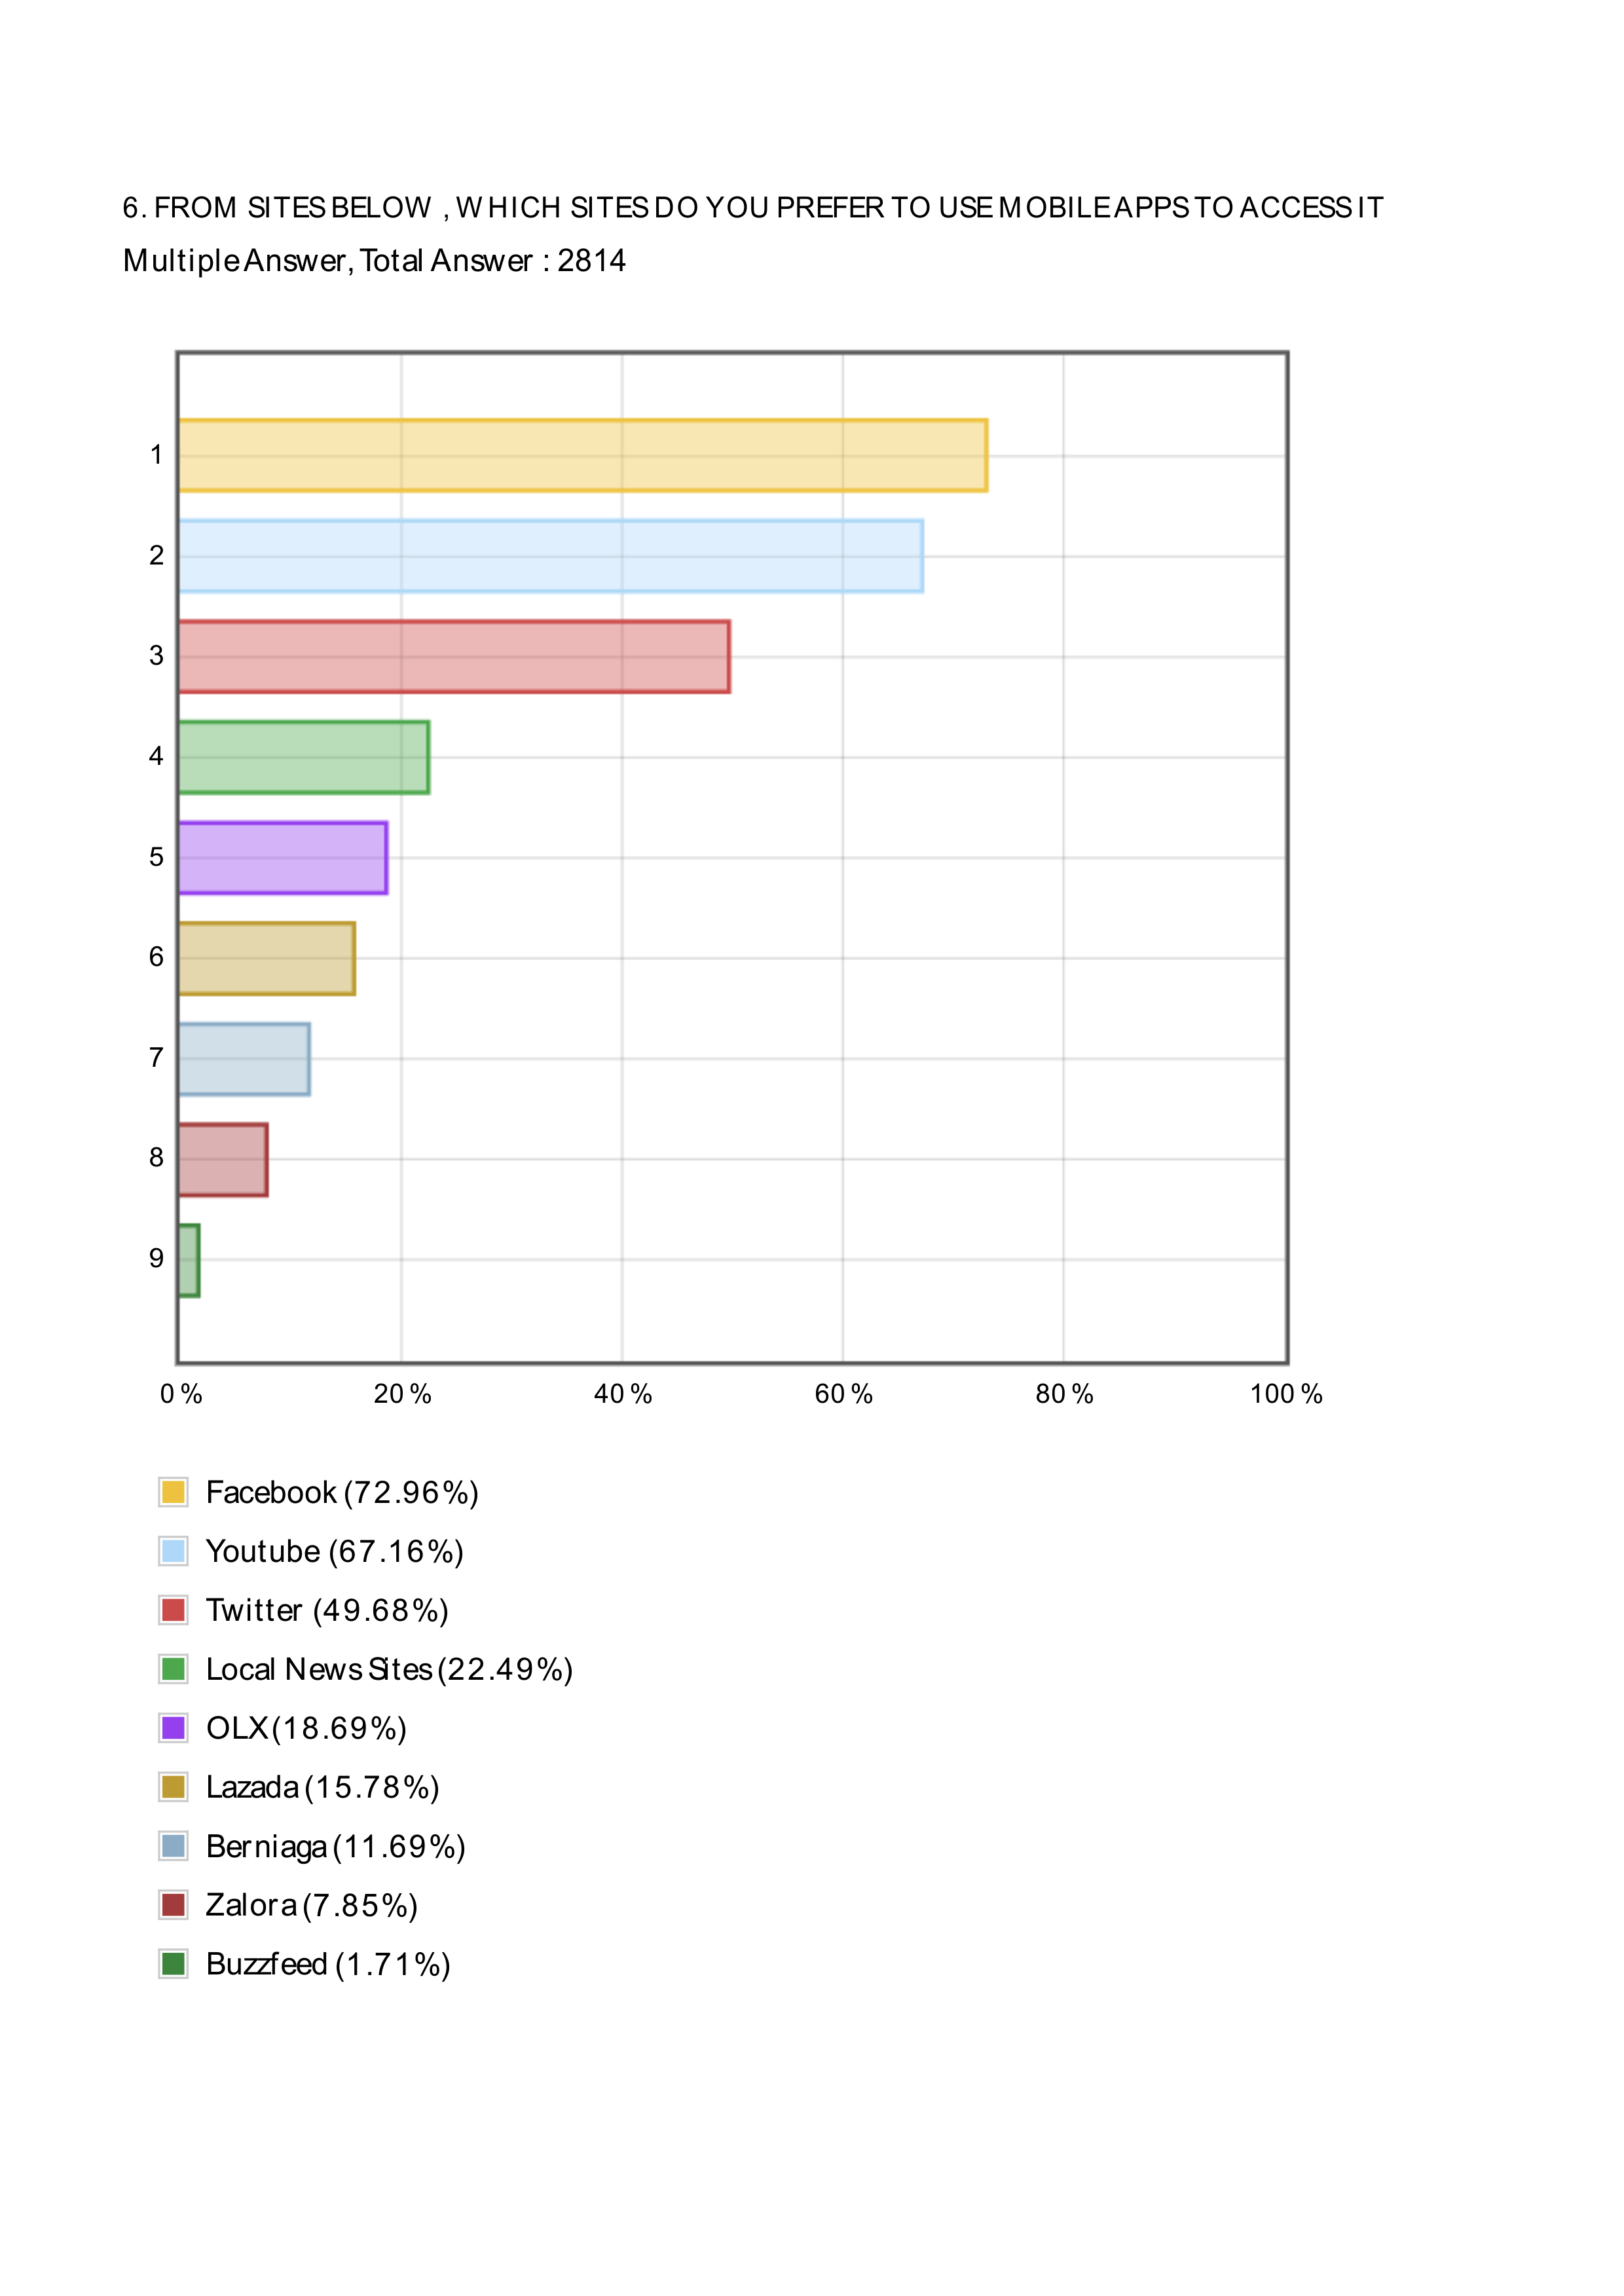
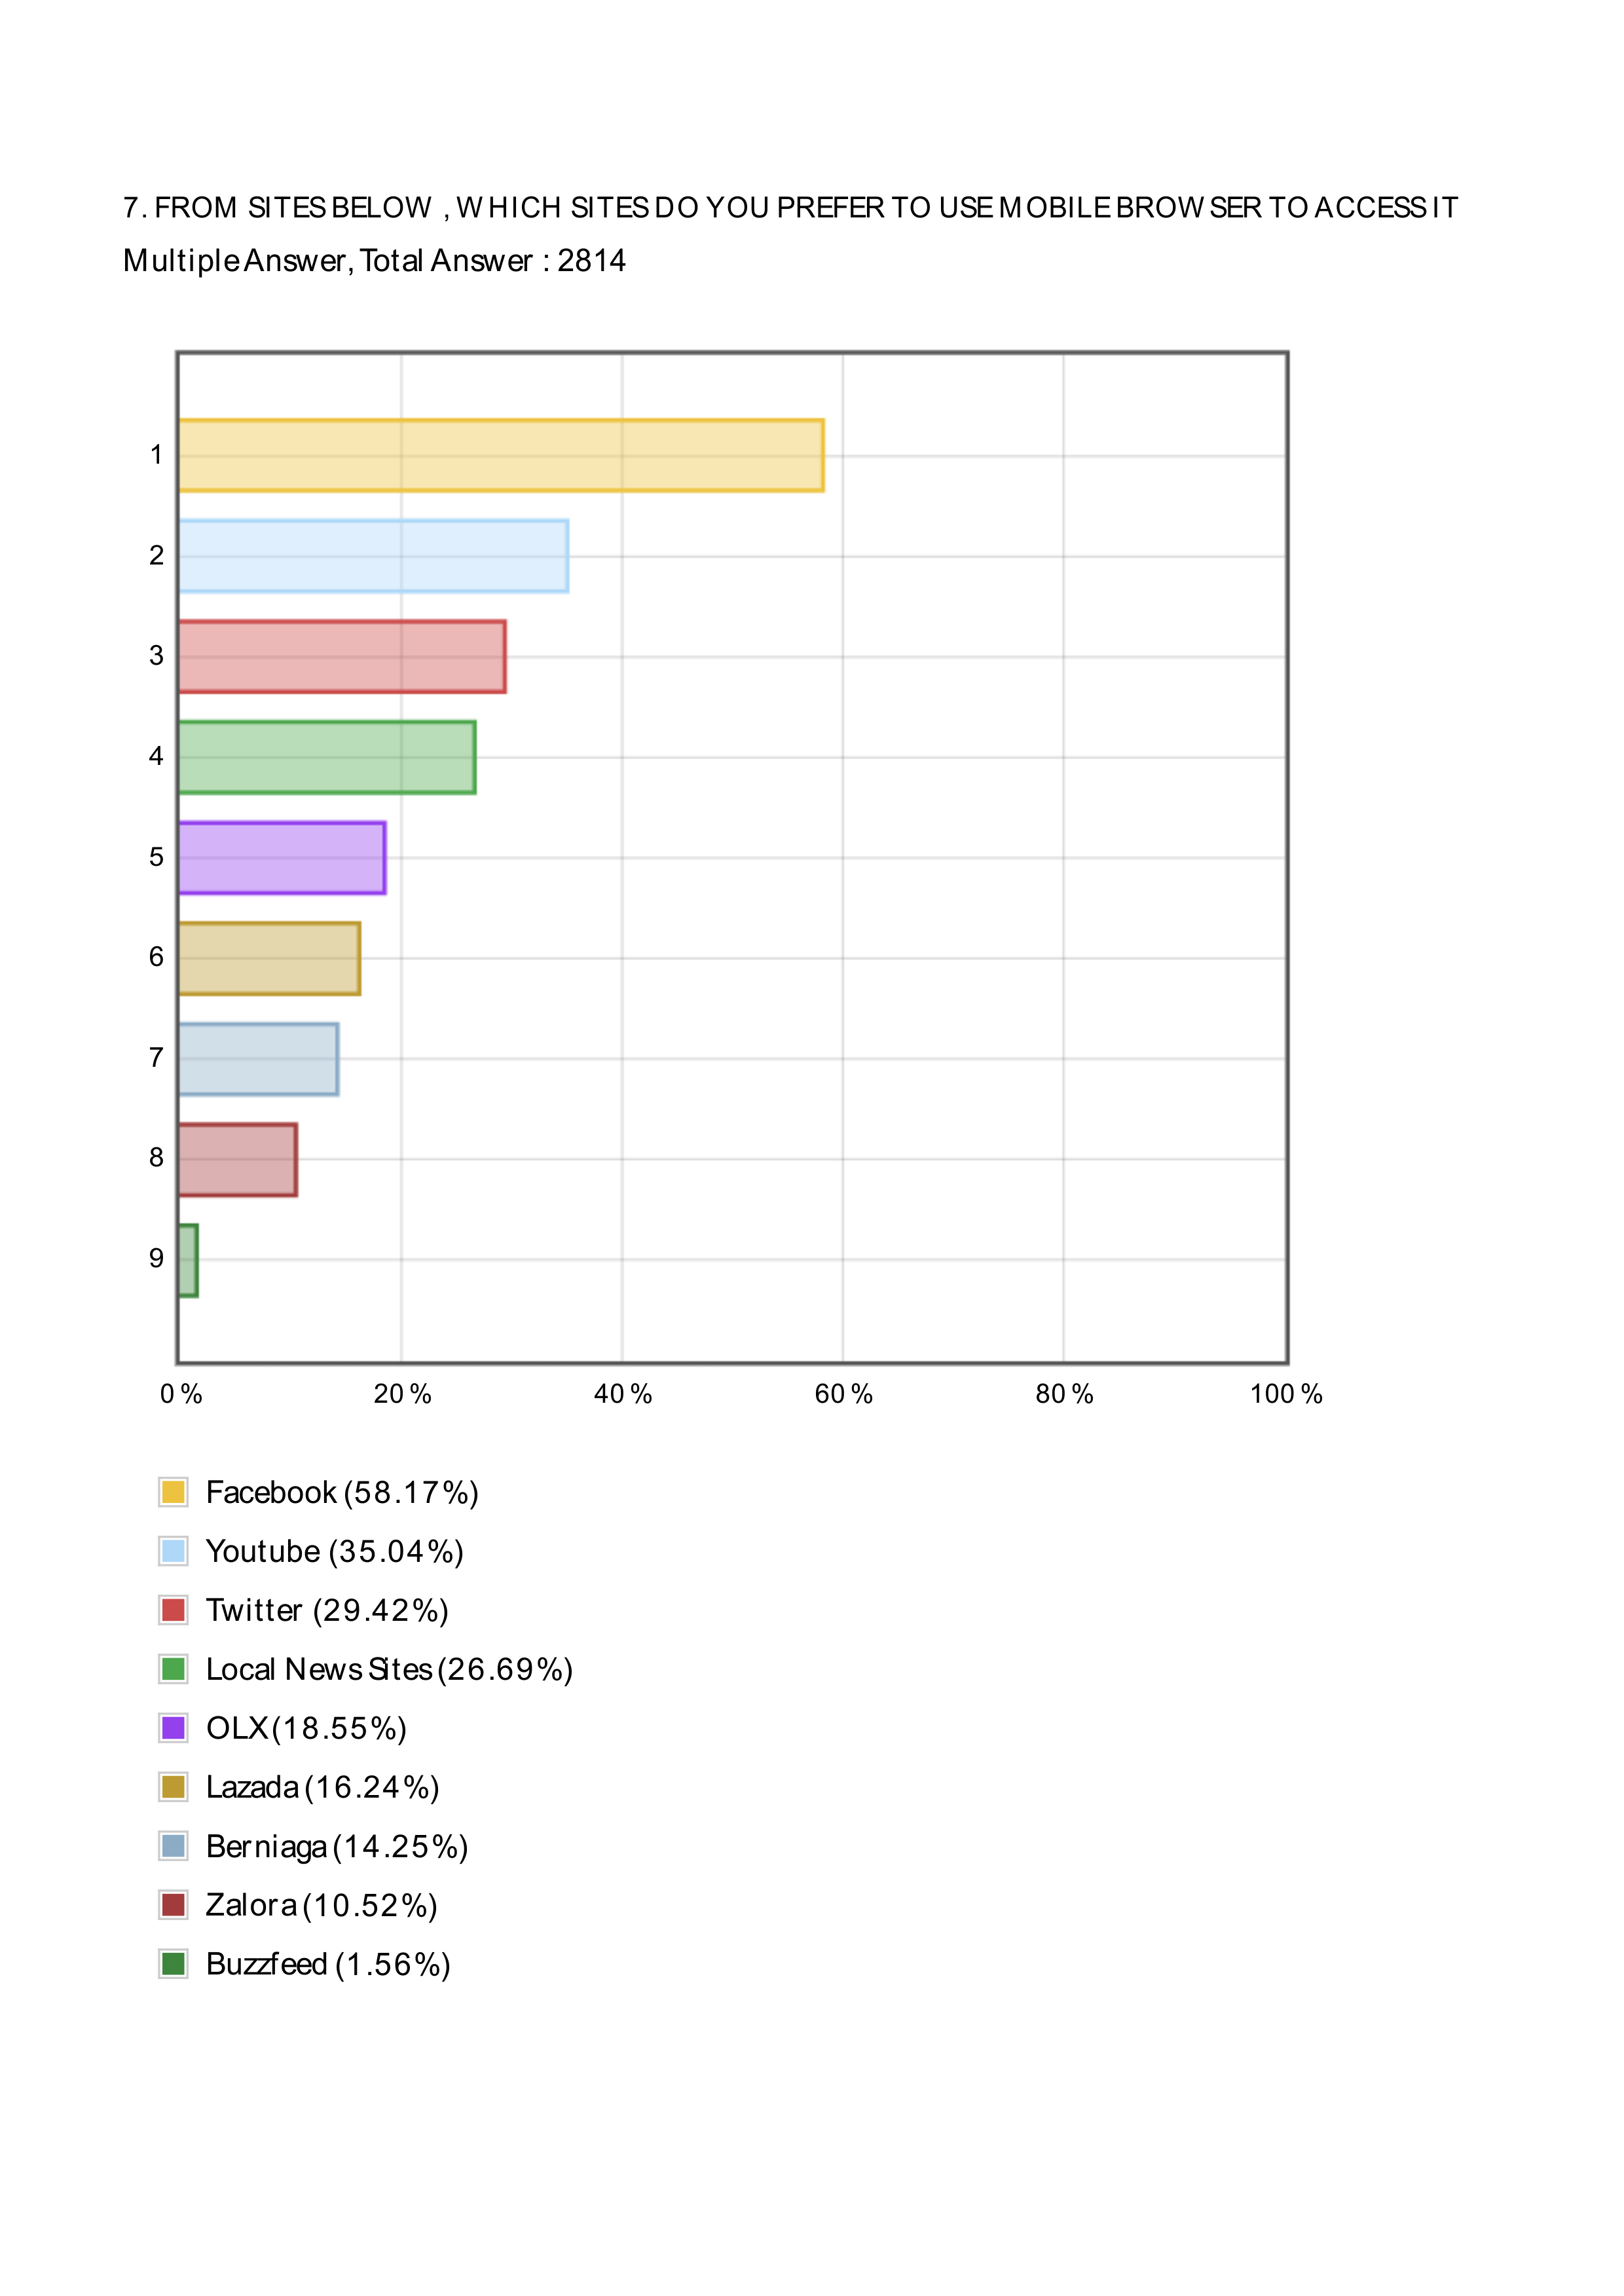 Do you prefer to use mobile apps or mobile browser to open certain site?
Mobile App vs Mobile Browser
Facebook (72.96%) vs (58.17%) Youtube (67.16%) vs (35.04%) Twitter (49.68%) vs (29.42%) Local News Sites (22.49%) vs (26.69%) OLX (18.69%) vs (18.55%) Lazada (15.78%) vs (16.24%) Berniaga (11.69%) vs (14.25%) Zalora (7.85%) vs (10.52%) Buzzfeed (1.71%) vs (1.56%)
— If you want to download the report please click download XLS report below. JAKPAT report consists of 3 parts which are 1) Respondent Profile, 2) Crosstabulation for each question and 3) Raw Data. Respondent profile shows you demographic profiles ( gendr,age range, location by province, and monthly spending). Cross tabulation enables you to define different demographic segment preference on each answer.
Click the icon to download XLS report
![]()
If you’re interested to do survey on retail and consumer goods field toward our respondents, we have over 23,000 mobile respondents ranged from age 17-50 years old, smartphone active users, and located in all regions of Indonesia that has installed our app and readily answering your survey. Those 23,000 respondents has been verified, profiled, and continuously tracked to make sure you get the updated profiles of them.
Our respondents has been profiled based on their demographic (age,gender,location, spending level, profession,religion), lifestyle habit (smoking/non, gamers/non, wearing glasses/non, frequent flyer/non, online shopper/non), and also brand consumption level ( brand A users, brand B users in FMCG, Retail, E-commerce,etc). If you want to do research toward our respondent, please signup here and directly create your survey there.
Or directly contact our Bizdev - Chrisprastika at +62-878-3908-9833. To non-Indonesian client, we offer free translation from foreign languages includes English, Chinese,Hindi,etc.
Source: http://www.campaignasia.com/BlogEntry/342662,Indonesia+%E2%80%93+the+world%E2%80%99s+most+social+mobile+centric+country.aspx
Thanks for a sharing all about indonesia mobile behaviour report 2014