


Instagram is not only social media for sharing photos and videos, but also social media for selling.
Many Instagram Sellers, from several different countries, and especially from Indonesia, sell their products here. They sell various products from body care to electronics. Those instagram sellers see the opportunity offered by Instagram, with 300 million users around the world, who will leave this profitable market? Therefore, they create their seller account on Instagram and promote pictures of their products.
Here, JAKPAT conducted a survey for online sellers on Instagram. We had 379 respondents on Instagram, that stated that they actively selling stuff on Instagram. This segment is gathered to our previous survey about “Are You Online Seller” that you can also read the report result here.
This segment in JAKPAT respondents are dominated by women (253 respondents); while men are only 126 respondents.
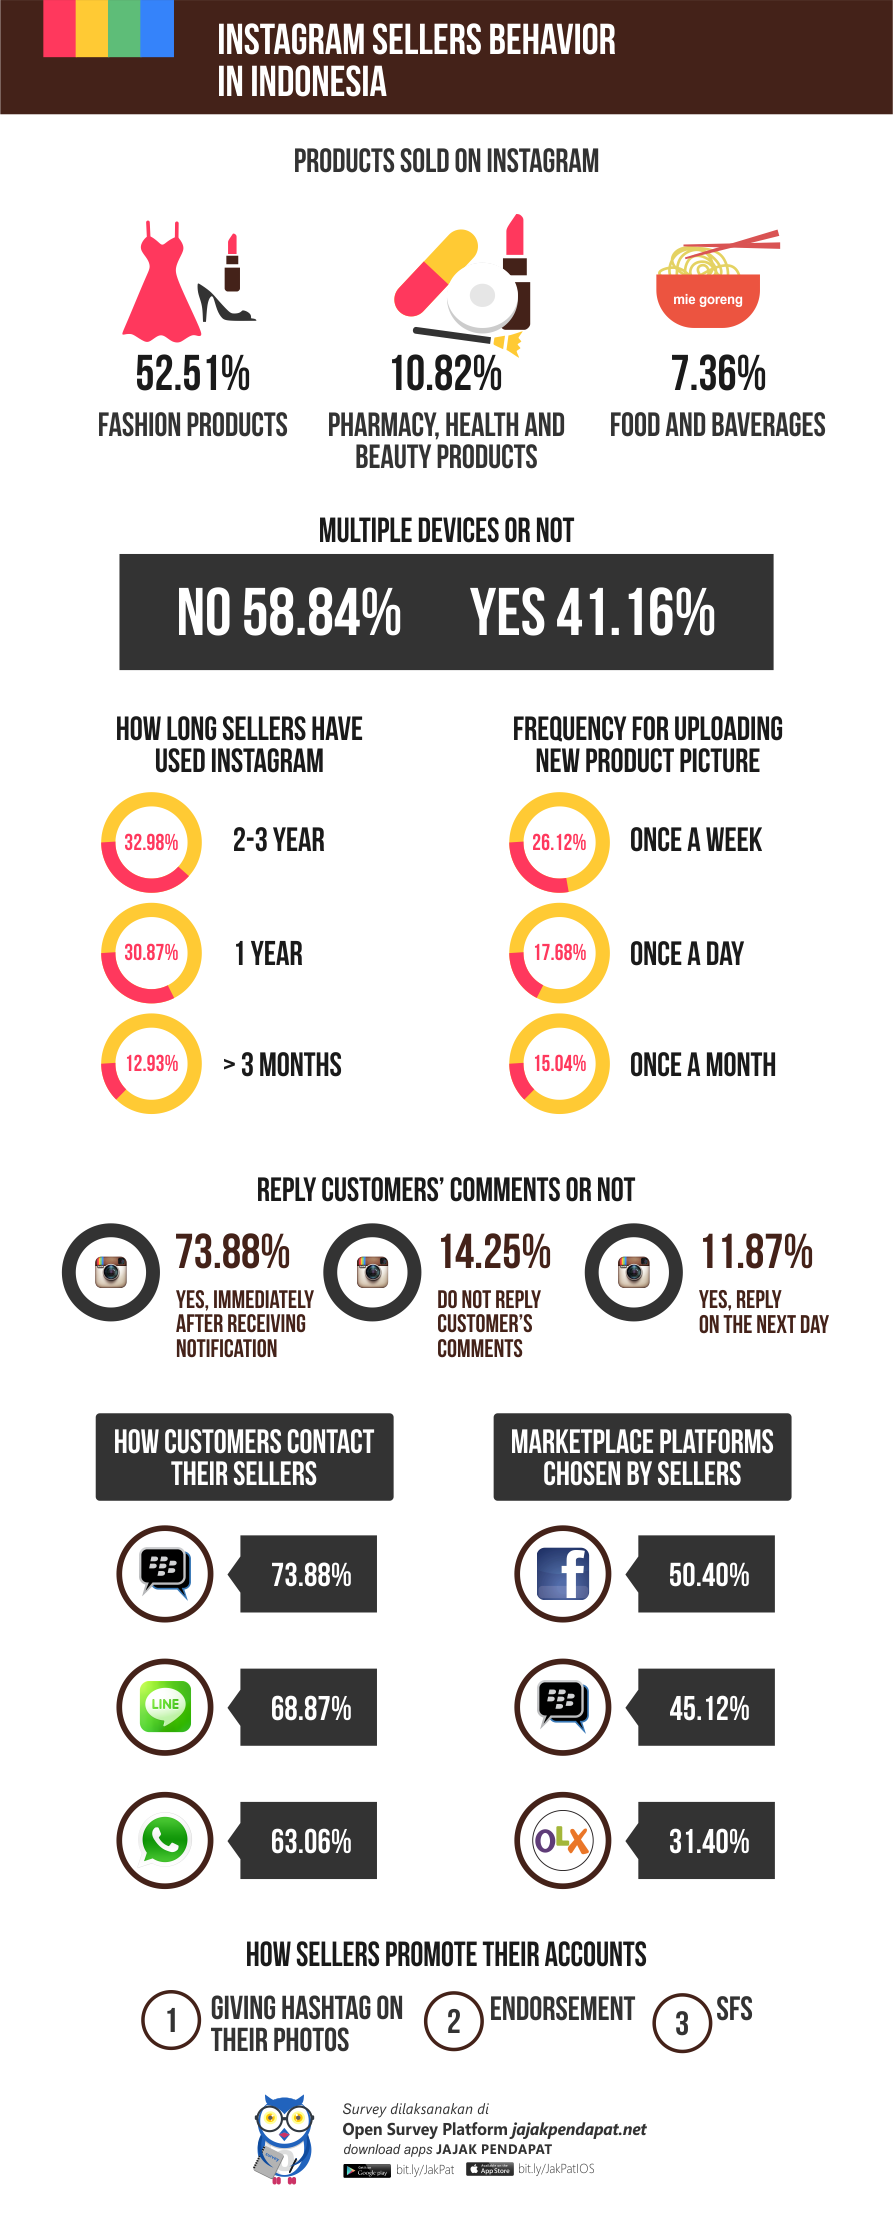
MORE THAN 50% RESPONDENTS SELL FASHION STUFF
| Q1 (single answer) : what kind of things do you sell on your Instagram account? | Total | Gender | |
| Male | Female | ||
| Option 1 : food and beverages | 41 | 13 | 28 |
| 10,82% | 10,32% | 11,07% | |
| Option 2 : pharmacy, health and beauty stuff (perfume, toiletries, body lotion, etc) | 41 | 6 | 35 |
| 10,82% | 4,76% | 13,83% | |
| Option 3 : fashion (cloth, shoes, sandals, etc) | 199 | 52 | 147 |
| 52,51% | 41,27% | 58,10% | |
| Option 4 : hand phone or gadget (camera, tablet, smartphone, etc) | 39 | 28 | 11 |
| 10,29% | 22,22% | 4,35% | |
| Option 5 : electronic kitchenware or kitchenware (mixer, blender, plate, spoon, knife, etc) | 3 | 1 | 2 |
| 0,79% | 0,79% | 0,79% | |
| Option 6 : watch or accessories | 38 | 17 | 21 |
| 10,03% | 13,49% | 8,30% | |
| Option 7 : electronics (television, MP3 player, DVD player, etc) | 6 | 3 | 3 |
| 1,58% | 2,38% | 1,19% | |
| Option 8 : toys or baby and kids’ stuff | 12 | 6 | 6 |
| 3,17% | 4,76% | 2,37% | |
| Total | 379 | 126 | 253 |
| 100,00% | 100,00% | 100,00% | |
Based on our survey, the first most sold products on Instagram is fashion product such as clothing, shoes, accessories, etc (52.51%). The second most traded products are food and beverages and stuff categorized as pharmacy, health and beauty stuff with percentage of 10.82% respectively. Fashion product may become the most traded product on Instagram because most sellers on Instagram are women. Secondly , Instagram strong feature is their beautiful photo filter which can visualize fashion related product better, so seller can display the product better on Instagram compare in other platform.
IN GENERAL, 55%+ OF RESPONDENTS DO NOT USE MULTIPLE DEVICES
Because Instagram cannot allow two accounts on the same smartphone, we asked respondents whether they use multiple devices or not. We were curious whether they have multiple device for multiple account ( For Thus, we found that generally, most respondents do not use multiple devices (58.84%).
| Q2 (single answer) : do you use multiple devices (one for instagram private account and the other for instagram vendor account)? | Total | Gender | |
| Male | Female | ||
| Option 1 : yes | 156 | 66 | 90 |
| 41,16% | 52,38% | 35,57% | |
| Option 2 : no | 223 | 60 | 163 |
| 58,84% | 47,62% | 64,43% | |
| Total | 379 | 126 | 253 |
| 100,00% | 100,00% | 100,00% | |
Nevertheless, more male respondents use multiple devices (52.38%), which is higher than female respondents. We also found that Instagram’s seller who are selling hand phone or gadget tend to use multiple devices, in which they all might be male respondents.
By using Custom Crosstab Feature in JAKPAT Dashboard we create a Cross Tabulation or Pivot Table : Q1 ( Things Sold in Instagram ) vs All Questions. In this section, we want to compare what kind of seller (based on the things they sold) use multiple device.
|
Q2 (single answer) : do you use multiple devices (one for instagram private account and the other for instagram vendor account)?
|
Q1 (single answer) : what kind of things do you sell on your Instagram account? | |||||||
| food and beverages | pharmacy, health and beauty stuff (perfume, toiletries, body lotion, etc) | fashion (cloth, shoes, sandals, etc) | hand phone or gadget (camera, tablet, smartphone, etc) | electronic kitchenware or kitchenware (mixer, blender, plate, spoon, knife, etc) | watch or accessories | electronics (television, MP3 player, DVD player, etc) | toys or baby and kids’ stuff | |
|
Option 1 : yes
|
11 | 18 | 86 | 24 | 0 | 10 | 2 | 5 |
| 26.83% | 43.90% | 43.22% | 61.54% | 0.00% | 26.32% | 33.33% | 41.67% | |
|
Option 2 : no
|
30 | 23 | 113 | 15 | 3 | 28 | 4 | 7 |
| 73.17% | 56.10% | 56.78% | 38.46% | 100.00% | 73.68% | 66.67% | 58.33% | |
|
Total
|
41 | 41 | 199 | 39 | 3 | 38 | 6 | 12 |
| 100.00% | 100.00% | 100.00% | 100.00% | 100.00% | 100.00% | 100.00% | 100.00% | |
We found that More Instagram’s seller who are selling hand phone or gadget tend to use multiple devices, in which they all might be more male respondents.
GENERALLY, 60%+ OF INSTAGRAM SELLERS HERE HAVE USED INSTAGRAM FOR AT LEAST 1 YEAR
| Q3 (single answer) : when did you create your vendor account? | Total | Gender | |
| Male | Female | ||
| Option 1 : 1 week ago | 3 | 1 | 2 |
| 0,79% | 0,79% | 0,79% | |
| Option 2 : 2-3 weeks ago | 11 | 7 | 4 |
| 2,90% | 5,56% | 1,58% | |
| Option 3 : more than 3 weeks ago | 3 | 1 | 2 |
| 0,79% | 0,79% | 0,79% | |
| Option 4 : 1 month ago | 15 | 6 | 9 |
| 3,96% | 4,76% | 3,56% | |
| Option 5 : 2-3 months ago | 25 | 9 | 16 |
| 6,60% | 7,14% | 6,32% | |
| Option 6 : more than 3 months ago | 49 | 16 | 33 |
| 12,93% | 12,70% | 13,04% | |
| Option 7 : 1 year ago | 117 | 37 | 80 |
| 30,87% | 29,37% | 31,62% | |
| Option 8 : 2-3 years ago | 125 | 40 | 85 |
| 32,98% | 31,75% | 33,60% | |
| Option 9 : more than 3 years ago | 28 | 7 | 21 |
| 7,39% | 5,56% | 8,30% | |
| Option 10 : less than 1 week ago | 3 | 2 | 1 |
| 0,79% | 1,59% | 0,40% | |
We also wanted to know how long they have their accounts on Instagram, thus we asked them. Most respondents answered that they have had accounts on Instagram for two or three years (32.98%), and some other respondents have had their accounts for one year (30.87%). So we can conclude that most respondents have used Instagram for at least one year (63.85%). The rest at least have used Instagram accounts for one month.
IN GENERAL, MOST RESPONDENTS UPLOAD NEW PRODUCTS FREQUENTLY
| Q4 (single answer) : how often do you upload your new stuff? | Total | Gender | |
| Male | Female | ||
| Option 1 : once a day | 67 | 27 | 40 |
| 17,68% | 21,43% | 15,81% | |
| Option 2 : 2-3 times a day | 55 | 17 | 38 |
| 14,51% | 13,49% | 15,02% | |
| Option 3 : more than 3 times a day | 26 | 10 | 16 |
| 6,86% | 7,94% | 6,32% | |
| Option 4 : once a week | 99 | 31 | 68 |
| 26,12% | 24,60% | 26,88% | |
| Option 5 : 2-3 times a week | 16 | 8 | 8 |
| 4,22% | 6,35% | 3,16% | |
| Option 6 : more than 3 times a week | 3 | 1 | 2 |
| 0,79% | 0,79% | 0,79% | |
| Option 7 : once a month | 57 | 15 | 42 |
| 15,04% | 11,90% | 16,60% | |
| Option 8 : 2-3 times a month | 36 | 9 | 27 |
| 9,50% | 7,14% | 10,67% | |
| Option 9 : more than 3 times a month | 20 | 8 | 12 |
| 5,28% | 6,35% | 4,74% | |
We also tried to know their frequency for uploading their new products. In general, most of them upload new products frequently (70.18%). Those are vendors uploading new products 1-3 times and more than 3 times a day and those uploading new products 1-3 times a week and more than 3 times a week.
In this survey, we also found that vendors selling toys or baby and kids’ stuff tend to upload their new products once a day. They are the most active vendors, compared with vendor selling fashion products, which is the majority of vendors in this survey. You can find it also by using JAKPAT’S Custom Crosstable shown below capturing specific section comparing Things Sold vs Upload Frequency :
|
Q4 (single answer) : how often do you upload your new stuff?
|
Q1 (single answer) : what kind of things do you sell on your Instagram account? | |||||||
| food and beverages | pharmacy, health and beauty stuff (perfume, toiletries, body lotion, etc) | fashion (cloth, shoes, sandals, etc) | hand phone or gadget (camera, tablet, smartphone, etc) | electronic kitchenware or kitchenware (mixer, blender, plate, spoon, knife, etc) | watch or accessories | electronics (television, MP3 player, DVD player, etc) | toys or baby and kids’ stuff | |
|
Option 1 : once a day
|
8 | 6 | 38 | 9 | 0 | 1 | 0 | 5 |
| 19.51% | 14.63% | 19.10% | 23.08% | 0.00% | 2.63% | 0.00% | 41.67% | |
|
Option 2 : 2-3 times a day
|
3 | 6 | 30 | 5 | 1 | 6 | 2 | 2 |
| 7.32% | 14.63% | 15.08% | 12.82% | 33.33% | 15.79% | 33.33% | 16.67% | |
|
Option 3 : more than 3 times a day
|
1 | 1 | 18 | 1 | 0 | 4 | 0 | 1 |
| 2.44% | 2.44% | 9.05% | 2.56% | 0.00% | 10.53% | 0.00% | 8.33% | |
|
Option 4 : once a week
|
11 | 16 | 46 | 13 | 0 | 11 | 1 | 1 |
| 26.83% | 39.02% | 23.12% | 33.33% | 0.00% | 28.95% | 16.67% | 8.33% | |
|
Option 5 : 2-3 times a week
|
1 | 3 | 6 | 1 | 0 | 4 | 0 | 1 |
| 2.44% | 7.32% | 3.02% | 2.56% | 0.00% | 10.53% | 0.00% | 8.33% | |
|
Option 6 : more than 3 times a week
|
0 | 0 | 2 | 1 | 0 | 0 | 0 | 0 |
| 0.00% | 0.00% | 1.01% | 2.56% | 0.00% | 0.00% | 0.00% | 0.00% | |
|
Option 7 : once a month
|
9 | 2 | 35 | 4 | 1 | 6 | 0 | 0 |
| 21.95% | 4.88% | 17.59% | 10.26% | 33.33% | 15.79% | 0.00% | 0.00% | |
|
Option 8 : 2-3 times a month
|
5 | 6 | 16 | 3 | 0 | 3 | 1 | 2 |
| 12.20% | 14.63% | 8.04% | 7.69% | 0.00% | 7.89% | 16.67% | 16.67% | |
|
Option 9 : more than 3 times a month
|
3 | 1 | 8 | 2 | 1 | 3 | 2 | 0 |
| 7.32% | 2.44% | 4.02% | 5.13% | 33.33% | 7.89% | 33.33% | 0.00% | |
|
Total
|
41 | 41 | 199 | 39 | 3 | 38 | 6 | 12 |
| 100.00% | 100.00% | 100.00% | 100.00% | 100.00% | 100.00% | 100.00% | 100.00% | |
70%+ OF INSTAGRAM SELLERS REPLY CUSTOMERS’ COMMENTS ON INSTAGRAM
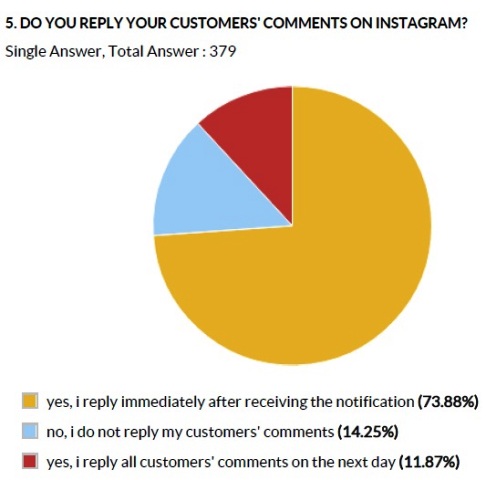
Respondents whether female or male respondents, prefer to reply their customers’ comments after receiving the notification (73.88%).
BBM BECOMES THE MAIN CHOICE FOR COMMUNICATION BETWEEN INSTAGRAM’S SELLER AND CUSTOMERS
In spite of many private chatting apps nowadays, most respondents’ customers still prefer to use BBM for contacting their vendors (73.88%). LINE is the second most chosen app for communicating by their customers (68.87%), and Whatsapp is the third most chosen alternative (63.06%).
| Q6 (multiple answer) : how do your Instagram customers contact you for ordering your stuff? | Total | Gender | |
| Male | Female | ||
| Option 1 : they contact me via SMS | 216 | 85 | 131 |
| 56,99% | 22,43% | 34,56% | |
| Option 2 : they contact me via phone call | 102 | 54 | 48 |
| 26,91% | 14,25% | 12,66% | |
| Option 3 : they contact me via LINE | 261 | 74 | 187 |
| 68,87% | 19,53% | 49,34% | |
| Option 4 : they contact me via BBM | 280 | 101 | 179 |
| 73,88% | 26,65% | 47,23% | |
| Option 5 : they contact me via Instagram | 156 | 56 | 100 |
| 41,16% | 14,78% | 26,39% | |
| Option 6 : they contact me via Whatsapp | 239 | 75 | 164 |
| 63,06% | 19,79% | 43,27% | |
FACEBOOK, BBM AND OLX/TOKOBAGUS ARE THE MOST CHOSEN MARKETPLACE PLATFORMS
| Q7 (multiple answer) : do you have other vendor accounts on other marketplace platform? If Yes please select all that apply | Total | Gender | |
| Male | Female | ||
| Option 1 : None | 95 | 25 | 70 |
| 25,07% | 6,60% | 18,47% | |
| Option 2 : Tokopedia | 76 | 34 | 42 |
| 20,05% | 8,97% | 11,08% | |
| Option 3 : Facebook | 191 | 69 | 122 |
| 50,40% | 18,21% | 32,19% | |
| Option 4 : BBM | 171 | 64 | 107 |
| 45,12% | 16,89% | 28,23% | |
| Option 5 : OLX/Tokobagus | 119 | 59 | 60 |
| 31,40% | 15,57% | 15,83% | |
Our respondents also take advantage by selling on other marketplace platforms, such as Facebook, BBM and OLX. Most respondents have vendor accounts on Facebook (50.40%). Others marketplace chosen by respondents are BBM (45.12%), OLX/Tokobagus (31.40%) and Tokopedia (20.05%).
HOW VENDORS PROMOTE THEIR PRODUCTS
There are several methods used by vendors for promoting their products, started by giving hashtag on their pictures, endorsing, SFS (Shoutout for Shoutout), commenting on Famous accounts and paid promoter account. Giving hashtag is the most used method by respondents. Moreover, several respondents use several methods for promoting their products.
Quoted in this article, Shoutout for Shoutout is when Seller help other Seller promoting other Seller’s stuff in their account. It can be an exchange promotion or an exchange for money. There are communities of SFS in LINE Group, Whatsapp or BBM. Read more article on SFS here.
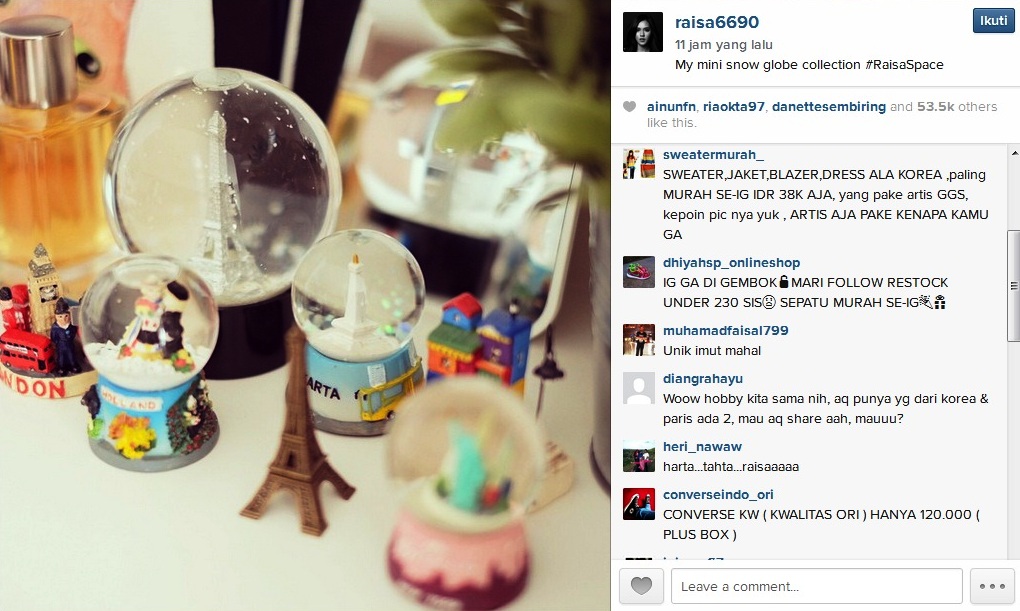
Picture below describing SFS :

Picture below is what is called Commenting on Famous Account :
For more detail you can download XLS report at the button below. JAKPAT report consists of 3 parts which are 1) Respondent Profile, 2) Crosstabulation for each question and 3) Raw Data. Respondent profile shows you demographic profiles ( gendr,age range, locationby province, and monthly spending). Cross tabulation enables you to define different demographic segment preference on each answer.
![]()
Click the icon to download XLS report
( Custom Crosstab can be downloaded in your dashboard only if you signup on JAKPAT)
And also PDF Report here:
If you’re interested to do survey on retail and consumer goods field toward our respondents, we have over 29,000 mobile respondents ranged from age 17-50 years old, smartphone active users, and located in all regions of Indonesia that has installed our app and readily answering your survey. Those 29,000 respondents has been verified, profiled, and continuously tracked to make sure you get the updated profiles of them. Our respondents has been profiled based on their demographic (age,gender,location, spending level, profession,religion), lifestyle habit (smoking/non, gamers/non, wearing glasses/non, frequent flyer/non, online shopper/non), and also brand consumption level ( brand A users, brand B users in FMCG, Retail, E-commerce,etc).
If you want to do research toward our respondent, please signup here and directly create your survey there. Or directly contact our Bizdev - Chrisprastika at +62-878-3908-9833. To non-Indonesian client, we offer free translation from foreign languages includes English, Chinese,Hindi,etc.