

Savings is one of the most essential thing in our life. Every people in the world must have a saving account whether they save it in bank or under the pillow. Saving is essential but growing up our money is even more important. Today, inflation rate is greater than the interest itself and sometimes we don’t know whether our money in the saving earns any interest income or not then we realize that our money in bank account didn’t grow at all.
Nowadays, the form of financial instrument has developed rapidly. Peoples in the financial industry develop variety of financial instruments that suits our risk profile. However, compare to other ASEAN countries, Indonesia score lowest in ASEAN financial literacy index according to the MasterCard Financial Index published in April 2015.
To reconfirm this study, recently JAKPAT conducted survey to understand how people allocate their savings to their preferred financial instrument. The survey was participated by 1,100 respondents within 18 – 55 years old with around $201 above monthly expenditure with similar percentage of male and female respondents. This survey concludes few key lessons about people’s behavior regarding their preferable financial instrument for their savings.
Here is the infographic of this survey:
Fact #1
| Q1 (multiple answer) : What financial instrument do you prefer for your saving each month? | Total | Gender | Age Range | ||||||||
| Male | Female | < 16 | 16-19 | 20-25 | 26-29 | 30-35 | 36-39 | 40-45 | > 45 | ||
| Option 1 : Savings / Tabungan | 823 | 374 | 449 | 0 | 42 | 348 | 185 | 175 | 43 | 22 | 8 |
| 74.82% | 72.62% | 76.75% | 0.00% | 76.36% | 75.98% | 74.30% | 75.43% | 68.25% | 68.75% | 72.73% | |
| Option 2 : Time Deposit / Deposito Berjangka | 282 | 124 | 158 | 0 | 7 | 115 | 76 | 58 | 18 | 6 | 2 |
| 25.64% | 24.08% | 27.01% | 0.00% | 12.73% | 25.11% | 30.52% | 25.00% | 28.57% | 18.75% | 18.18% | |
| Option 3 : Public Equity / Pasar Saham | 125 | 69 | 56 | 0 | 11 | 63 | 23 | 17 | 7 | 1 | 3 |
| 11.36% | 13.40% | 9.57% | 0.00% | 20.00% | 13.76% | 9.24% | 7.33% | 11.11% | 3.13% | 27.27% | |
| Option 4 : Mutual Fund / Reksadana | 129 | 64 | 65 | 0 | 3 | 44 | 33 | 32 | 7 | 5 | 5 |
| 11.73% | 12.43% | 11.11% | 0.00% | 5.45% | 9.61% | 13.25% | 13.79% | 11.11% | 15.63% | 45.45% | |
| Option 5 : Insurance / Unit Link | 294 | 147 | 147 | 0 | 14 | 99 | 79 | 65 | 22 | 11 | 4 |
| 26.73% | 28.54% | 25.13% | 0.00% | 25.45% | 21.62% | 31.73% | 28.02% | 34.92% | 34.38% | 36.36% | |
| Option 6 : Other | 48 | 18 | 30 | 0 | 1 | 14 | 15 | 14 | 2 | 2 | 0 |
| 4.36% | 3.50% | 5.13% | 0.00% | 1.82% | 3.06% | 6.02% | 6.03% | 3.17% | 6.25% | 0.00% | |
| Total | 1701 | 796 | 905 | 0 | 78 | 683 | 411 | 361 | 99 | 47 | 22 |
| 154.64% | 154.56% | 154.70% | 0.00% | 141.82% | 149.13% | 165.06% | 155.60% | 157.14% | 146.88% | 200.00% | |
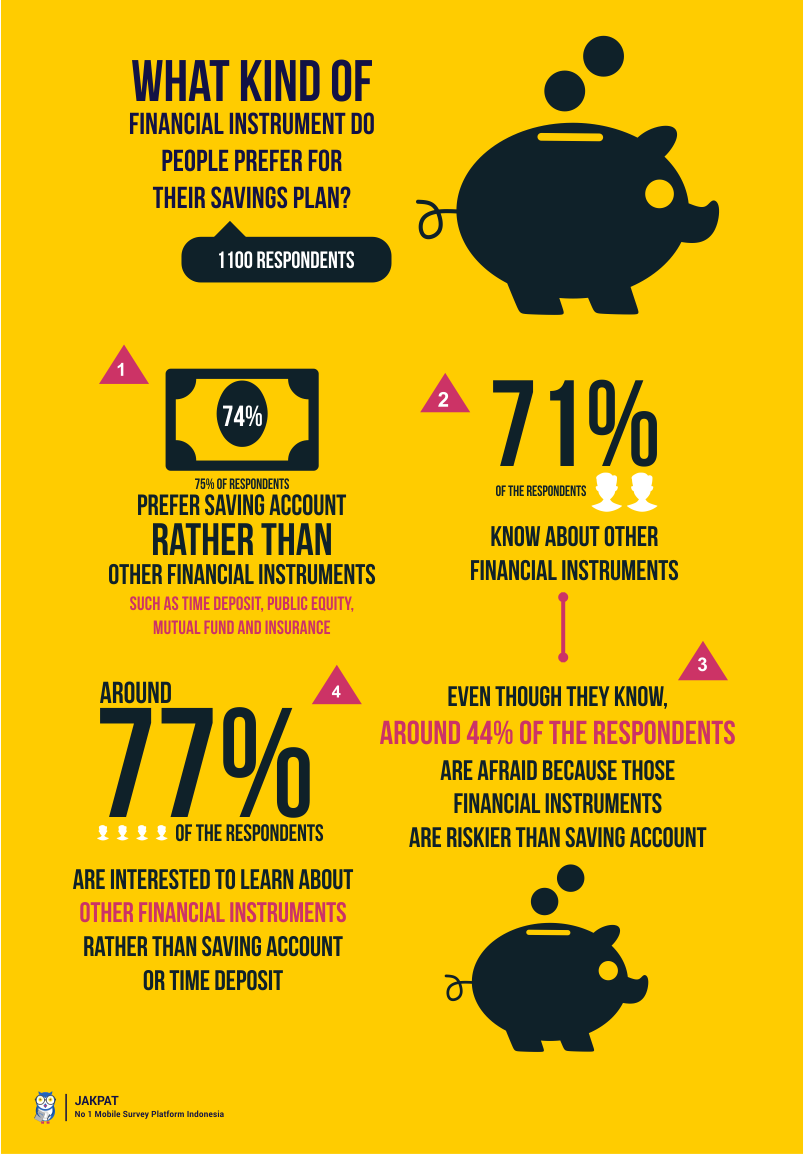
Savings (Tabungan) and Deposito Berjangka are popular among our respondents in every demographic. This is considered conventional while for others financial instrument Insurance or unit link is more popular compared to public equity (saham) and mutual fund. While for other investment, people is more familiar with gold investment as a safe haven compared to financial instruments stated above. However, if you see the age profile, the age group ranging 25 – 35 is willing to take more risk, while between 36 above they are looking more on the conventional method of investing.
Fact #2
| Q2 (single answer) : Do you understand the use of any other financial instrument rather thank savings and time deposits? | Total | Gender | Age Range | ||||||||
| Male | Female | < 16 | 16-19 | 20-25 | 26-29 | 30-35 | 36-39 | 40-45 | > 45 | ||
| Option 1 : Yes | 786 | 370 | 416 | 0 | 30 | 307 | 192 | 173 | 51 | 24 | 9 |
| 71.45% | 71.84% | 71.11% | 0.00% | 54.55% | 67.03% | 77.11% | 74.57% | 80.95% | 75.00% | 81.82% | |
| Option 2 : No | 314 | 145 | 169 | 0 | 25 | 151 | 57 | 59 | 12 | 8 | 2 |
| 28.55% | 28.16% | 28.89% | 0.00% | 45.45% | 32.97% | 22.89% | 25.43% | 19.05% | 25.00% | 18.18% | |
| Total | 1100 | 515 | 585 | 0 | 55 | 458 | 249 | 232 | 63 | 32 | 11 |
| 100.00% | 100.00% | 100.00% | 0.00% | 100.00% | 100.00% | 100.00% | 100.00% | 100.00% | 100.00% | 100.00% | |
More than half or around 71% of our respondents in every demographic are considered understand about the use of other financial instrument. The interesting thing from this question is female tends to have lower appetite to learn about financial instrument compared to male respondents
Fact #3
| Q4 (multiple answer) : What is your concern if you want to save your money in any other financial instrument such as public equity (saham), mutual fund (reksadana) beside savings (tabungan) / time deposits (deposito berjangka)? | Total | Gender | Age Range | ||||||||
| Male | Female | < 16 | 16-19 | 20-25 | 26-29 | 30-35 | 36-39 | 40-45 | > 45 | ||
| Option 1 : I don’t understand any of those investments | 221 | 95 | 126 | 0 | 16 | 110 | 38 | 42 | 8 | 7 | 0 |
| 20.09% | 18.45% | 21.54% | 0.00% | 29.09% | 24.02% | 15.26% | 18.10% | 12.70% | 21.88% | 0.00% | |
| Option 2 : I am afraid I will lose all of my money | 271 | 123 | 148 | 0 | 19 | 120 | 54 | 59 | 11 | 8 | 0 |
| 24.64% | 23.88% | 25.30% | 0.00% | 34.55% | 26.20% | 21.69% | 25.43% | 17.46% | 25.00% | 0.00% | |
| Option 3 : No one have ever given any information to me regarding those financial instrument | 206 | 117 | 89 | 0 | 8 | 92 | 50 | 42 | 10 | 2 | 2 |
| 18.73% | 22.72% | 15.21% | 0.00% | 14.55% | 20.09% | 20.08% | 18.10% | 15.87% | 6.25% | 18.18% | |
| Option 4 : Those financial instrument is riskier than savings and time deposit | 485 | 211 | 274 | 0 | 16 | 179 | 128 | 110 | 34 | 13 | 5 |
| 44.09% | 40.97% | 46.84% | 0.00% | 29.09% | 39.08% | 51.41% | 47.41% | 53.97% | 40.63% | 45.45% | |
| Option 5 : I don’t have any concern | 200 | 106 | 94 | 0 | 9 | 94 | 42 | 37 | 10 | 4 | 4 |
| 18.18% | 20.58% | 16.07% | 0.00% | 16.36% | 20.52% | 16.87% | 15.95% | 15.87% | 12.50% | 36.36% | |
| Total | 1383 | 652 | 731 | 0 | 68 | 595 | 312 | 290 | 73 | 34 | 11 |
| 125.73% | 126.60% | 124.96% | 0.00% | 123.64% | 129.91% | 125.30% | 125.00% | 115.87% | 106.25% | 100.00% | |
Confirming the previous statement, most of people concern that they will lose money if they are investing in other financial instrument. When people getting older, they are more prudent with their decision, not to put their savings into higher risk financial instrument such as public equity and reksadana. It can be seen from option 2 & 4 where older people are reluctant to invest their money. Another interesting facts is that female is more conservative in their savings plan. In the option 2 & 4, we have more female respondents answering the question compared to male.
Fact #4
| Q6 (single answer) : If there is a resources that can give you information and education about financial instrument, will you interested to invest in those financial instrument? | Total | Gender | Age Range | ||||||||
| Male | Female | < 16 | 16-19 | 20-25 | 26-29 | 30-35 | 36-39 | 40-45 | > 45 | ||
| Option 1 : yes | 850 | 426 | 424 | 0 | 39 | 371 | 199 | 171 | 41 | 21 | 8 |
| 77.27% | 82.72% | 72.48% | 0.00% | 70.91% | 81.00% | 79.92% | 73.71% | 65.08% | 65.63% | 72.73% | |
| Option 2 : no | 250 | 89 | 161 | 0 | 16 | 87 | 50 | 61 | 22 | 11 | 3 |
| 22.73% | 17.28% | 27.52% | 0.00% | 29.09% | 19.00% | 20.08% | 26.29% | 34.92% | 34.38% | 27.27% | |
| Total | 1100 | 515 | 585 | 0 | 55 | 458 | 249 | 232 | 63 | 32 | 11 |
| 100.00% | 100.00% | 100.00% | 0.00% | 100.00% | 100.00% | 100.00% | 100.00% | 100.00% | 100.00% | 100.00% | |
But when they are asked whether they want to learn about other financial instrument, most of them will say yes. Only around 22% will say not.
Fact #5
| Q5 (multiple answer) : What is the challenges for you if you want to learn others financial instrument such as public equity (saham) or mutual fund (reksadana)? | Total | Gender | Age Range | ||||||||
| Male | Female | < 16 | 16-19 | 20-25 | 26-29 | 30-35 | 36-39 | 40-45 | > 45 | ||
| Option 1 : I don’t have time | 292 | 132 | 160 | 0 | 13 | 122 | 67 | 63 | 14 | 12 | 1 |
| 26.55% | 25.63% | 27.35% | 0.00% | 23.64% | 26.64% | 26.91% | 27.16% | 22.22% | 37.50% | 9.09% | |
| Option 2 : I don’t understand Indonesian economy | 379 | 156 | 223 | 0 | 17 | 156 | 96 | 82 | 18 | 7 | 3 |
| 34.45% | 30.29% | 38.12% | 0.00% | 30.91% | 34.06% | 38.55% | 35.34% | 28.57% | 21.88% | 27.27% | |
| Option 3 : I don’t know where to learn | 503 | 251 | 252 | 0 | 22 | 232 | 117 | 94 | 25 | 11 | 2 |
| 45.73% | 48.74% | 43.08% | 0.00% | 40.00% | 50.66% | 46.99% | 40.52% | 39.68% | 34.38% | 18.18% | |
| Option 4 : I don’t bother | 160 | 80 | 80 | 0 | 13 | 68 | 29 | 28 | 11 | 6 | 5 |
| 14.55% | 15.53% | 13.68% | 0.00% | 23.64% | 14.85% | 11.65% | 12.07% | 17.46% | 18.75% | 45.45% | |
| Total | 1334 | 619 | 715 | 0 | 65 | 578 | 309 | 267 | 68 | 36 | 11 |
| 121.27% | 120.19% | 122.22% | 0.00% | 118.18% | 126.20% | 124.10% | 115.09% | 107.94% | 112.50% | 100.00% | |
Even though they want to learn, many obstacles will come into place. Around 46% of the respondents said that they couldn’t find where to learn about financial instrument followed by around 34% of respondents that said they didn’t understand about Indonesian economy. In this internet era, information is easily found compared to 5 – 10 years before. People only need several media to gather all the required information and they will learn.
Fact #6
| Q3 (single answer) : Do you want to understand and learn any other financial instrument such as public equity / mutual fund ? | Total | Gender | Age Range | ||||||||
| Male | Female | < 16 | 16-19 | 20-25 | 26-29 | 30-35 | 36-39 | 40-45 | > 45 | ||
| Option 1 : yes | 854 | 425 | 429 | 0 | 44 | 370 | 195 | 168 | 46 | 22 | 9 |
| 77.64% | 82.52% | 73.33% | 0.00% | 80.00% | 80.79% | 78.31% | 72.41% | 73.02% | 68.75% | 81.82% | |
| Option 2 : no | 246 | 90 | 156 | 0 | 11 | 88 | 54 | 64 | 17 | 10 | 2 |
| 22.36% | 17.48% | 26.67% | 0.00% | 20.00% | 19.21% | 21.69% | 27.59% | 26.98% | 31.25% | 18.18% | |
| Total | 1100 | 515 | 585 | 0 | 55 | 458 | 249 | 232 | 63 | 32 | 11 |
| 100.00% | 100.00% | 100.00% | 0.00% | 100.00% | 100.00% | 100.00% | 100.00% | 100.00% | 100.00% | 100.00% | |
As one of the preferable financial instrument, equity is considered to give more return than savings (tabungan) or time deposit (deposito berjangka). However investing in public equity will required your time to learn. Around 77% of our respondents are considering to learn public equity while only around 22% will say no. Their willingness to learn is shown in all demographic even in category 45 above.
It is also the same when to decide where to purchase. Those who often do lie within the percentage of 60.19%, which is considered pretty high compared to those who often don’t with huge gap of 38.64%, which is the habit of Indonesians in sticking to the same routine that is more convenient, since adapting to new products and stores can be time-consuming.
For more detail you can download XLS report at the button below. JAKPAT report consists of 3 parts which are 1) Respondent Profile, 2) Crosstabulation for each question and 3) Raw Data. Respondent profile shows you demographic profiles ( gendr,age range, locationby province, and monthly spending). Cross tabulation enables you to define different demographic segment preference on each answer.
![]()
Click the icon to download XLS report
And if you’d wish to send a survey to JAKPAT’s respondent, let’s request a Sales Quote here!
If you’re interested to do survey on retail and consumer goods field toward our respondents, we have over 31,000 mobile respondents ranged from age 17-50 years old, smartphone active users, and located in all regions of Indonesia that has installed our app and readily answering your survey. Those 31,000 respondents has been verified, profiled, and continuously tracked to make sure you get the updated profiles of them. Our respondents has been profiled based on their demographic (age,gender,location, spending level, profession,religion), lifestyle habit (smoking/non, gamers/non, wearing glasses/non, frequent flyer/non, online shopper/non), and also brand consumption level ( brand A users, brand B users in FMCG, Retail, E-commerce,etc).
If you want to do research toward our respondent, please signup here and directly create your survey there. Or directly contact our Bizdev - partner@jajakpendapat.net.
To non-Indonesian client, we offer free translation from foreign languages includes English, Chinese,Hindi,etc.