


Purchasing something in online or social media has become trend for many of us. High smart phone penetration and internet penetration in Indonesia has helped us conveniently buying anything without leaving our home or office. Food is one of the fastest categories which we can see a lot in Instagram, Facebook, or its direct website. JAKPAT conducted a survey to figure people’s behavior in buying food online. We had +1000 participants following this survey. After analyzing the survey result, there are few interesting facts that we can gather from the report. Fact #1 From +1,000 participants, only around 57% have tried to purchase food online. Around 63% from participants that have tried to purchase online were female. While for participants who say never tried to purchase food online dominantly were male. 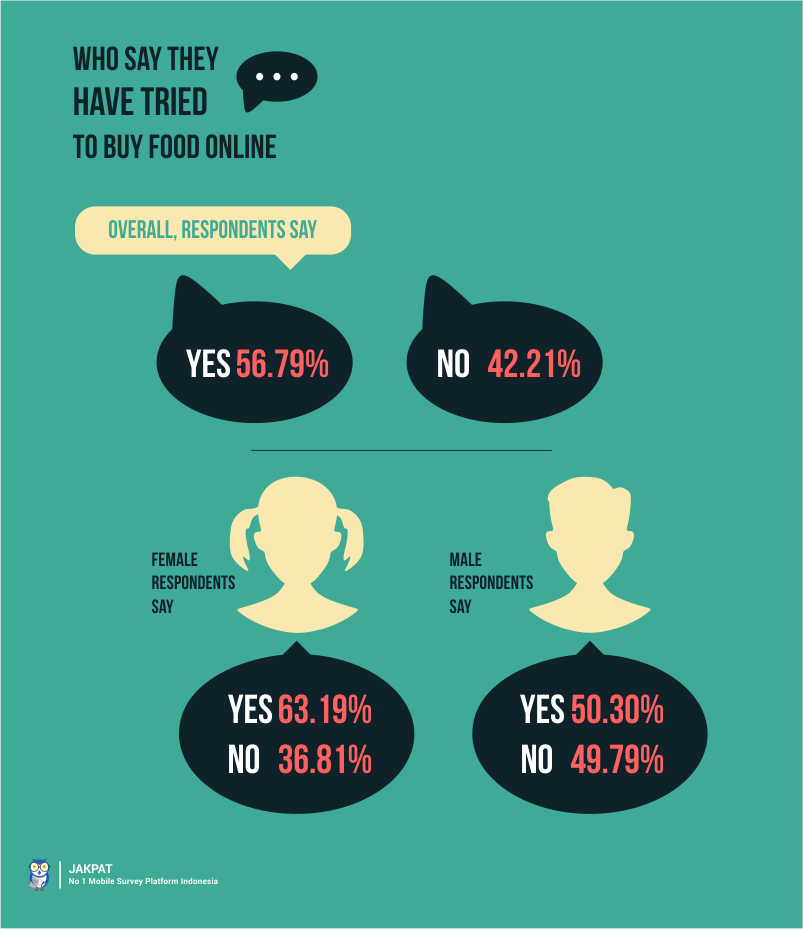 Fact #2 We also asked what their favorite food that they like to purchase online. From 5 options that we asked, the favorite food that they like to purchase are snack food such as keripik, chips, candies, etc followed by cake (birthday cake, dessert cake, traditional cake), cookies (kue kering), healty food, and beverages.
| Q2 (multiple answer) : What kind of food do you buy online? | Total | Gender | |
| Male | Female | ||
| Option 1 : Cookies | 138 | 51 | 87 |
| 24,08% | 20,24% | 27,10% | |
| Option 2 : Cake (Birthday Cake, Dessert Cake, Traditional Cake) | 180 | 77 | 103 |
| 31,41% | 30,56% | 32,09% | |
| Option 3 : Snack Food (Keripik, Permen, etc) | 308 | 110 | 198 |
| 53,75% | 43,65% | 61,68% | |
| Option 4 : Healthy Food (Oat Meal, Almond, Fruit Snack Food) | 102 | 50 | 52 |
| 17,80% | 19,84% | 16,20% | |
| Option 5 : Beverages (Cold Pressed Juice,Regular Juice, Air Kelapa, Jamu, Teh, Etc) | 73 | 39 | 34 |
| 12,74% | 15,48% | 10,59% | |
| Option 6 : Other | 119 | 58 | 61 |
| 20,77% | 23,02% | 19,00% | |
| Total | 920 | 385 | 535 |
| 160,56% | 152,78% | 166,67% | |
Fact #3 : Even though Instagram and Facebook were popular among the participants, around 41% still prefer to buy their food directly through the seller website. Instagram is still the popular social media where they can buy their food online followed by Facebook. Interestingly, marketplace such as Tokopedia or OLX which is a customer to customer market is also getting traction from the online food buyer. Around 35% also prefer their food through this website. However, new food commerce startup such as GoFood or Berry Kitchen is the least preferable media to purchase online.
| Q3 (multiple answer) : What is your preferable media to buy online food? | Total | Gender | |
| Male | Female | ||
| Option 1 : Instagram | 217 | 66 | 151 |
| 37,87% | 26,19% | 47,04% | |
| Option 2 : Direct Website | 233 | 111 | 122 |
| 40,66% | 44,05% | 38,01% | |
| Option 3 : Facebook | 139 | 62 | 77 |
| 24,26% | 24,60% | 23,99% | |
| Option 4 : Marketplace (tokopedia, olx, bukalapak) | 202 | 101 | 101 |
| 35,25% | 40,08% | 31,46% | |
| Option 5 : Food Service Website (Gojek through GoFood, Foodpanda, Berrykitchen, etc) | 122 | 56 | 66 |
| 21,29% | 22,22% | 20,56% | |
| Option 6 : Other | 28 | 15 | 13 |
| 4,89% | 5,95% | 4,05% | |
| Total | 941 | 411 | 530 |
| 164,22% | 163,10% | 165,11% | |
Fact #4 We also asked about what is their rationale if they want to purchase food online. What interesting here is they always think that the quality of the food is the main reason why they purchase the food online. As we know, many online food sellers package their food with fancy packaging, brand, photo, etc to attract buyers. However, sometimes many of those fancy packaged food couldn’t come up with the food quality. Pricing also is one of the consideration keys for people to buy food online. Only some of the participants buy the food online just because they want to buy it and unique. While there was around 8% of participants who want to buy food online because the photo looks good. We also can learn that word of mouth marketing was effective because there were around 12% of participants who want to buy food online because their friend asked them to buy it. 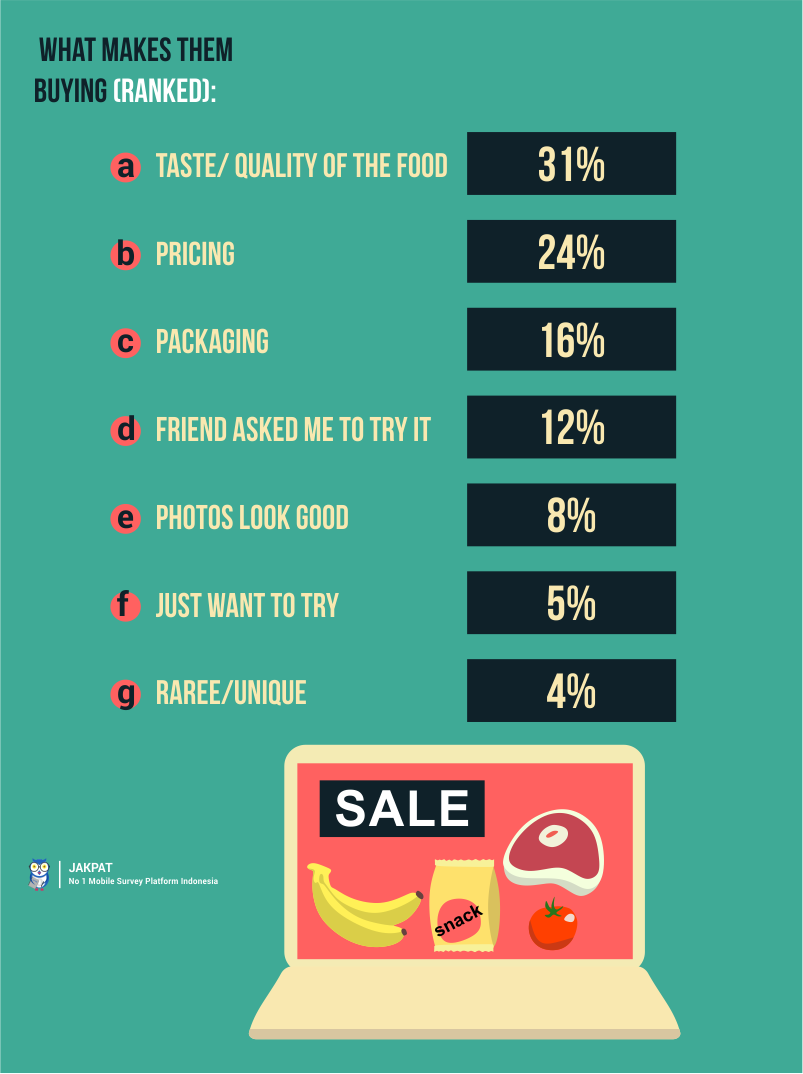 Fact #6 In terms of pricing, the sweet spot for purchasing food online is at the level of Rp80,000 – Rp100,000. Around 29% of the respondents think that this level was the adequate price level to purchase food online and evenly distributed by male and female. Moreover, around 26% also consider to purchase food online within Rp50,000 –Rp80,000.
| Q5 (single answer) : What’s the maximum price point do you think is reasonable for purchasing food online? | Total | Gender | |
| Male | Female | ||
| Option 1 : < Rp50,000 | 60 | 24 | 36 |
| 10.47% | 9.52% | 11.21% | |
| Option 2 : Rp50,000 – Rp80,000 | 148 | 58 | 90 |
| 25.83% | 23.02% | 28.04% | |
| Option 3 : Rp80,000 – Rp100,000 | 166 | 83 | 83 |
| 28.97% | 32.94% | 25.86% | |
| Option 4 : Rp100,000 – Rp120,000 | 84 | 35 | 49 |
| 14.66% | 13.89% | 15.26% | |
| Option 5 : > Rp120,000 | 115 | 52 | 63 |
| 20.07% | 20.63% | 19.63% | |
| Total | 573 | 252 | 321 |
| 100.00% | 100.00% | 100.00% | |
Fact #7 As we know, purchasing food online sometimes is considered relatively expensive compared to regular food that we buy. The reason why the price is more expensive was due to better packaging and their brand image. However, if the quality of the food can keep up with the brand image, around 63% of the respondent will come back to buy again. Considering those things, female also tend to buy again compared to male respondent.
| Q7 (single answer) : Do you consider to order the same food again if the taste is good but it has good packaging and relative expensive to you? | Total | Gender | |
| Male | Female | ||
| Option 1 : Yes | 361 | 155 | 206 |
| 63.00% | 61.51% | 64.17% | |
| Option 2 : No | 212 | 97 | 115 |
| 37.00% | 38.49% | 35.83% | |
| Total | 573 | 252 | 321 |
| 100.00% | 100.00% | 100.00% | |
Fact #8 Finally, we asked the participants regarding their concern about purchasing food online. Interestingly, most of them have problem with delivery or around 30% of the respondent. As we know, transportation & logistic are challenges that every e-commerce faces and will remain for the next few years. The second concern about ordering food online was the food didn’t taste as good as it looks. Sometimes many of us were fooled because the food picture was too good to be true. Thirdly, portion is too small also concerned many of us as we may didn’t get enough food. However, pricing and bad packaging didn’t seem concern many of the participants.
| Q8 (multiple answer) : What is your biggest complaint when you are ordering food online? | Total | Gender | |
| Male | Female | ||
| Option 1 : Pricing is too expensive | 171 | 72 | 99 |
| 29.84% | 28.57% | 30.84% | |
| Option 2 : Delivery is slow | 372 | 177 | 195 |
| 64.92% | 70.24% | 60.75% | |
| Option 3 : The food doesn’t taste good as it looks | 345 | 152 | 193 |
| 60.21% | 60.32% | 60.12% | |
| Option 4 : The portion is too small | 283 | 127 | 156 |
| 49.39% | 50.40% | 48.60% | |
| Option 5 : The packaging is not good | 141 | 55 | 86 |
| 24.61% | 21.83% | 26.79% | |
| Option 6 : Other | 21 | 8 | 13 |
| 3.66% | 3.17% | 4.05% | |
| Total | 1333 | 591 | 742 |
| 232.64% | 234.52% | 231.15% | |
For more detail you can download XLS report at the button below. JAKPAT report consists of 3 parts which are 1) Respondent Profile, 2) Crosstabulation for each question and 3) Raw Data. Respondent profile shows you demographic profiles ( gendr,age range, locationby province, and monthly spending). Cross tabulation enables you to define different demographic segment preference on each answer.
![]()
Click the icon to download XLS report
And if you’d wish to send a survey to JAKPAT’s respondent, let’s request a Sales Quote here! 
If you’re interested to do survey on retail and consumer goods field toward our respondents, we have over 31,000 mobile respondents ranged from age 17-50 years old, smartphone active users, and located in all regions of Indonesia that has installed our app and readily answering your survey. Those 31,000 respondents has been verified, profiled, and continuously tracked to make sure you get the updated profiles of them. Our respondents has been profiled based on their demographic (age,gender,location, spending level, profession,religion), lifestyle habit (smoking/non, gamers/non, wearing glasses/non, frequent flyer/non, online shopper/non), and also brand consumption level ( brand A users, brand B users in FMCG, Retail, E-commerce,etc).
If you want to do research toward our respondent, please signup here and directly create your survey there. Or directly contact our Bizdev - partner@jajakpendapat.net.
To non-Indonesian client, we offer free translation from foreign languages includes English, Chinese,Hindi,etc.