

One of the templates that can be used by JAKPAT clients are AD CAMPAIGN TRACKING. In this post JAKPAT would share a sample Ad Campaign Tracking of one of the popular campaign published by one of Unilever’s brand which is Buavita’s Fruitarian
What is Buavita’s Fruitarian Campaign? Be Fruitarian is a campaign that already held since years ago as an effort of Buavita brand to create a fruit lover community which popularize healthy life pattern. This community is supported by the brand in their activities both online in social media ( Facebook and Twitter) and also offline. This campaign also have supported by brand endorser Darius Sinathrya and Donna Agnesia.
JAKPAT tried to track the campaign result by surveying 3237 JAKPAT respondents that use JAKPAT app to receive surveys and get rewarded. To be noticed, those 3237 respondents are active smartphone users within Android and IOS platform (80:20). Those 3237 respondents located in all across Indonesia and 70% in Java.
First we asked respondent whether they aware of the words “Fruitarian” itself.
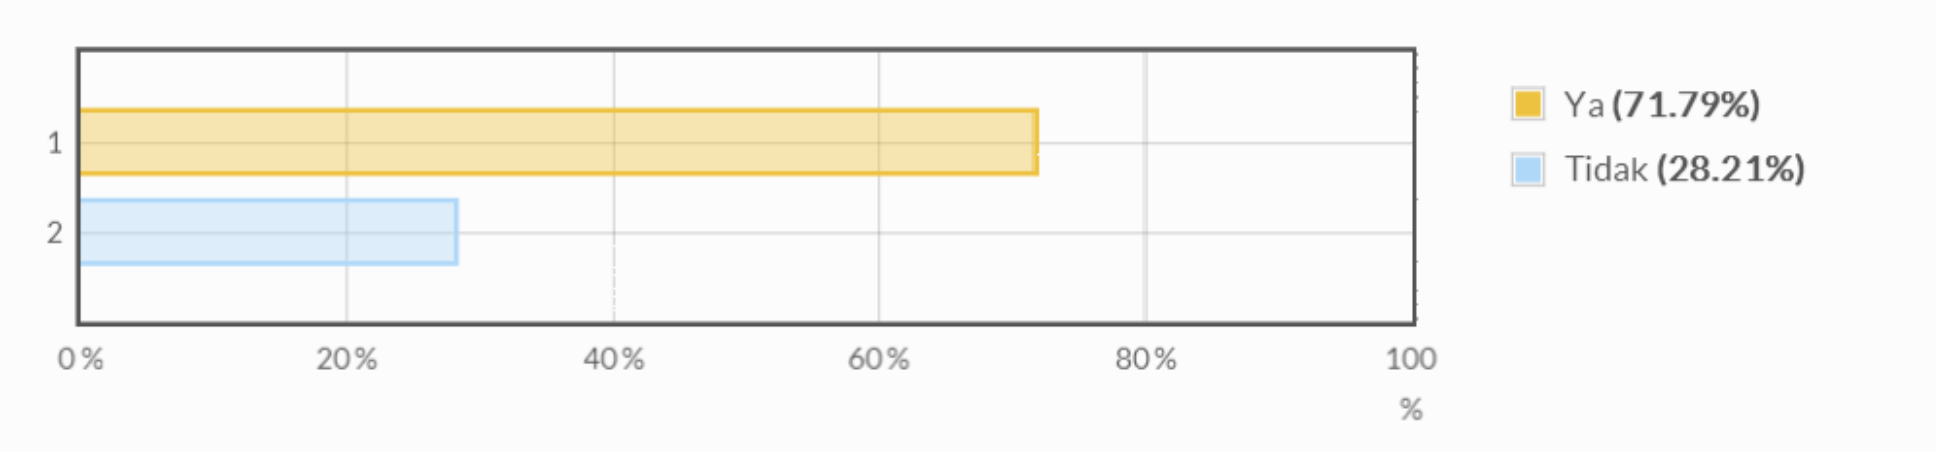
71.79% stated they are aware and 28.21 they do not know about the word. Fruitarian itself is not an Indonesian word therefore this result might indicate positive result of the campaign.
Then toward respondents that aware of the word, we asked within which media they are aware of the word Fruitarian.
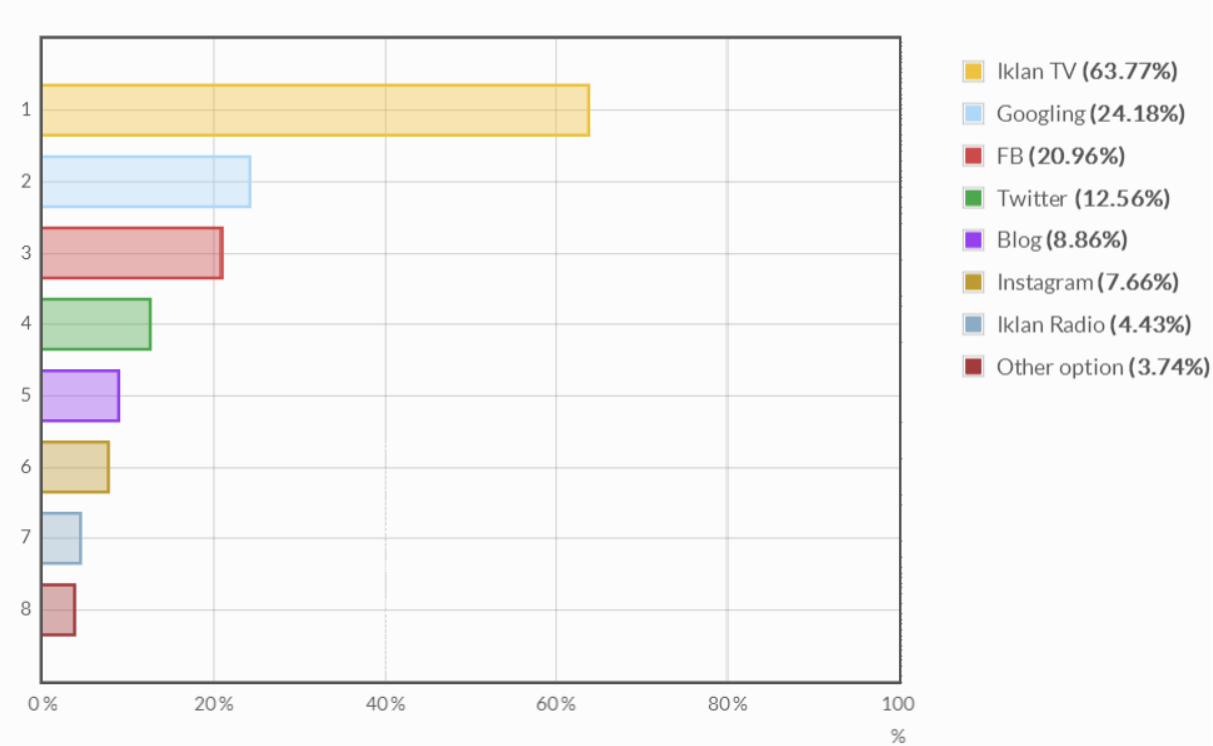
| 1 | TV Ads | 1482 | 63.77 % |
|---|---|---|---|
| 2 | Googling | 562 | 24.18 % |
| 3 | FB | 487 | 20.96 % |
| 4 | 292 | 12.56 % | |
| 5 | Blog | 206 | 8.86 % |
| 6 | 178 | 7.66 % | |
| 7 | Radio Ads | 103 | 4.43 % |
| 8 | Other | 87 | 3.74 % |
Most respondents stated they knew about Fruitarian from TV Ads (>60%). Despite the fact that TV Ads still hold a high percentage , online medias also hold significant percentage of awareness.
We also asked what are consumer’s assosiations related to term of “Fruitarian” through open text answer. JAKPAT system automatically analyze open text answers within its content analyze. Below are summarized Top 20 answers :
| 1 | Pemakan buah | 88 | 3.79 % |
|---|---|---|---|
| 2 | Minuman | 47 | 2.02 % |
| 3 | Buah | 44 | 1.89 % |
| 4 | Pemakan buah buahan | 42 | 1.81 % |
| 5 | Pemakan buah-buahan | 37 | 1.59 % |
| 6 | Penyuka buah | 35 | 1.51 % |
| 7 | Buah buahan | 31 | 1.33 % |
| 8 | Penggemar buah | 30 | 1.29 % |
| 9 | Pecinta buah | 26 | 1.12 % |
| 10 | Pemakan buah2an | 26 | 1.12 % |
| 11 | Orang yang suka makan buah | 20 | 0.86 % |
| 12 | Buah-buahan | 20 | 0.86 % |
| 13 | Pengkonsumsi buah | 16 | 0.69 % |
| 14 | Penyuka buah buahan | 16 | 0.69 % |
| 15 | Minuman rasa buah | 15 | 0.65 % |
| 16 | Diet buah | 14 | 0.6 % |
| 17 | minuman buah | 12 | 0.52 % |
| 18 | Penggemar buah-buahan | 11 | 0.47 % |
| 19 | Pecinta buah buahan | 11 | 0.47 % |
| 20 | Tidak tahu | 10 | 0.43 % |
Most answers are close to fruit-eaters or fruit-lovers. It means that though it’s not a common term, consumer tends to understand the terms brought by the brand. This might shows positive result on the campaign. Audience got the very close to desired assosiation deliver by the brand.
When we asked respondent to recognize what brand that deliver the campaign. JAKPAT also use open text question type to dig deeper here. Around 40% stated they remember this campaign is brought by Buavita.
| 1 | Buavita | 870 | 37.44 % |
|---|---|---|---|
| 2 | Minuman | 184 | 7.92 % |
| 3 | Tidak tahu | 151 | 6.5 % |
| 4 | Lupa | 71 | 3.06 % |
| 5 | Buahvita | 67 | 2.88 % |
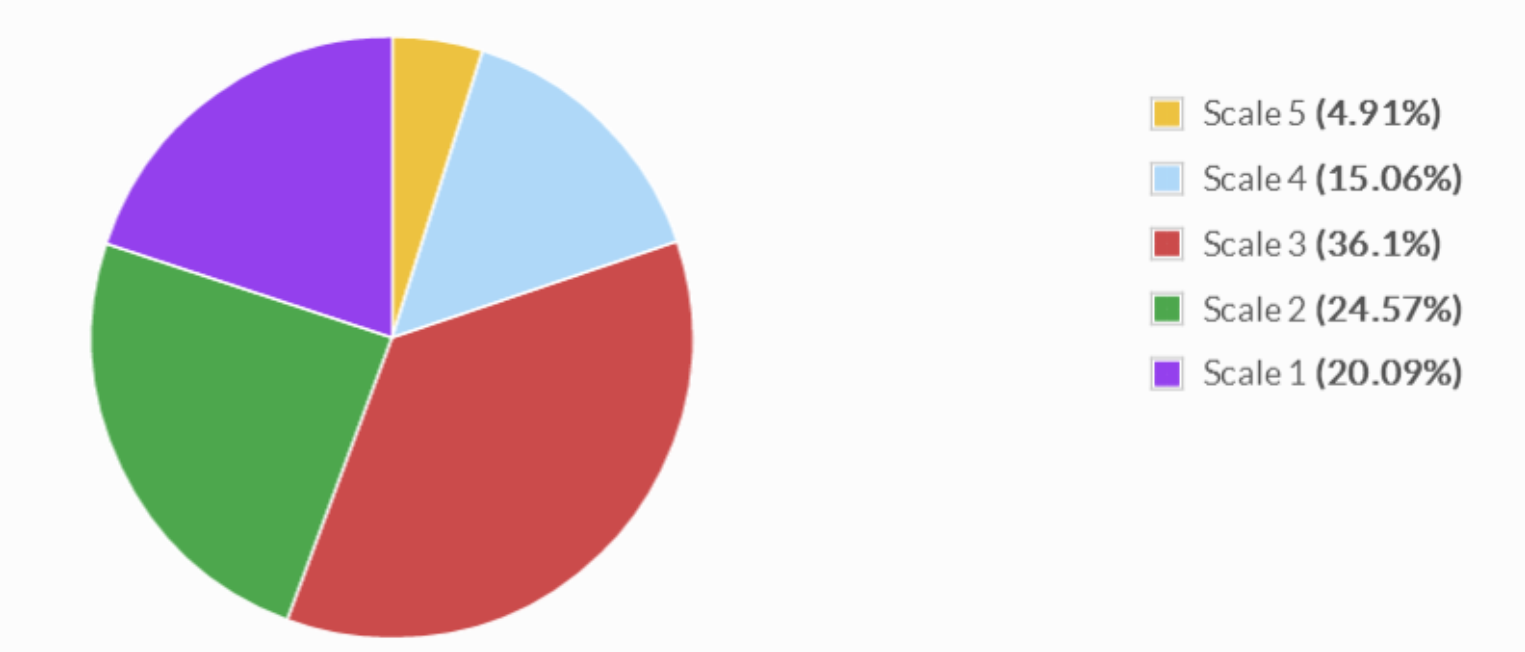
Lastly we asked how effective the campaign affect consumer’s purchase intention of the Buavita brand? We might not be able to directly conclude that from this last survey question that the campaign do not bring high impact on purchase intention of Buavita’s product.
For more detail you can download XLS report at the button below. AKPAT report consists of 3 parts which are 1) Respondent Profile, 2) Crosstabulation for each question and 3) Raw Data. Respondent profile shows you demographic profiles ( gendr,age range, locationby province, and monthly spending). Cross tabulation enables you to define different demographic segment preference on each answer.
![]()
Click the icon to download XLS report
If you’re interested to do survey on retail and consumer goods field toward our respondents, we have over 23,000 mobile respondents ranged from age 17-50 years old, smartphone active users, and located in all regions of Indonesia that has installed our app and readily answering your survey.
Those 23,000 respondents has been verified, profiled, and continuously tracked to make sure you get the updated profiles of them. Our respondents has been profiled based on their demographic (age,gender,location, spending level, profession,religion), lifestyle habit (smoking/non, gamers/non, wearing glasses/non, frequent flyer/non, online shopper/non), and also brand consumption level ( brand A users, brand B users in FMCG, Retail, E-commerce,etc).
If you want to do research toward our respondent, please signup here and directly create your survey there. Or directly contact our Bizdev - Chrisprastika at +62-878-3908-9833. To non-Indonesian client, we offer free translation from foreign languages includes English, Chinese,Hindi,etc.