


Download the Infographic Report PDF here

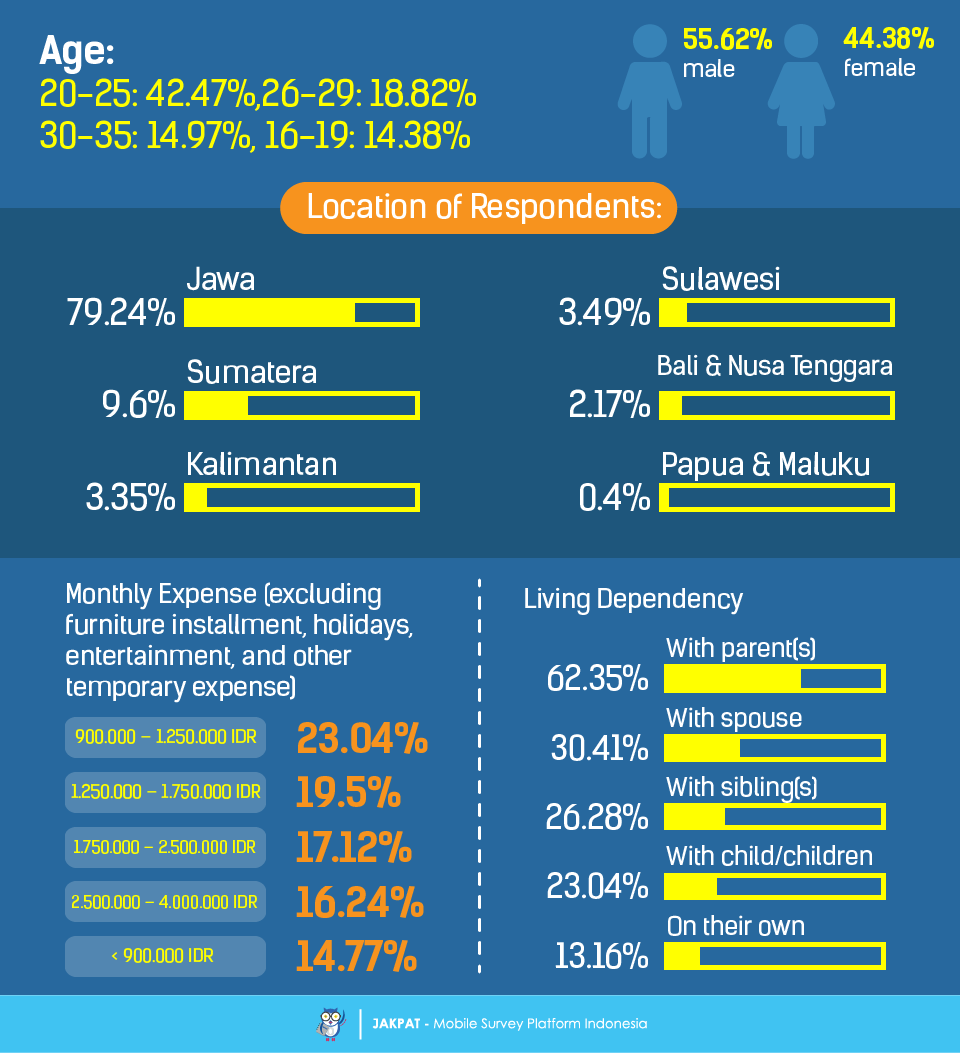
This survey is continually meant to map our respondents’ habit and possibly preference on certain products of crisps or chips that are normally found in stores. Naturally this survey is continual, meaning that the results may change or be different though using the same questions. In this first cycle of survey we managed to ask 4234 respondents and in which we did not limit any gender, any age or any location.
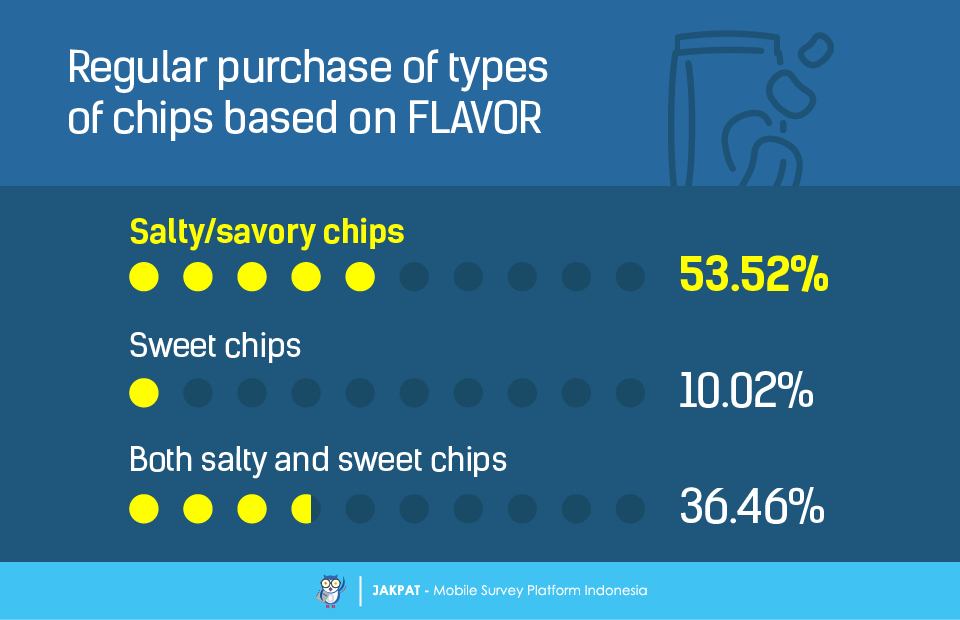
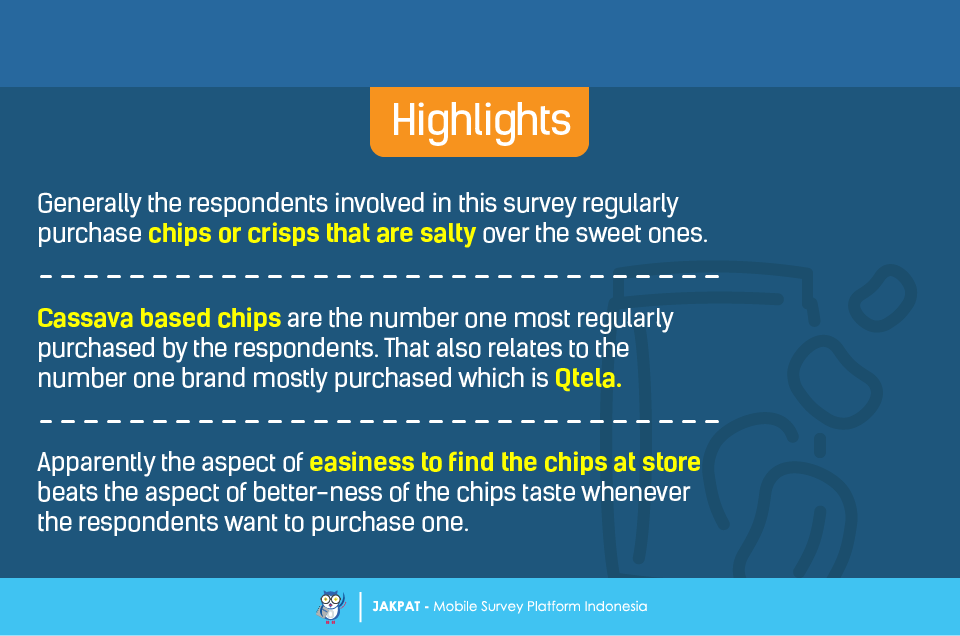
The first relevant question asked to the respondents was about which flavor of chips that they regularly purchase, based on the saltiness and sweetness. Apparently, the majority of the involved respondents (53.52%) regularly purchase salty/savory chips as opposed to the sweet ones (10.02%). However, there are 36.46% of respondents who admitted to regularly purchase both salty and sweet chips at the same time.
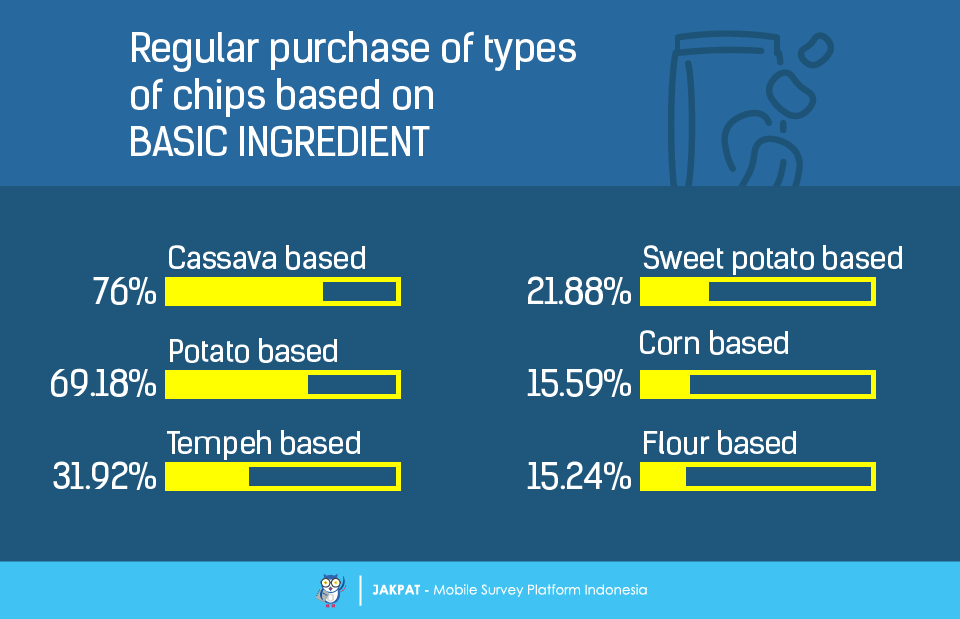
Now we are moving on from flavor to basic ingredient. Chips are made of a variety of ingredients. Mainly they are made of one specific natural ingredient then get seasoned in a manufacturing process. We listed several basic ingredients that would commonly make chips. 76% of the involved respondents regularly purchase chips that are made of cassava. 69.18% of respondents admitted to regularly purchase potato based chips. 31.92% purchase tempeh based chips. 21.88% purchase sweet potato based chips. 15.59% purchase corn based chips. Lastly, 15.24% of the respondents purchase flour based chips. The above gained information may indicate that the involved respondents culturally love cassava over potato, or the current chip trend in the trend may just be siding to cassava.
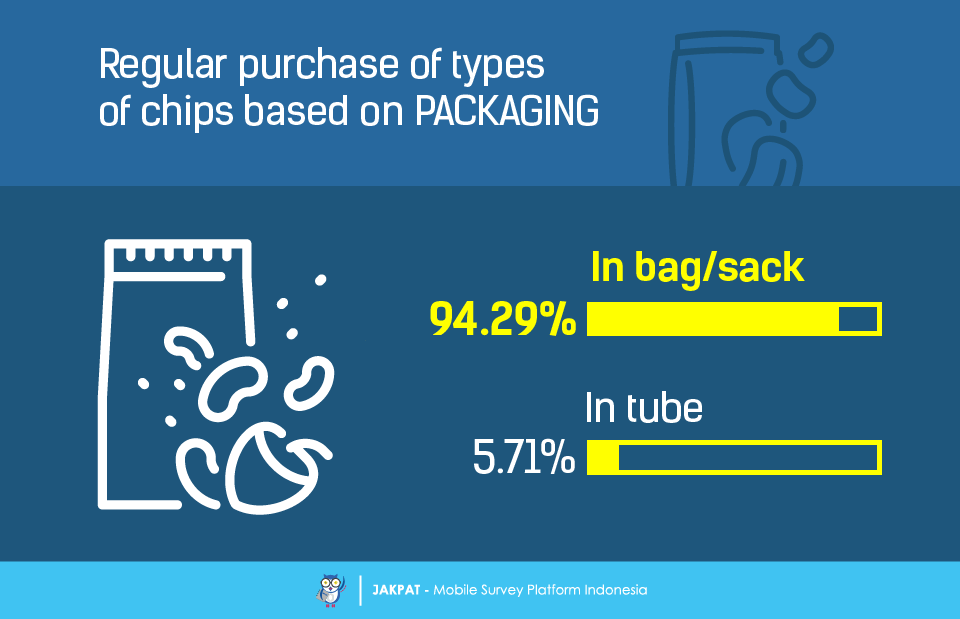
From the basic ingredient, now we are moving on to the packaging. This was quite an easy question. We wanted to know how the involved respondents get affected by how the chips are packaged in relation to their purchasing decision. As easily pre-assumed, 94.29% of the involved respondents regularly purchase chips that come in bag or sack over in tube (5.71%).
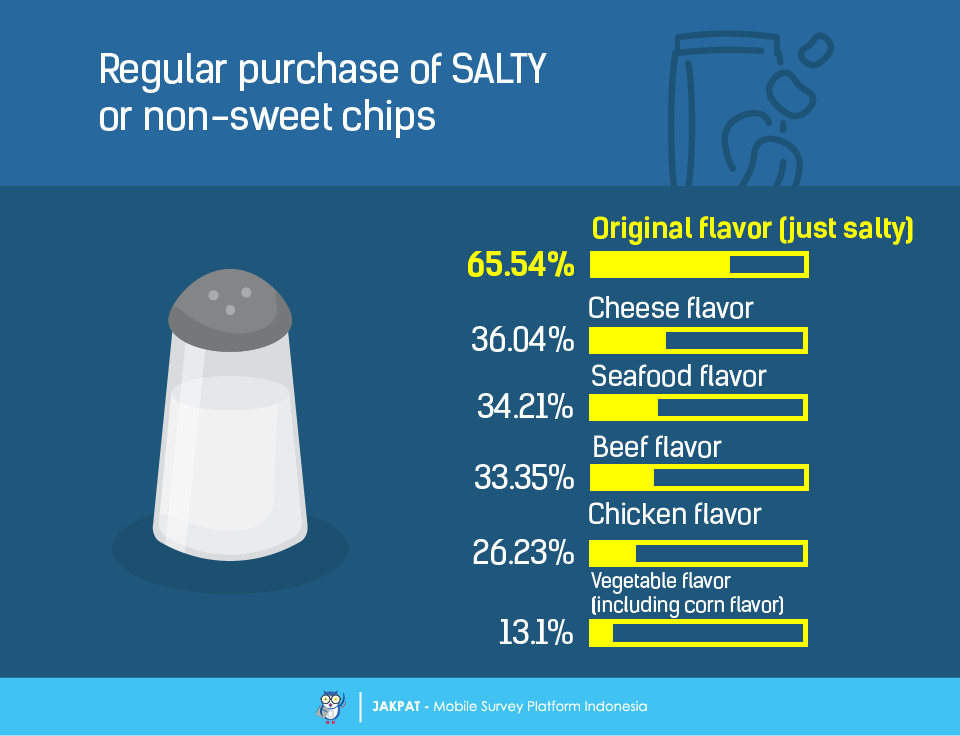
Earlier we talked about how the respondents regularly purchase the chips based on the flavor. Now we are getting slightly deeper into even more specific flavor in the category of salty or savory chips. Admittedly, 65.54% of the respondents regularly purchase chips with the original flavor or just simply of salt. 36.04% of the respondents regularly purchase cheese flavored chips. 34.21% purchase seafood flavored chips. 33.35% purchase beef flavored chips. 26.23% purchase chicken flavored chips. Lastly, 13.1% of the respondents regularly purchase vegetable flavored chips. The percentage gap of the first preference of flavor to the second one is quite significant. That may just show how we generally just love the original flavor that tastes salty on the tongue.
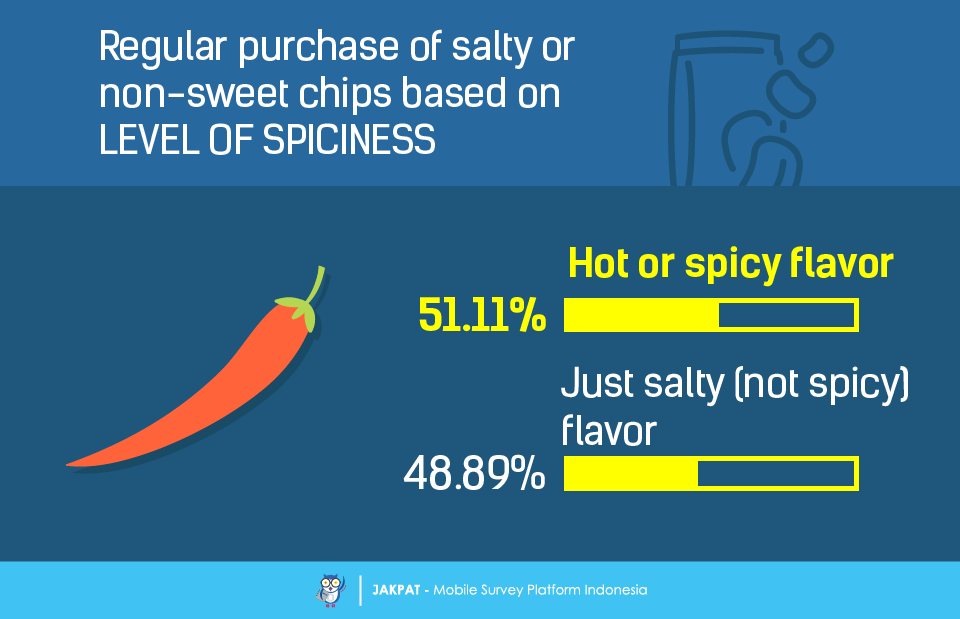
Culturally we are familiar with foods that are spicy. How would that affect the respondents’ decision of purchasing the chips? Apparently, 51.11% of the respondents regularly purchase hot or spicy chips. The other 48.89% regularly purchase non spicy flavored chips.
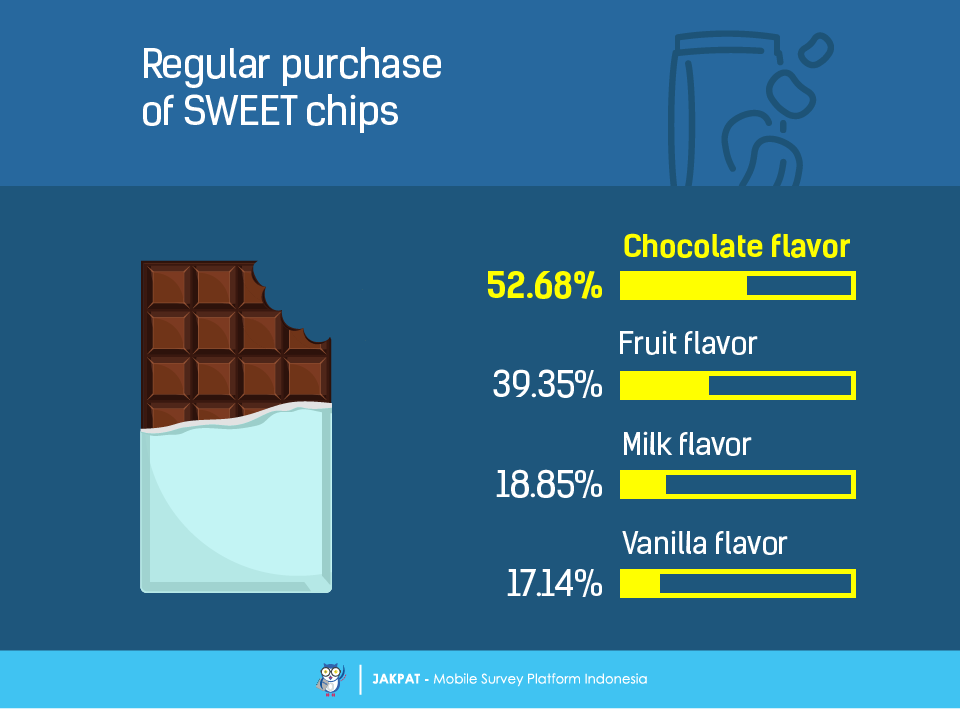
As for the sweet category, 52.68% of the involved respondents admitted to regularly purchase chips in chocolate flavor. 39.35% regularly purchase fruit flavored chips. 18.85% go for milk flavor, and lastly 17.14% regularly purchase vanilla flavored chips.
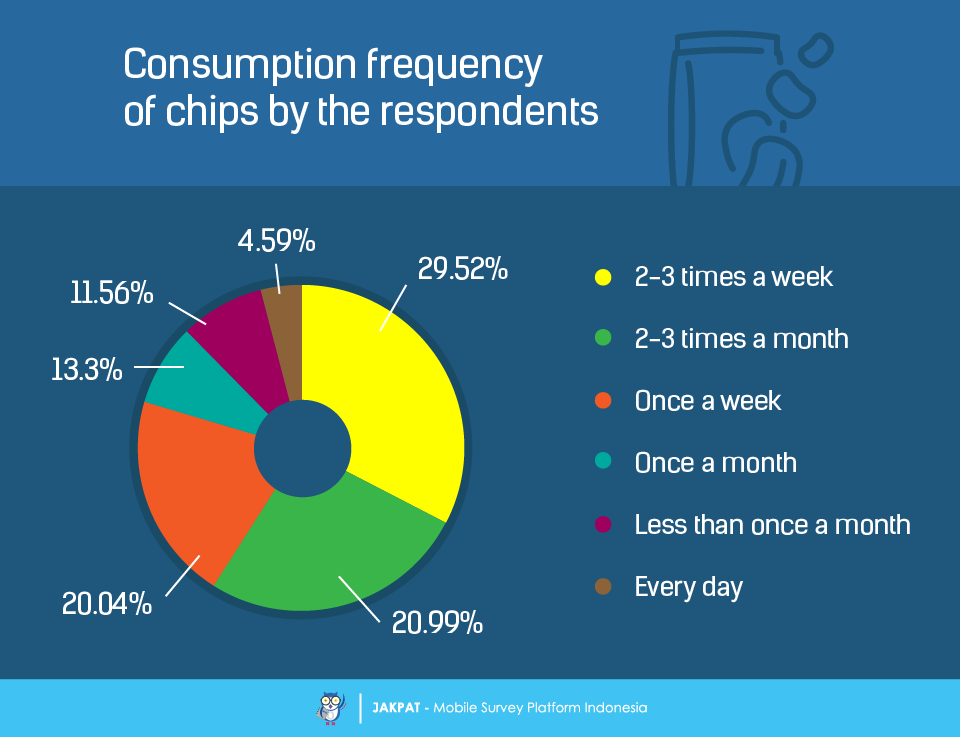
How frequent do the respondents consume chips? The highest frequency of the consumption is 2-3 times a week as voted by 29.52% of the respondents. The next highest frequency is 2-3 times in a month as voted by 20.99%. 20.04% admitted to consume chips every week. 13.3% do it once a month. 11.56% do it less than once a month. Lastly, 4.59% of the respondents admitted to consume the chips every single day.
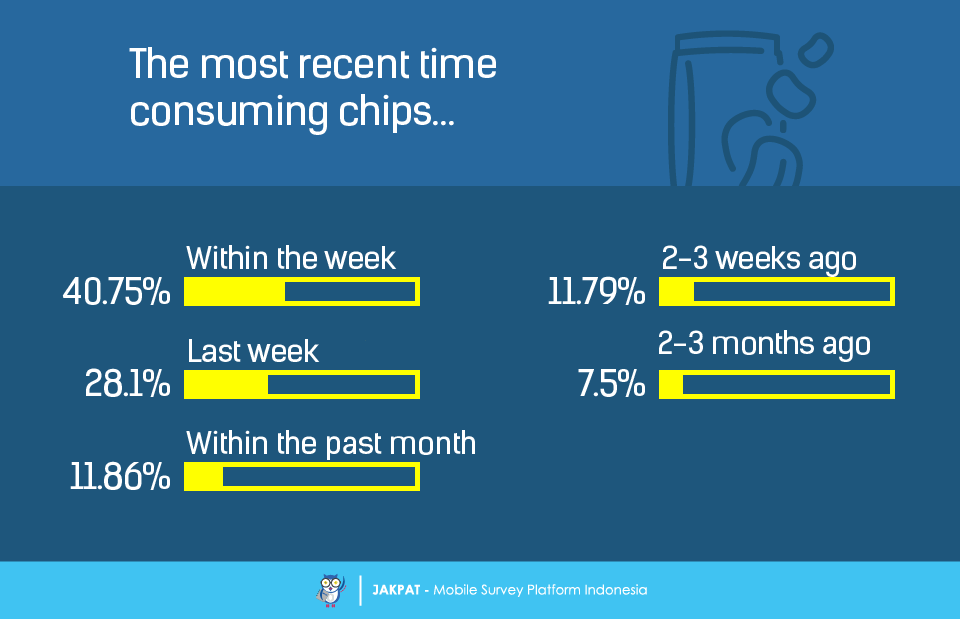
When was the last time the respondents consume chips? 40.75% said to have consumed chips within the week when the survey was being answered by them. 28.1% did it the week before. 11.86% did it within the same month that the survey was being answered. 11.79% did it 2-3 weeks before. Lastly, 7.5% of the respondents consumed their chips 2-3 months before.
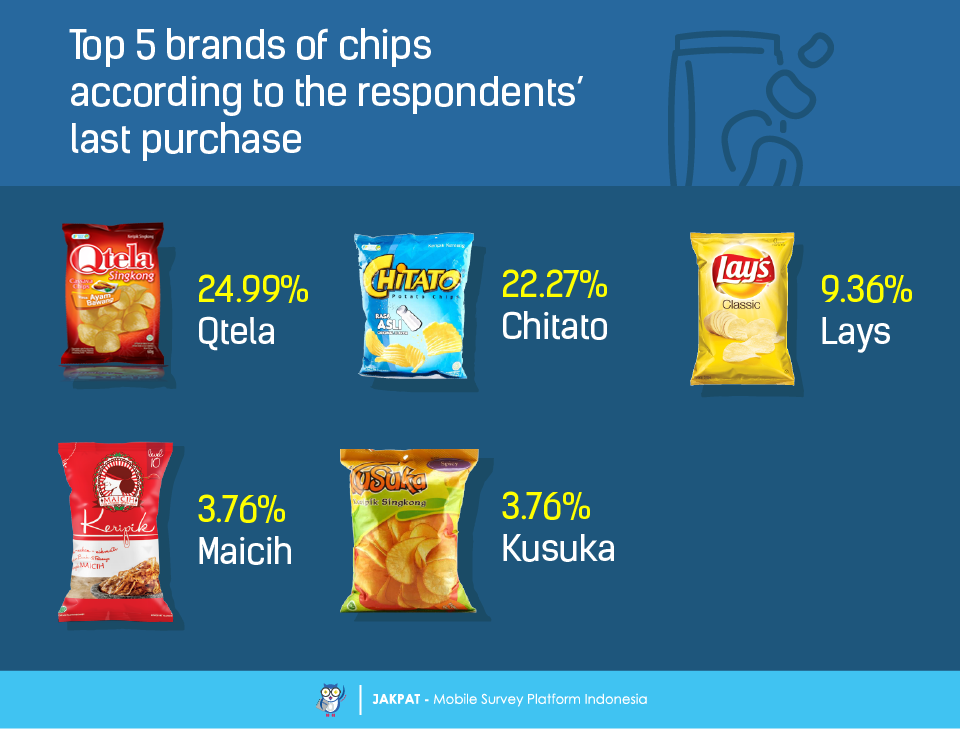
Now we are moving on to the top brands of chips according to the involved respondents. We found 5 top brands of choice based on the respondents’ last or most recent purchase. Number one is Qtela (voted by 24.99% of respondents). The next one is Chitato (voted by 22.27%). At number three there is Lays (voted by 9.36%). Lastly, at number four and five we have Maicih and Kusuka (both with the same number of votes of 3.76%).
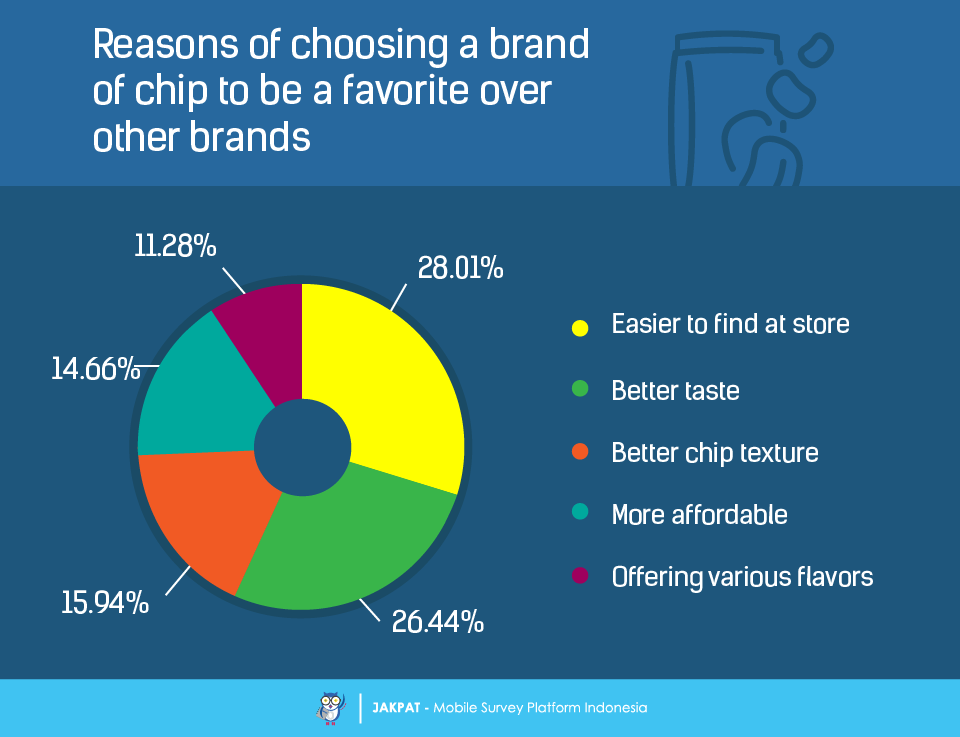
Now that we have the top brands of choice based on the most recent purchase, we asked the same respondents the reason why the brand. 28.01% admitted that the easiness to find the brands at store make them grab it. 26.44% admitted that the better-ness in the taste over other head-to-head brands plays an important role too. Not only the better-ness in the taste but also in the chip texture; 15.94% of the respondents admitted that the texture is also an important role. Then comes the price; 14.66% of the respondents admitted that the more affordable the more attractive the chips get. Lastly, 11.28% admitted that brands that offer a variety of flavors seem to be attractive.
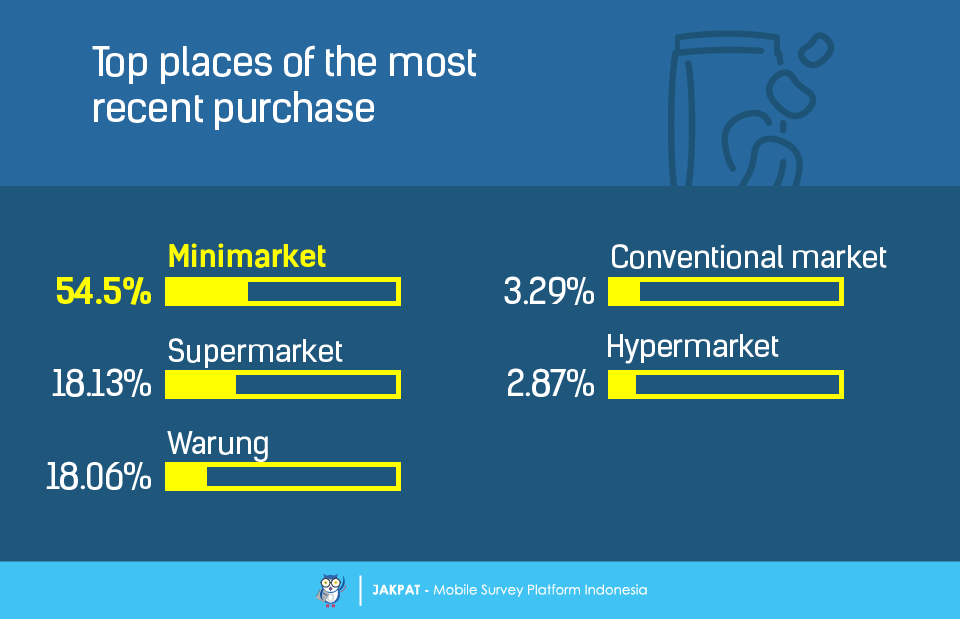
Where do the respondents purchase the chips? Most of the involved respondents (54.5%) said minimarket. Supermarket comes at number two as voted by 18.13% of the respondents. Warung comes at number three as voted by 18.06%. The conventional market comes at number four as voted by 3.29%. Lastly, only 2.87% of the respondents admitted to purchase the chips at a hypermarket.
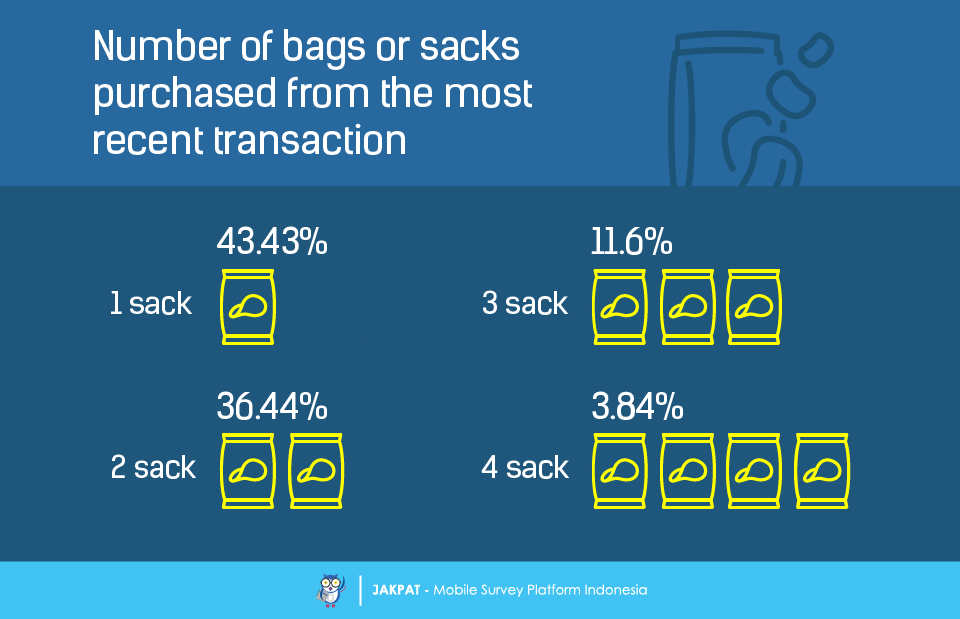
We then asked the respondents how many bags or units of chips they purchased from the last or most recent purchase. The majority (43.43%) admittedly purchased one bag or unit of chip. 35.44% purchased two units. 11.6% purchased three units. Lastly, 3.84% purchased four units of chip. Their reason of only purchasing one unit at a time may have something to do with them not being interested in stocking chips at their place.
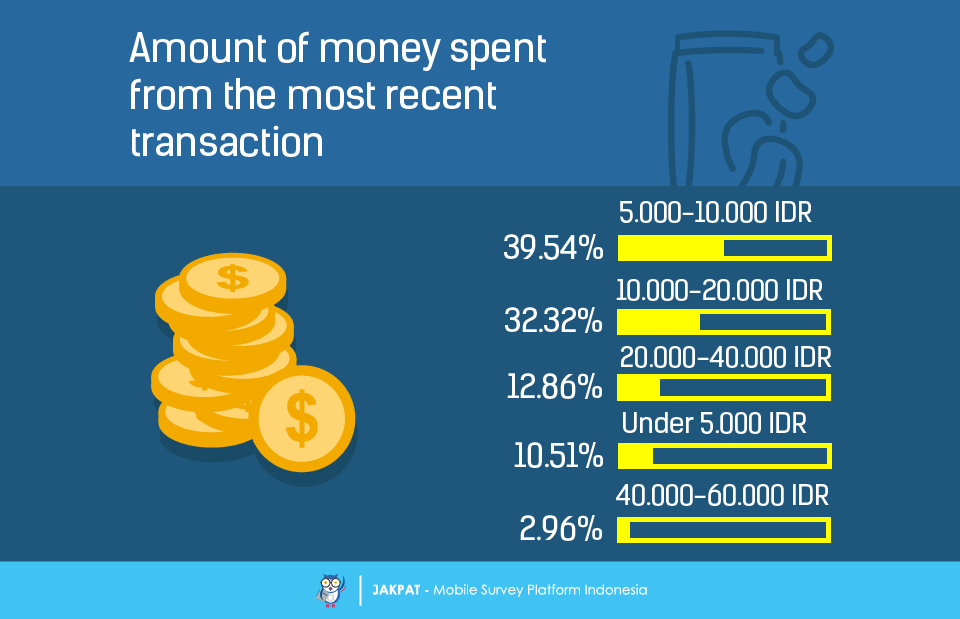
The last point to ask was about the general amount of money spent on the chips from the last or most recent purchase. 39.54% of the respondents admitted that they spent between 5000-10.000 IDR. 32.32% of the respondents spent 10.000-20.000 IDR. 12.86% spent 20.000-40.000 IDR. 10.51% spent under 5000 IDR. And, 2.96% of the respondents spent 40.000-60.000 IDR. The spent money difference might be related to the number of units of chip purchased too.
For more detail you can download XLS report at the button below (bahasa). JAKPAT report consists of 3 parts which are 1) Respondent Profile, 2) Crosstabulation for each question and 3) Raw Data. Respondent profile shows you demographic profiles ( gender,age range, location by province, and monthly spending). Cross tabulation enables you to define different demographic segment preference on each answer.
![]()
You can also download PDF here:
![]()

or Get A Sales Quote by filling this form or Call to +622745015293
