

For anyone who believes in the importance of impression management, their appearance must be considered as an important matter foremost. They believe the way they appear to others play a pivotal role in creating people’s impression of themselves. However, being nice in appearance at some point is in line with being careful with our clothes. The fashion style we choose is basically the representation of who we are. Fashion is considered as a statement about who we are, how we would like to be seen by others, as well as our characteristic. Above it all, whichever fashion style we choose, our sensitivity toward cleanliness of our clothes becomes important. We conduct a survey to map the consumption pattern of cloth cleaning product among our respondent.
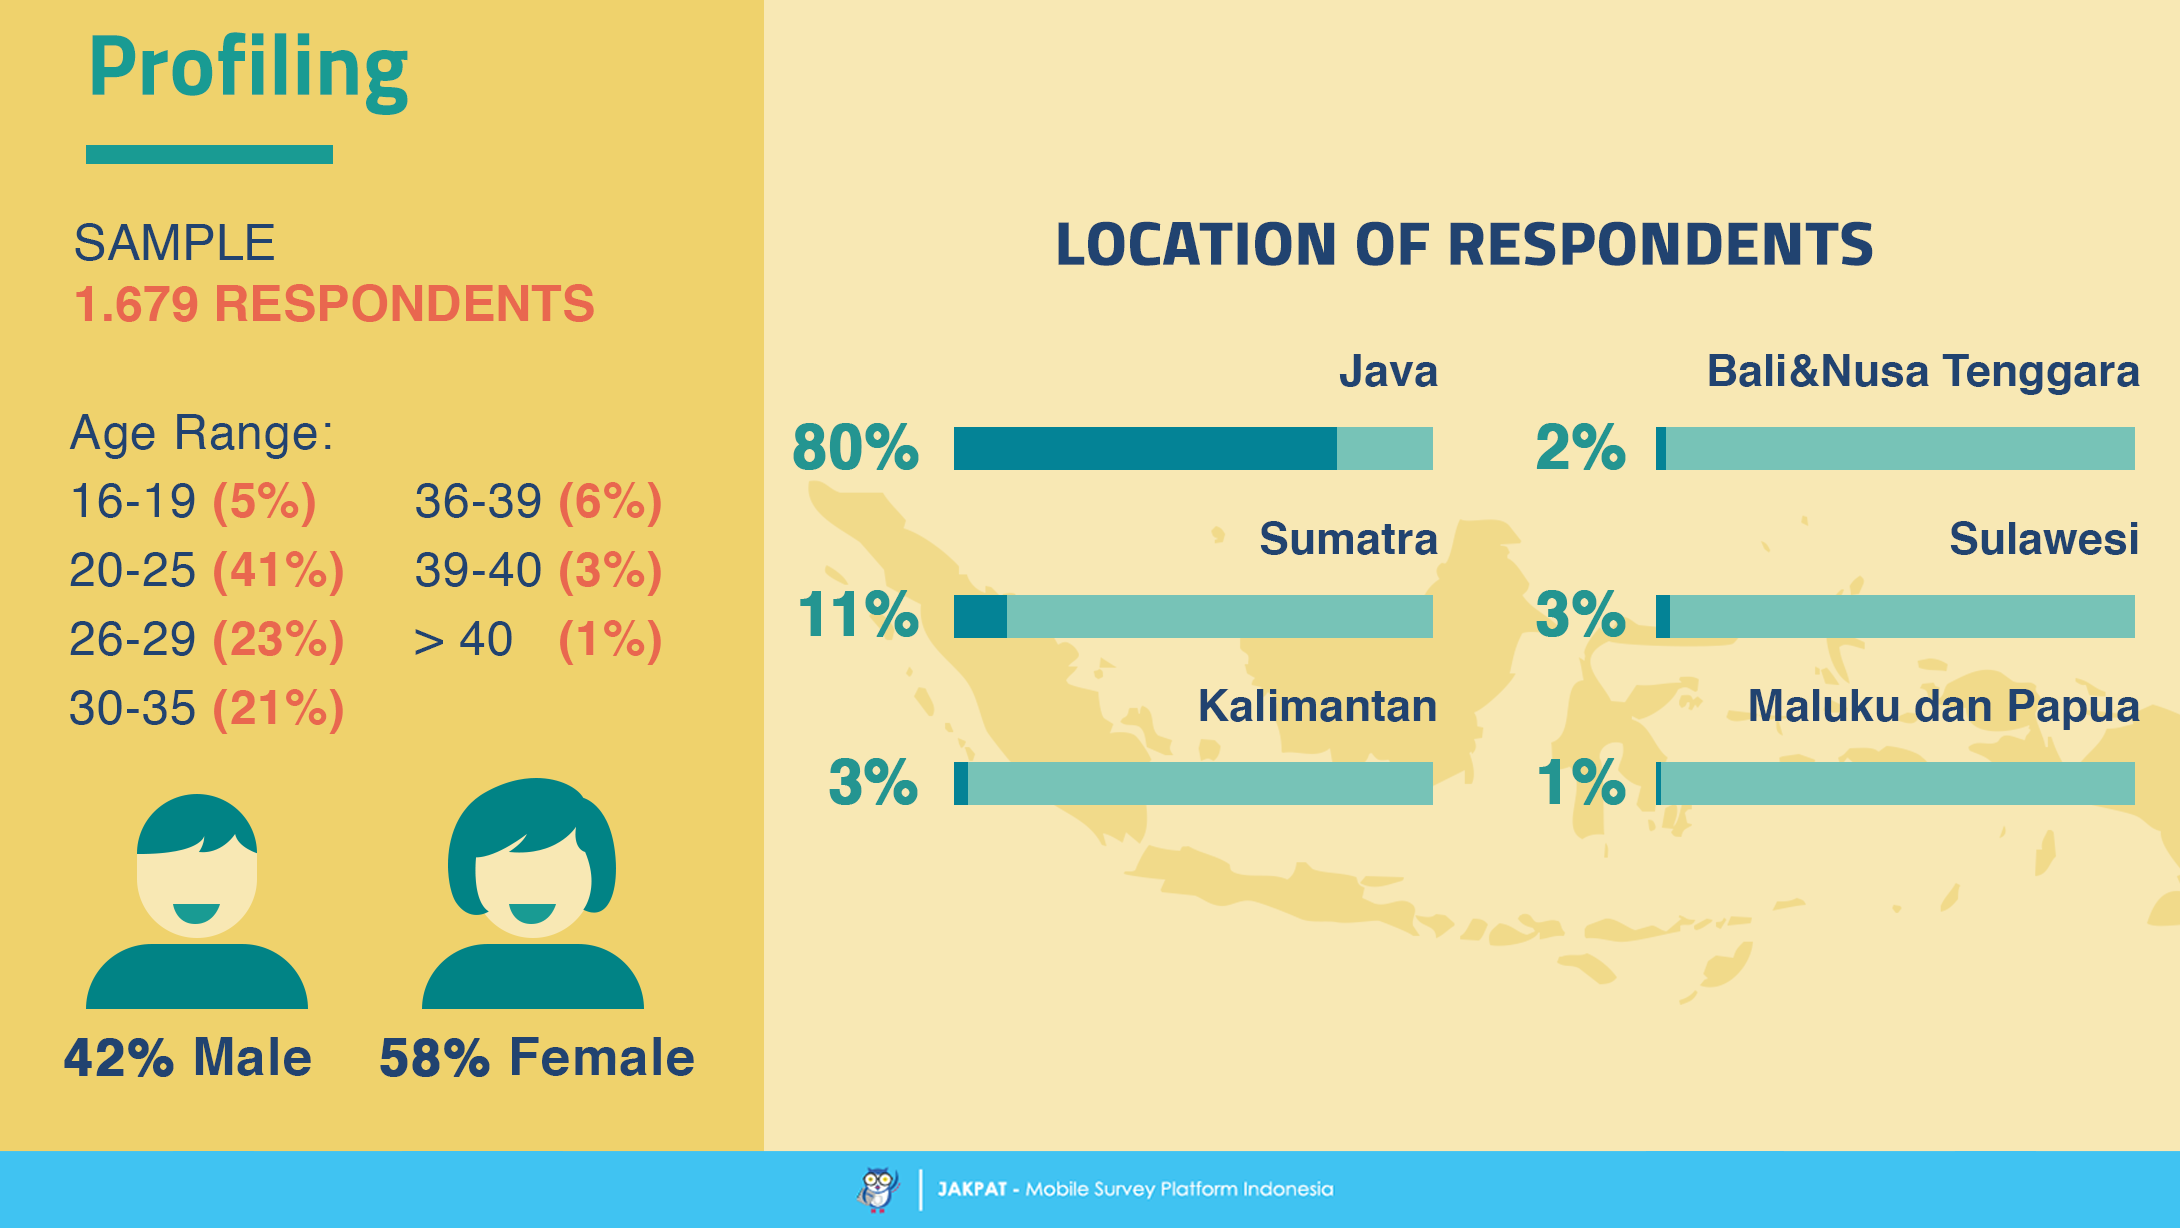
In order to complete this survey, we send a questionnaire to our 1.679 respondents in nationwide. Both male and female respondents were completing the survey. Most respondents in this survey are those who live in their early and mid-twenties.
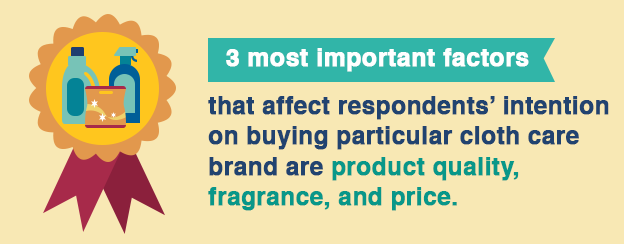
Notable highlight of this survey is consisted of three aspects. First, detergent and softener as the most regularly used and purchased product compared to other cloth care products. Second, the great influence of others, especially among male respondents regarding their role as the decision maker. At last, our highlight is mostly focused on respondents’ consideration to buy certain cloth cleaning brand.
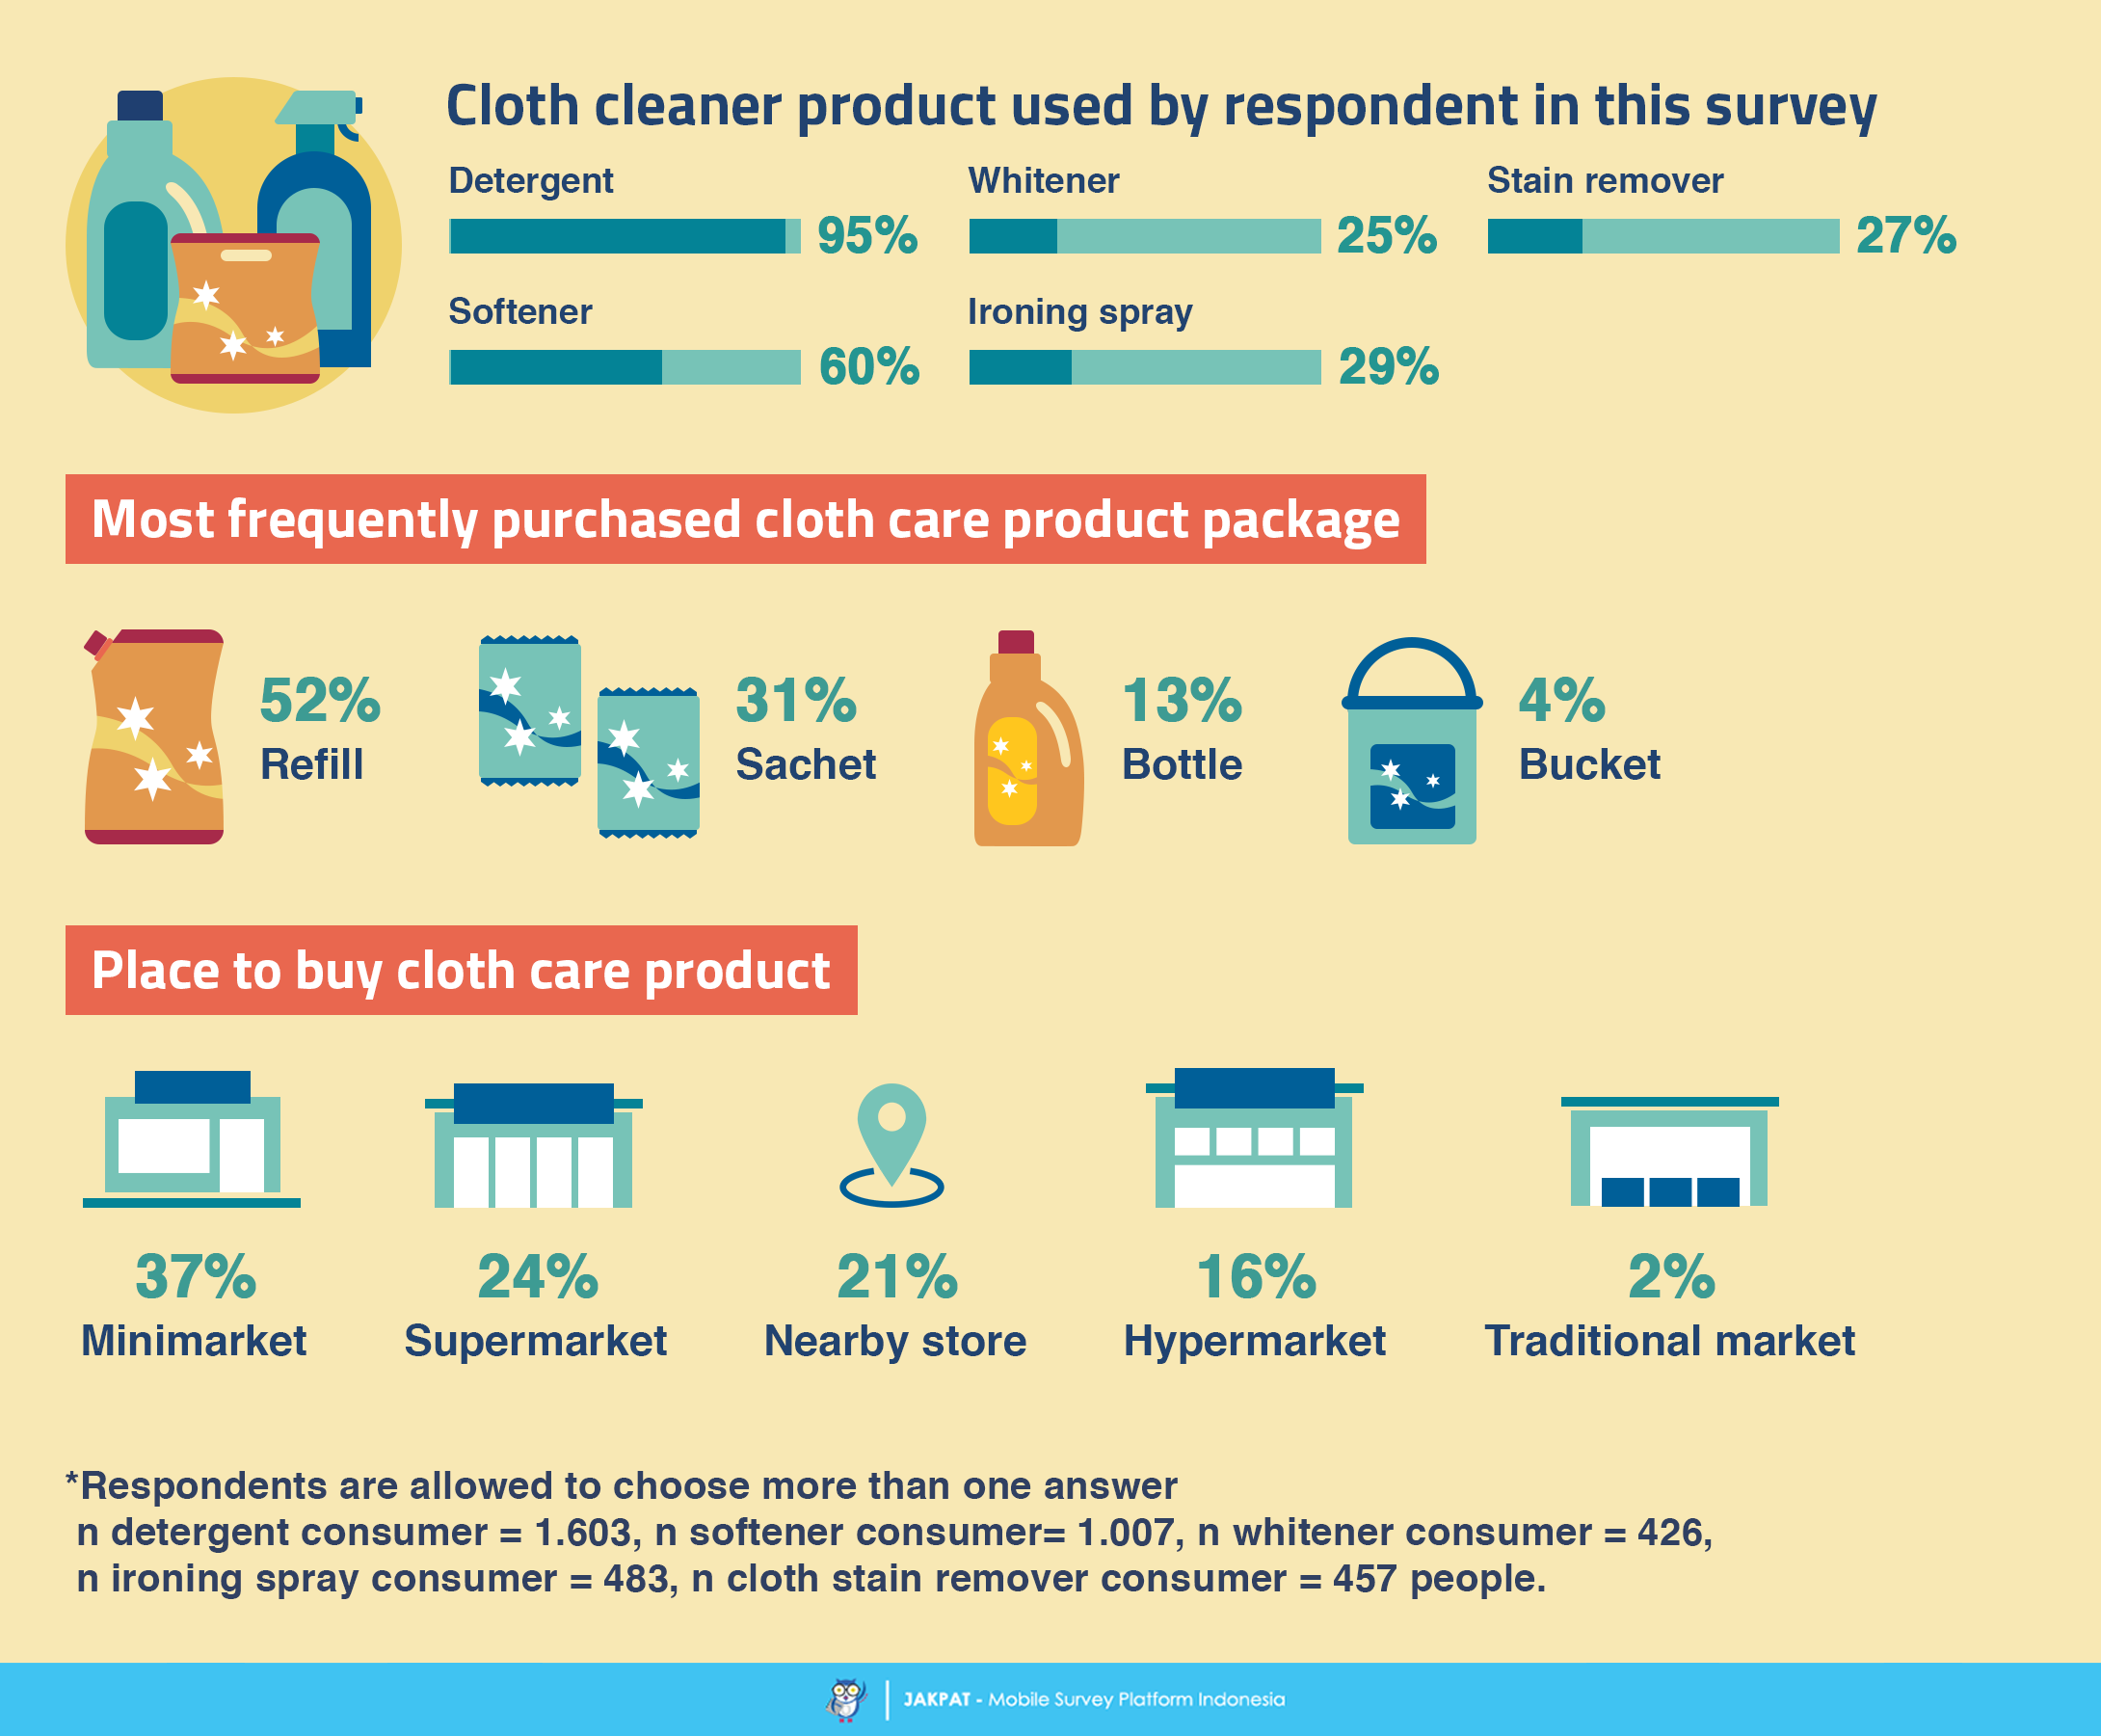
 Among all cloth care products available, detergent and softener become two most frequently used products to clean respondents’ clothes. Interestingly, most respondents in this survey are more likely buying cloth care product in refill size. Minimarket and supermarket also become their preferred shopping destination to buy cloth care products.
Among all cloth care products available, detergent and softener become two most frequently used products to clean respondents’ clothes. Interestingly, most respondents in this survey are more likely buying cloth care product in refill size. Minimarket and supermarket also become their preferred shopping destination to buy cloth care products.
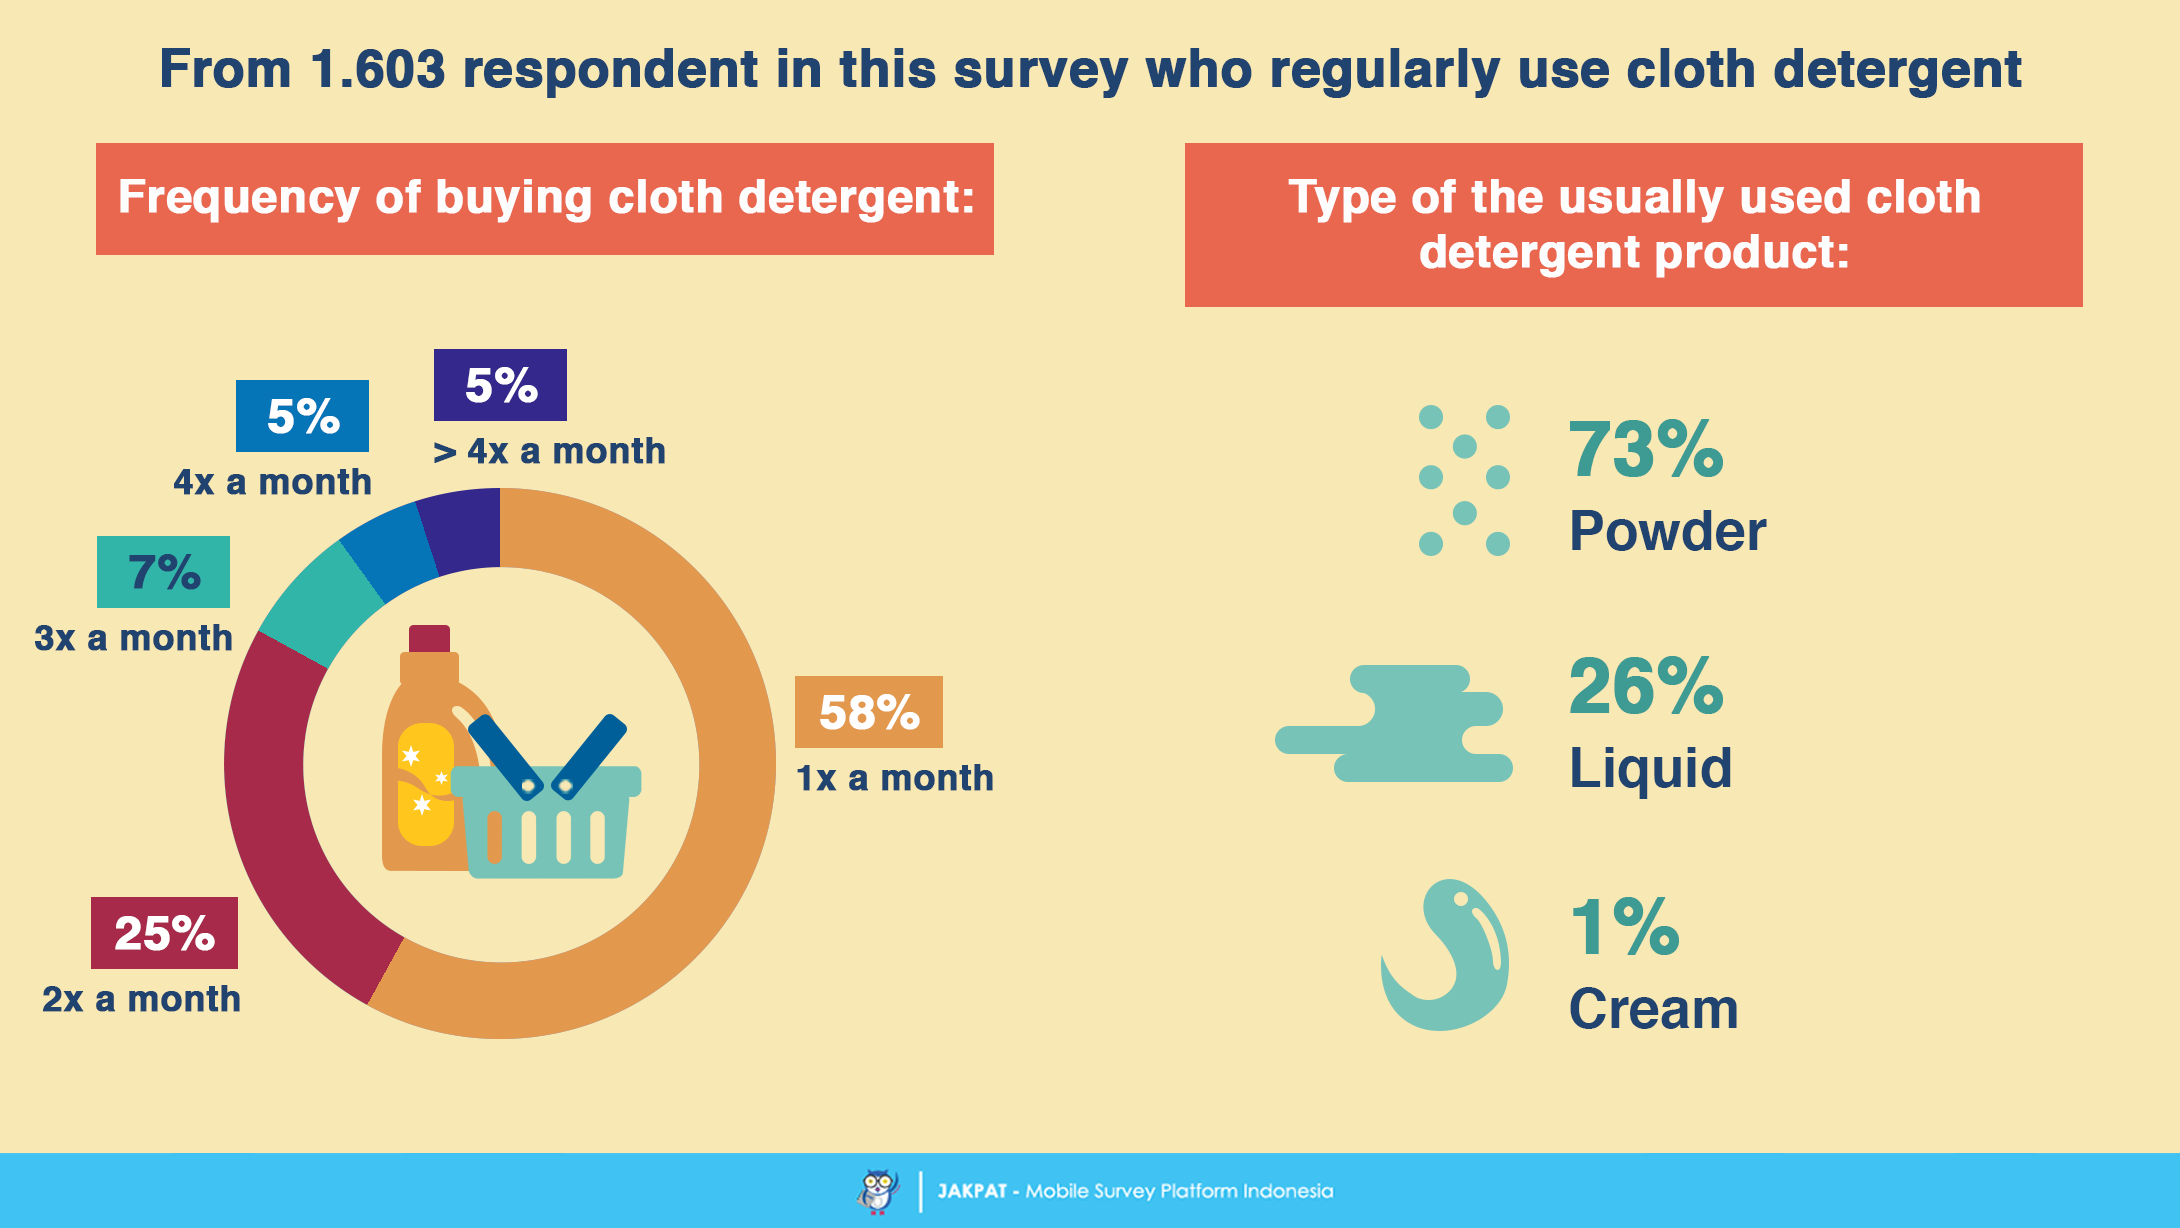
We further break down the consumption pattern of cloth care product based on each category. In every section, we would like to seek respondents’ buying frequency, their preferred brand, the decision maker, and their reason on choosing particular brand. At first, we ask to 1.603 respondents in this survey who regularly use cloth detergent about their buying frequency and product type they use most often.
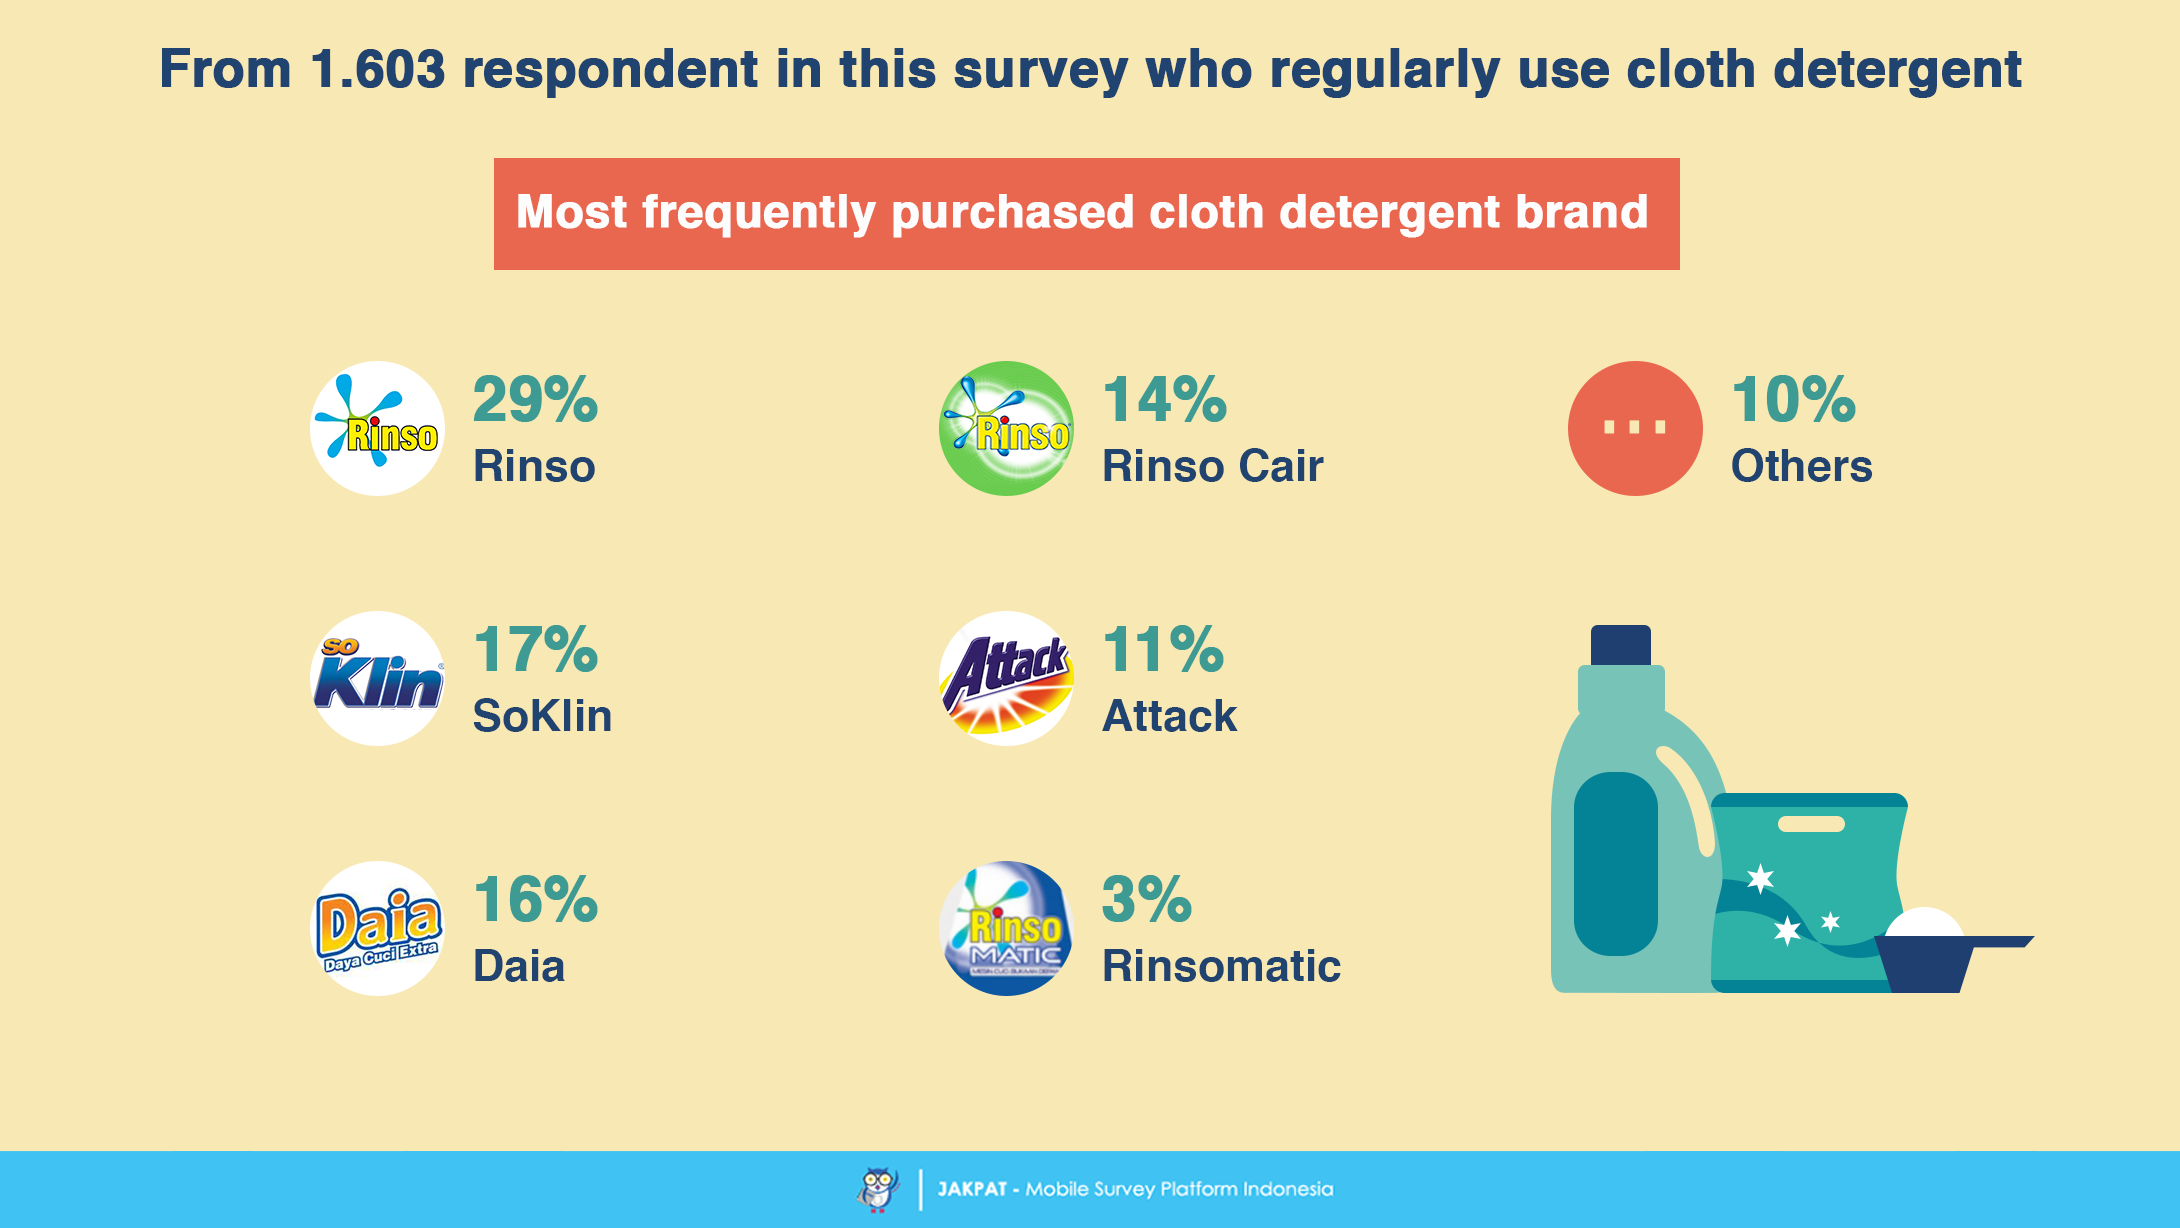
 In cloth detergent industry the competition among brands is already become very competitive. Rinso, SoKlin, and Daia becomes the top three detergent brands mentioned as the most frequently purchased detergent of our respondents. However, looking closer at Rinso as a brand, the strategy to leverage market segment by introducing Rinso Cair and Rinsomatic as its brand extension seems to be a successful idea as there are many respondent mention both brands as well.
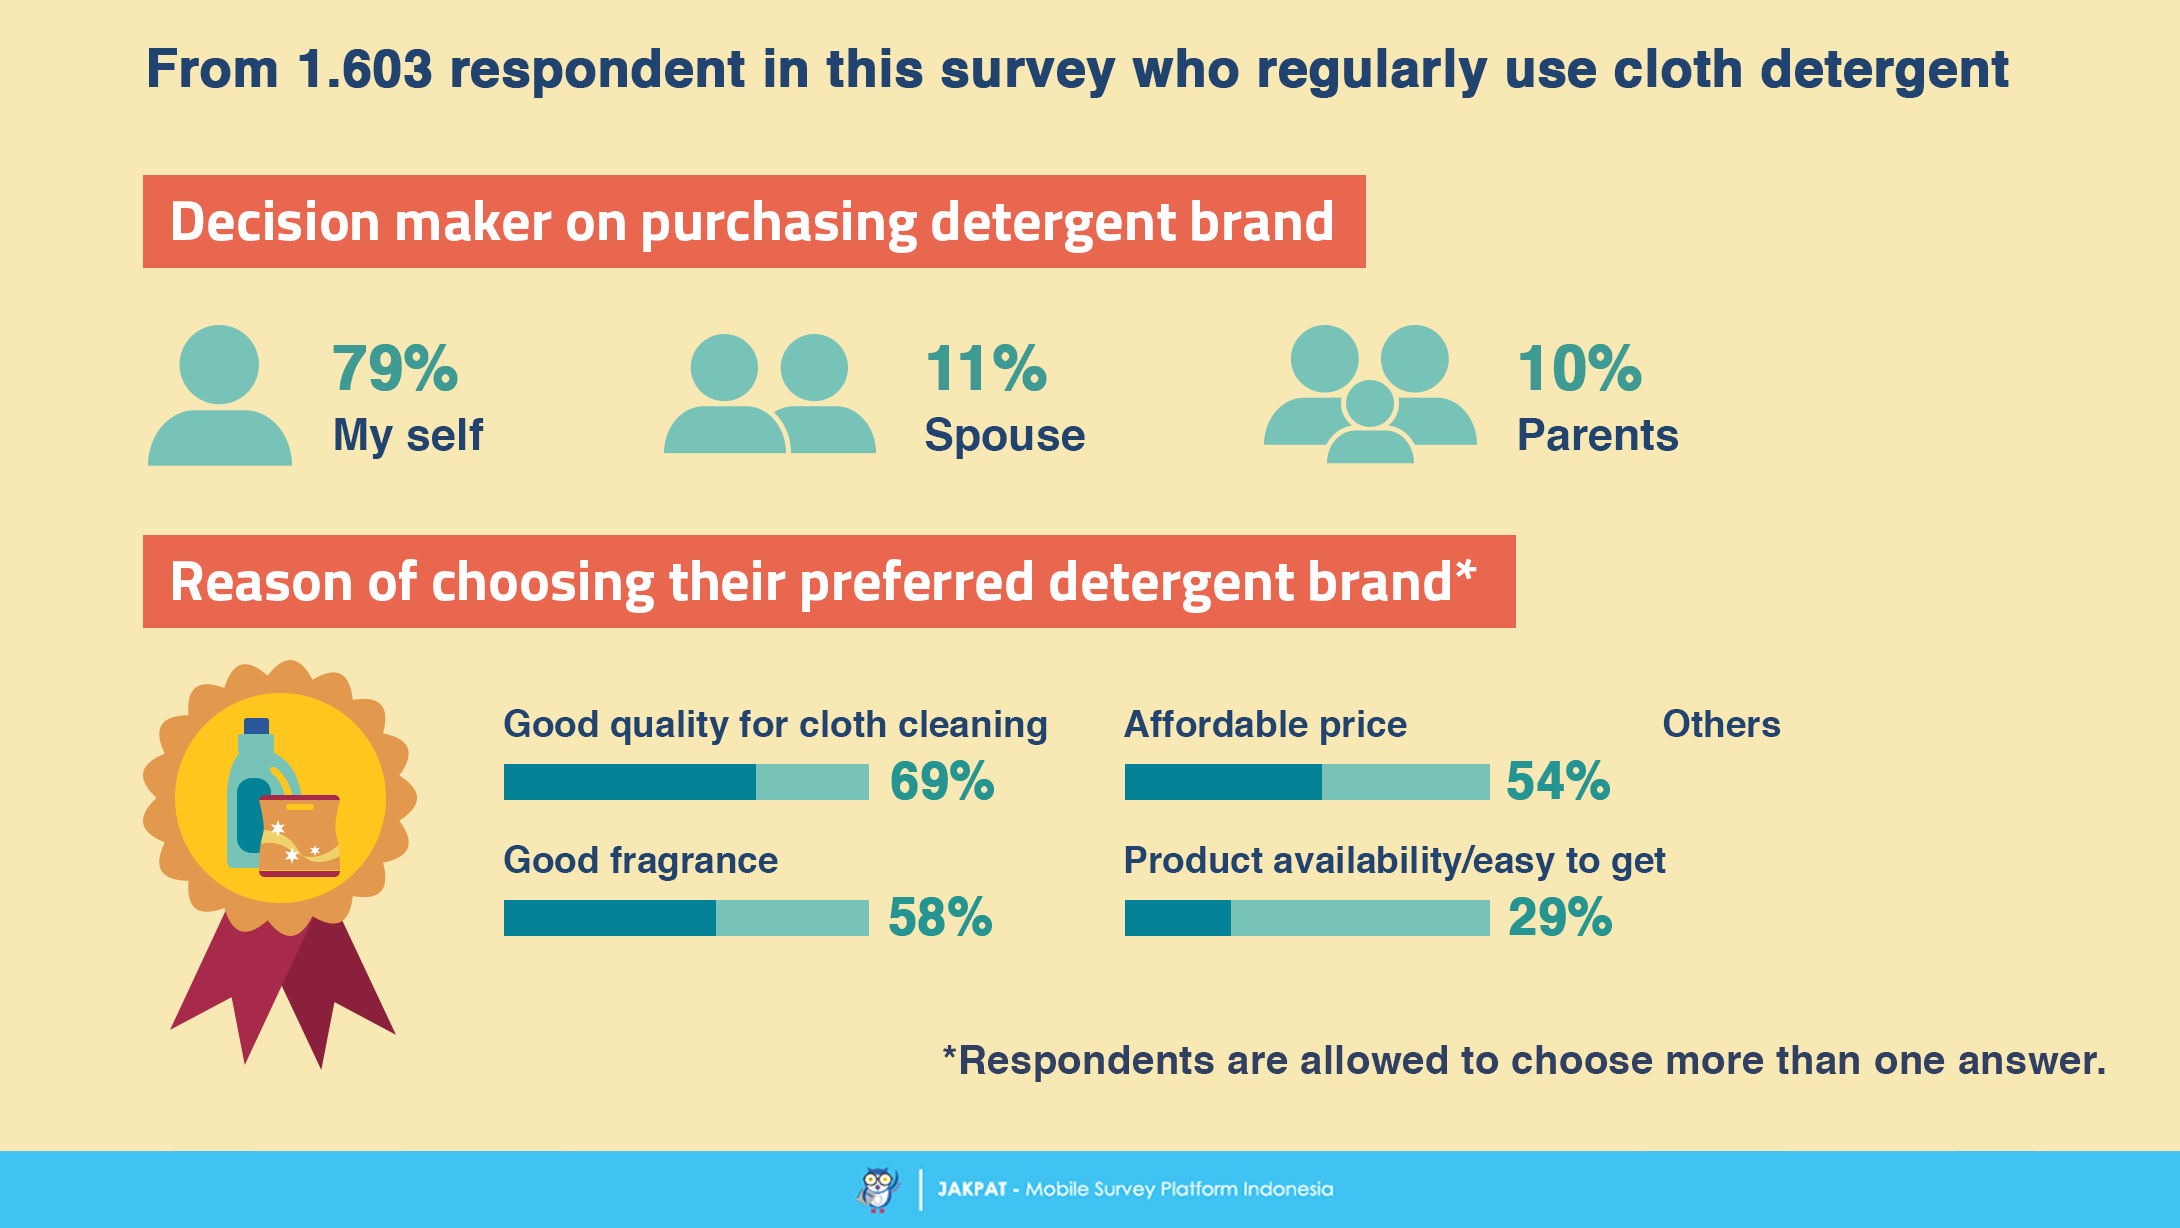
 The decision to buy specific detergent brand is mostly depends on the respondents themselves. However, especially for male respondent, the role of their wife and mother is very influential in deciding what detergent brand to buy. Moreover, detergent quality and fragrance becomes two top reasons among respondent on choosing their preferred detergent brand.
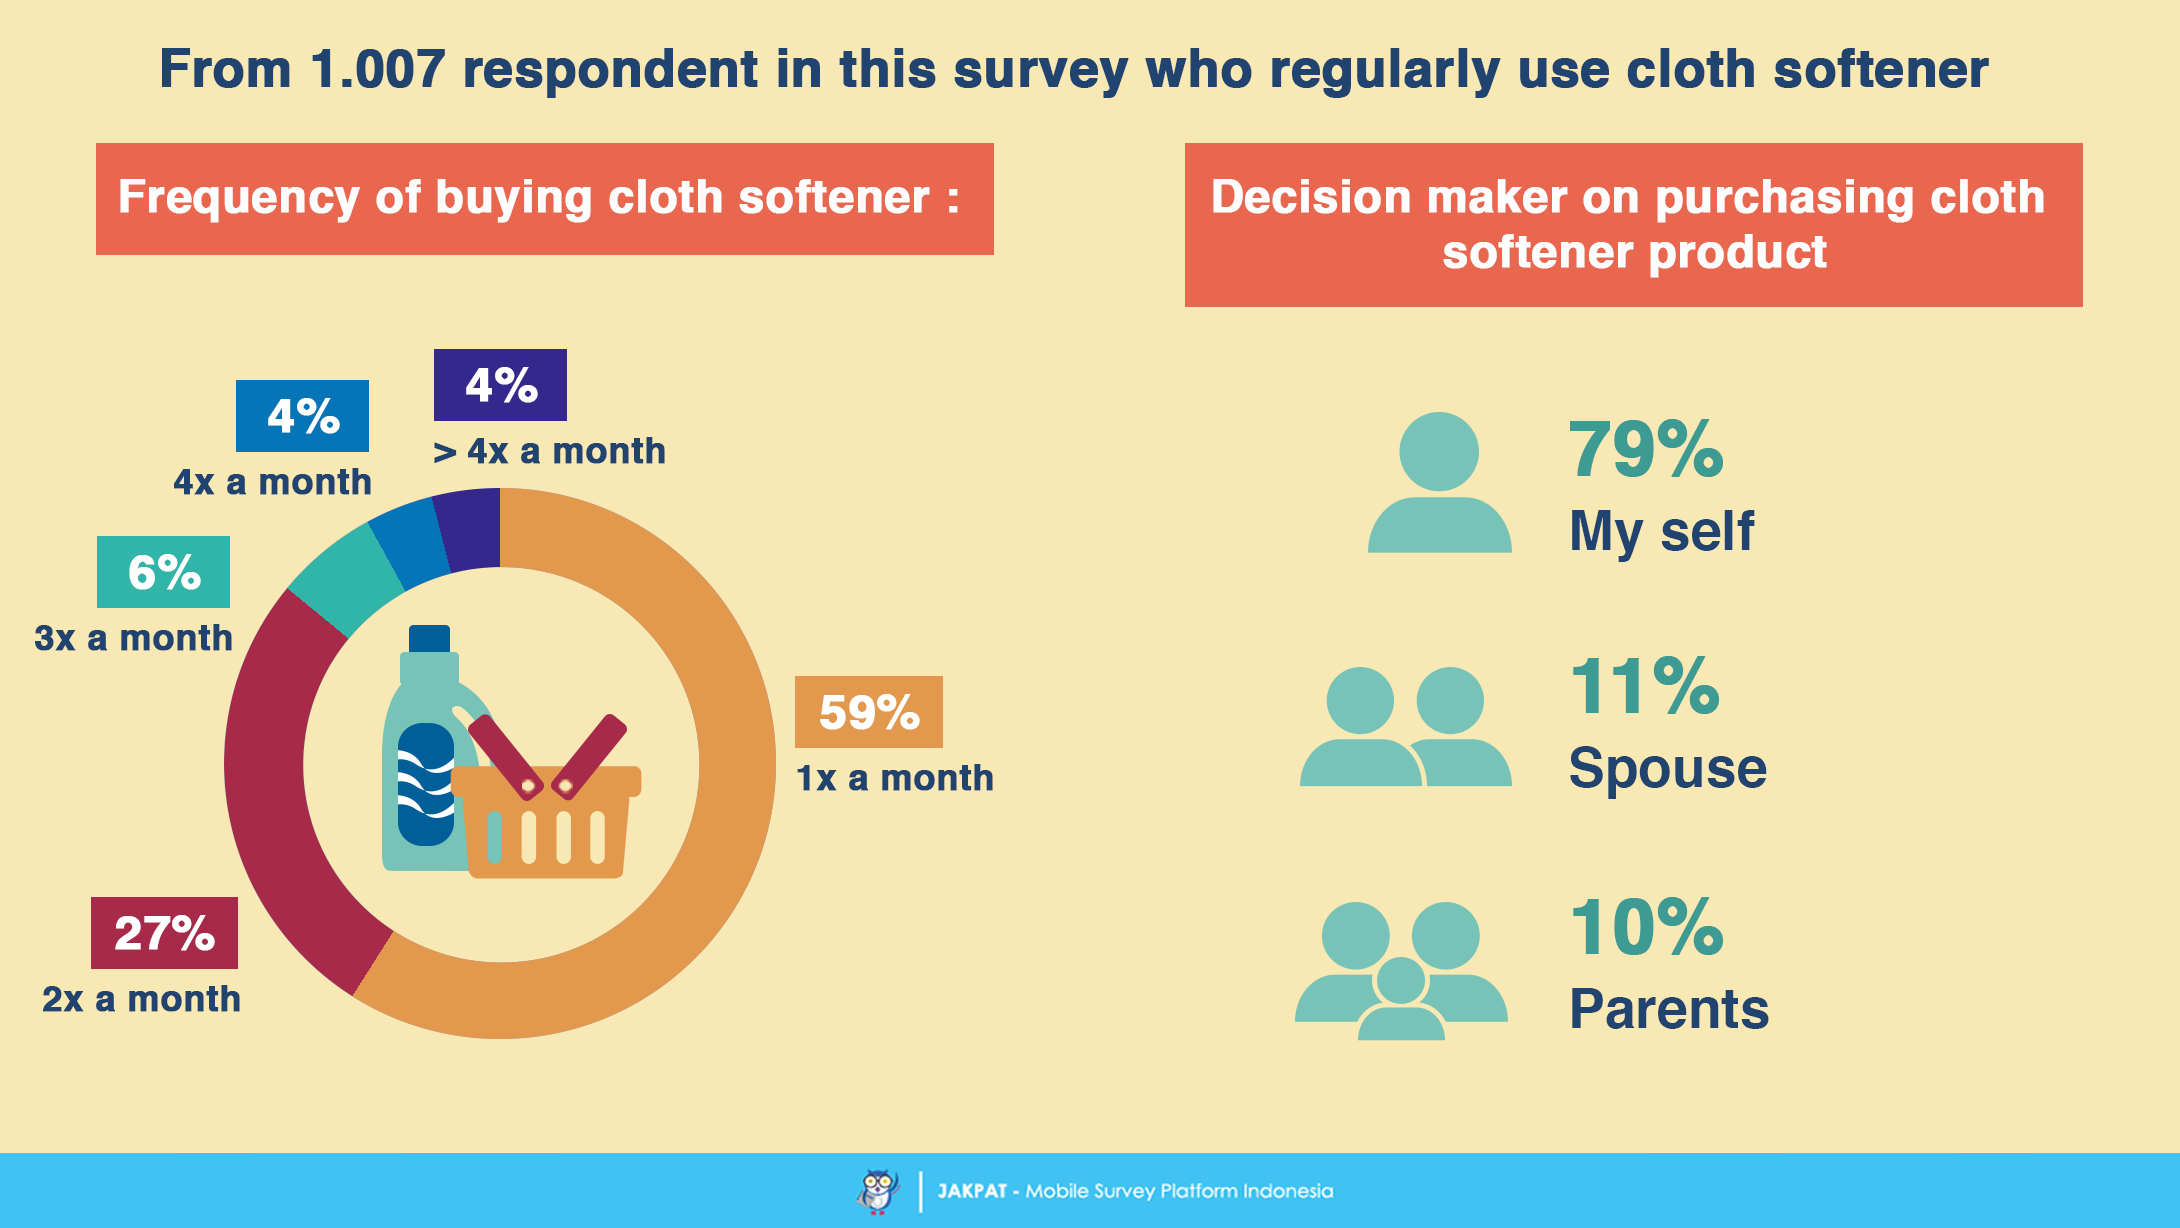
 The consumption pattern of cloth softener in general is not showing any significant difference with cloth detergent. Most respondents only buy it once a month; while respondent themselves become the most powerful decision maker in choosing softener brand to be bought.
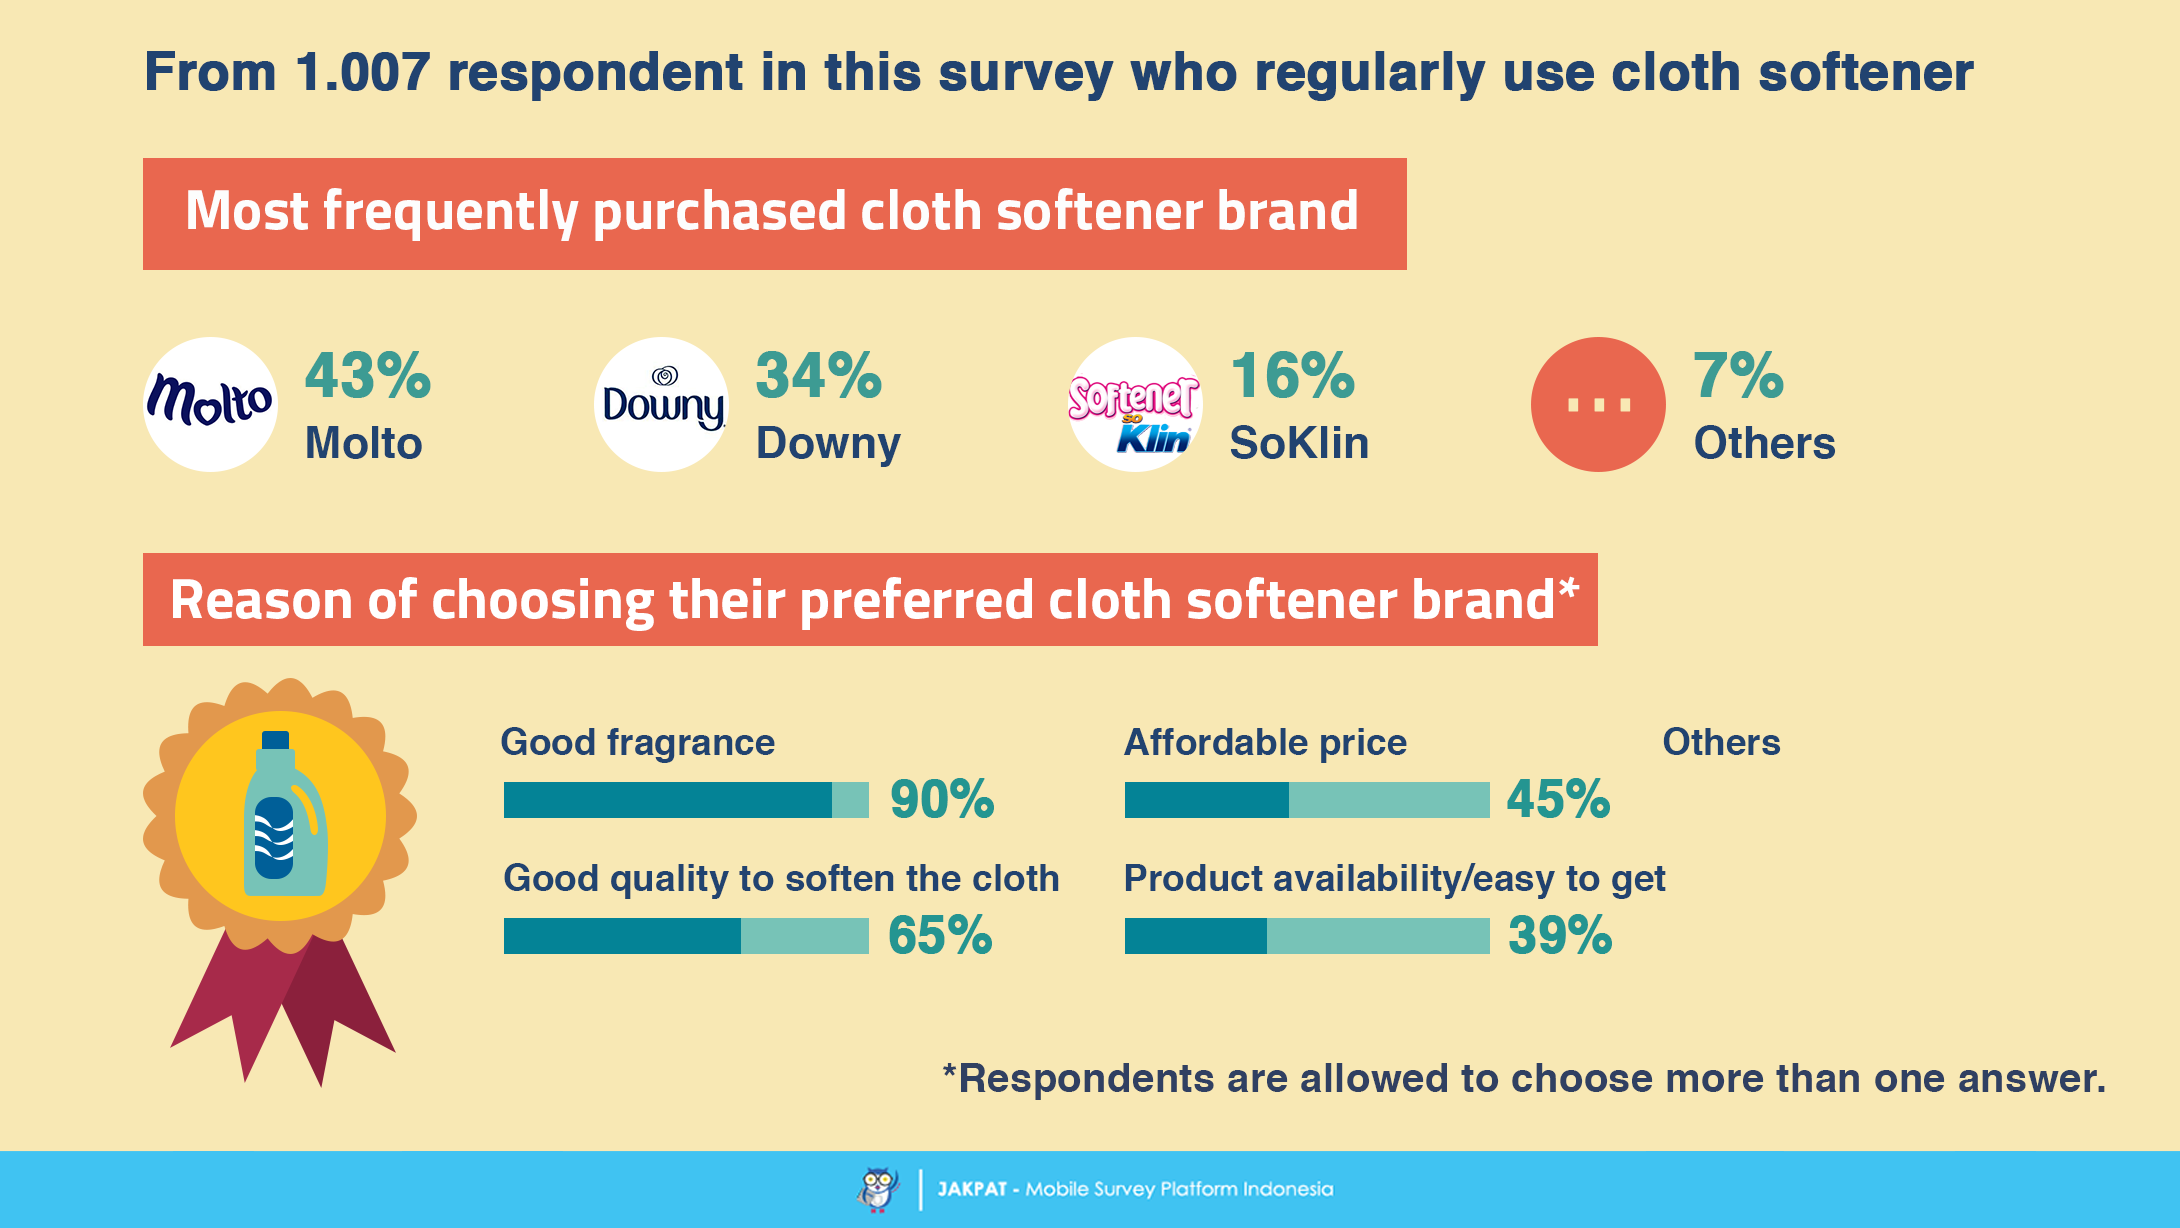
 Quite similar with the cloth detergent category, the competition in softener market is pretty rough as well. However, Molto and Downy seems to be the top two most frequently purchased softener among respondents. As softener is specifically used to support cloth cleaning process, most respondents in this survey tend to decide particular softener brand based on its fragrance and quality.
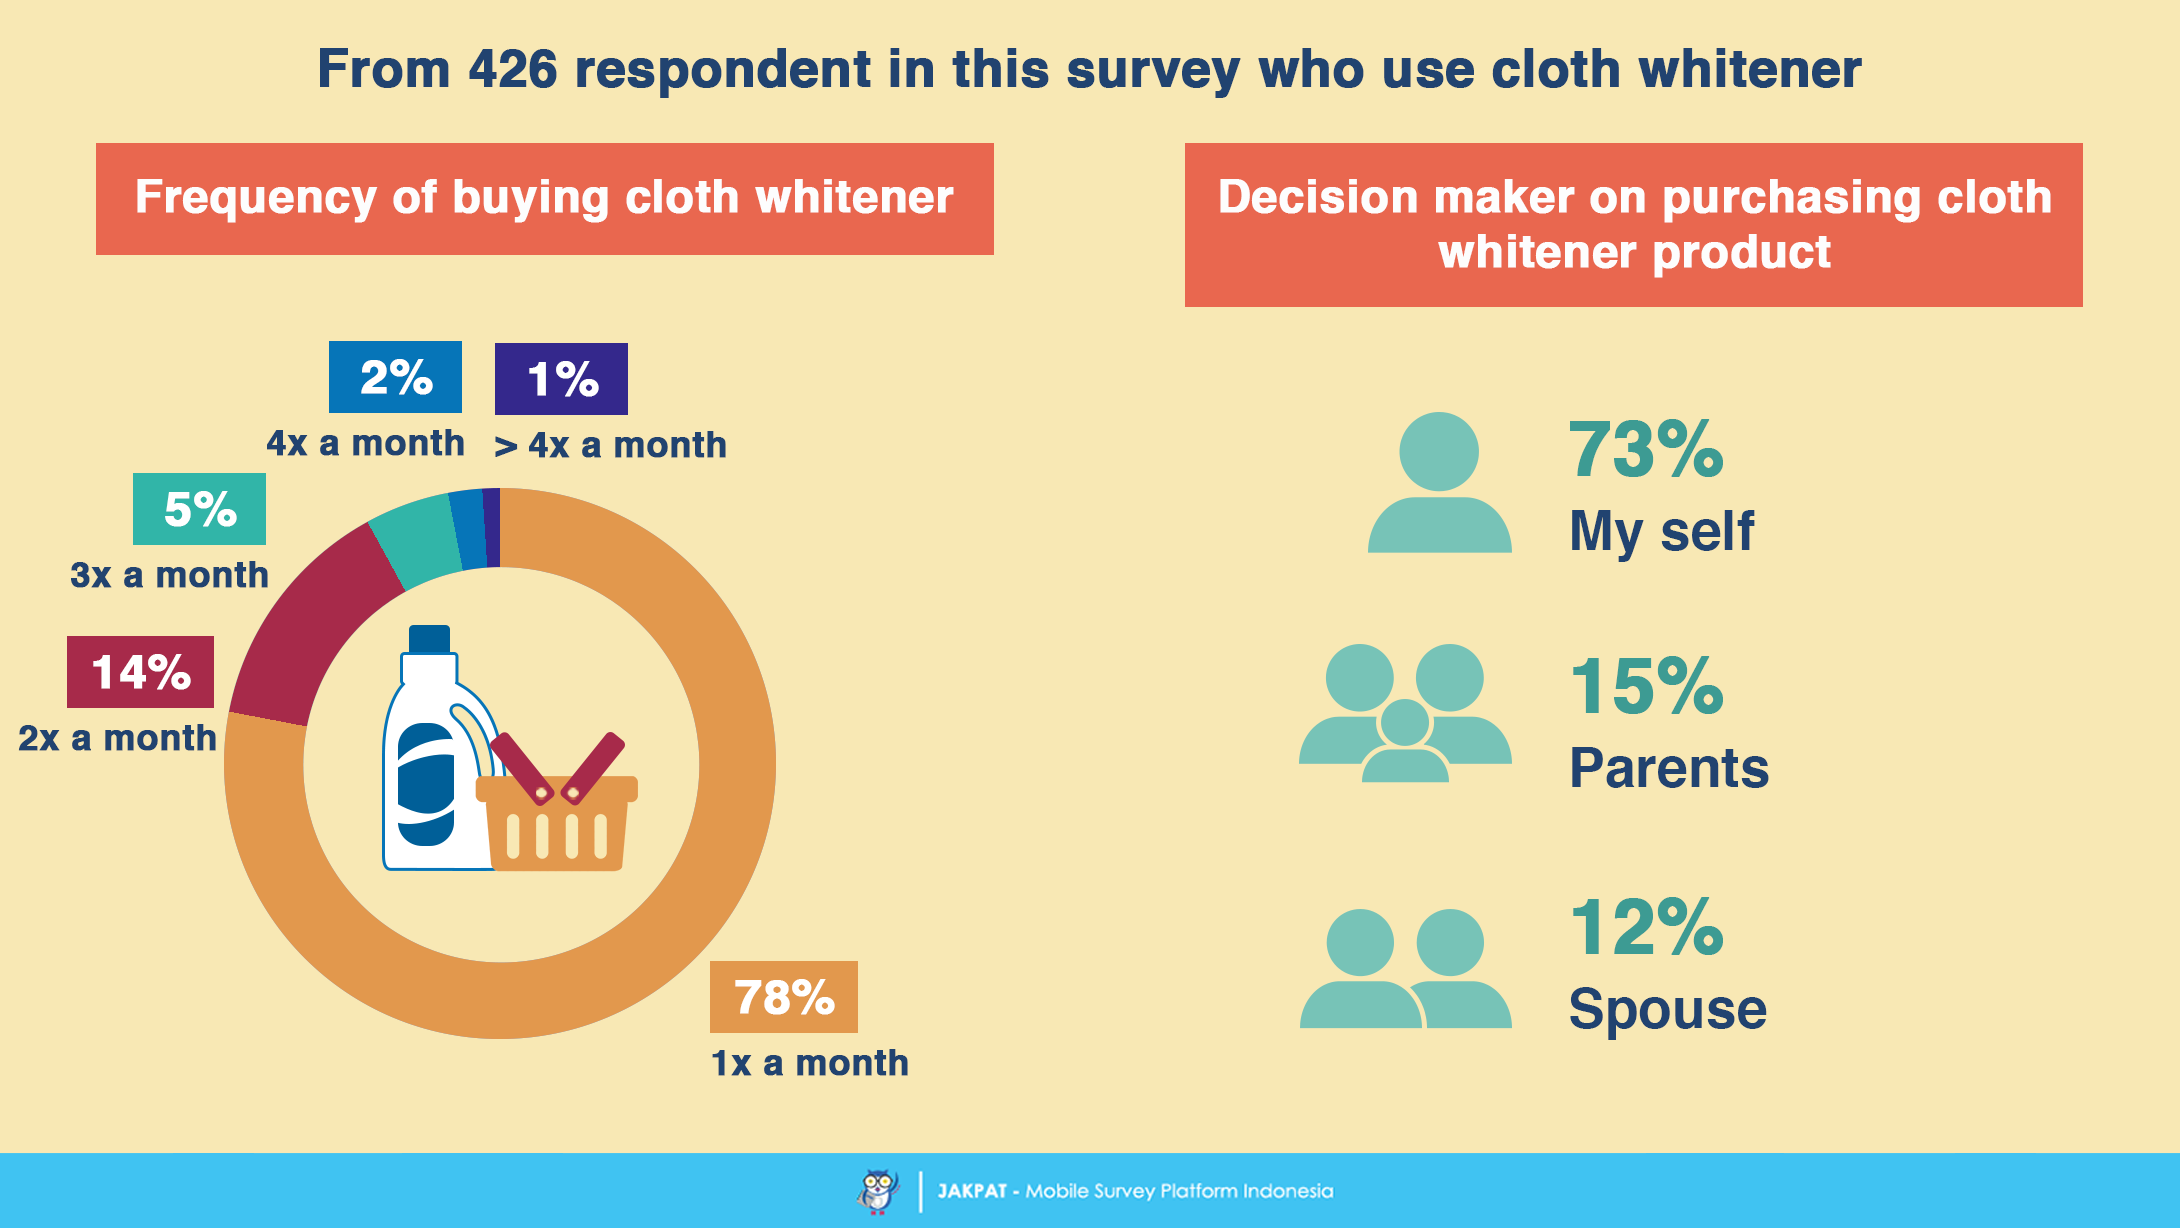
 The usage frequency of cloth whitener may not be as frequent as detergent and softener. However, the purchasing pattern of this product is just similar as both products. Most respondents buy cloth whitener product in once a month. Moreover, respondent holds the biggest power as most purchase is decided by them.
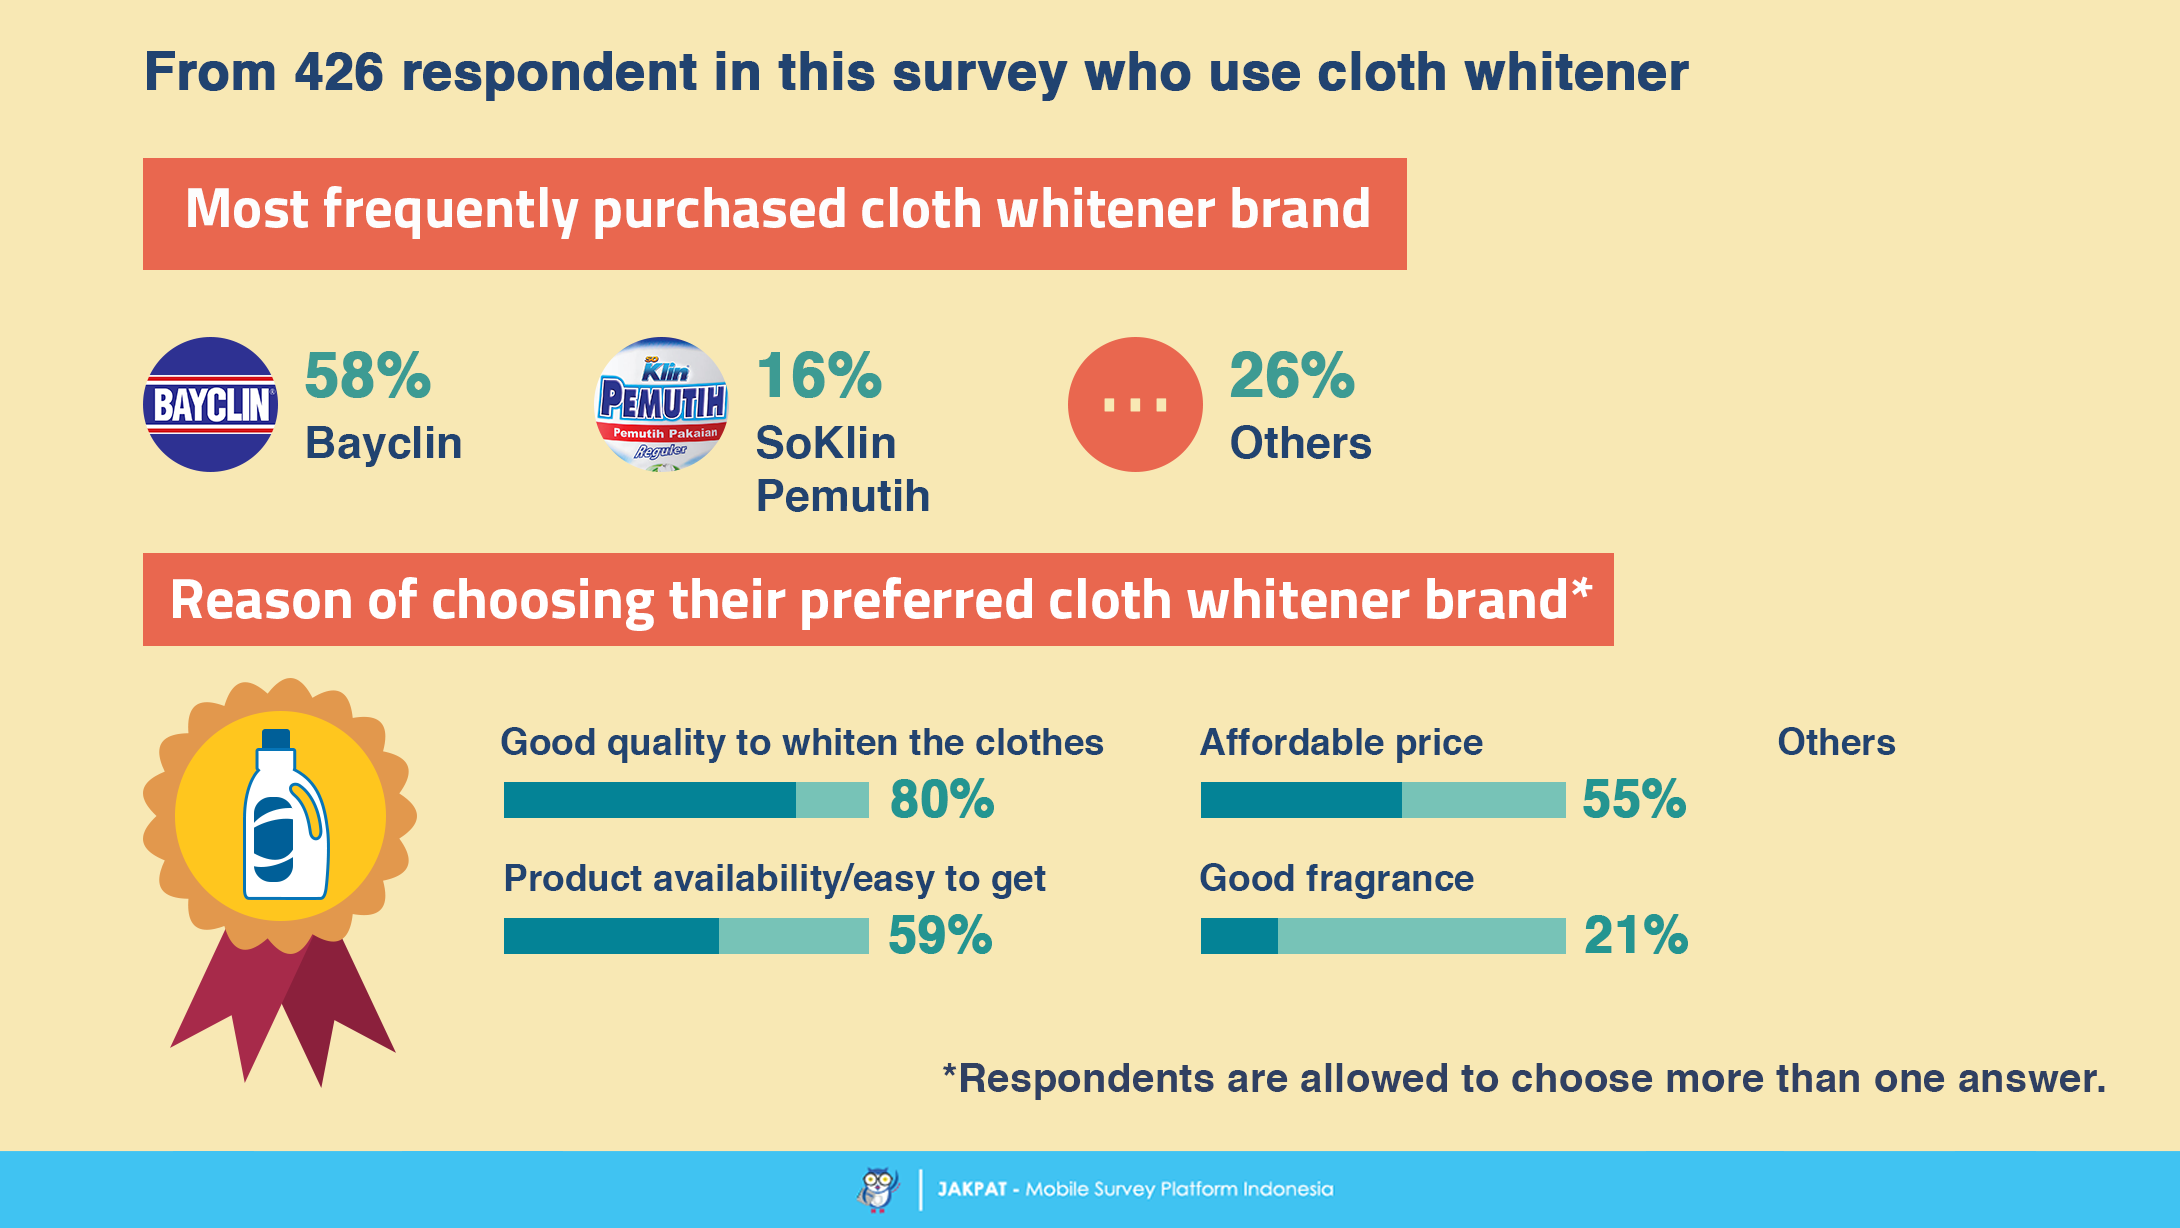
Cloth whitener industry tends to be dominated by certain brand only. Among all cloth whitener brand mentioned by respondent in this survey, Bayclin is mentioned by 58% respondent. Furthermore, respondent reason of choosing their preferred cloth whitener brand are mostly depends on the product quality and availability in the market.
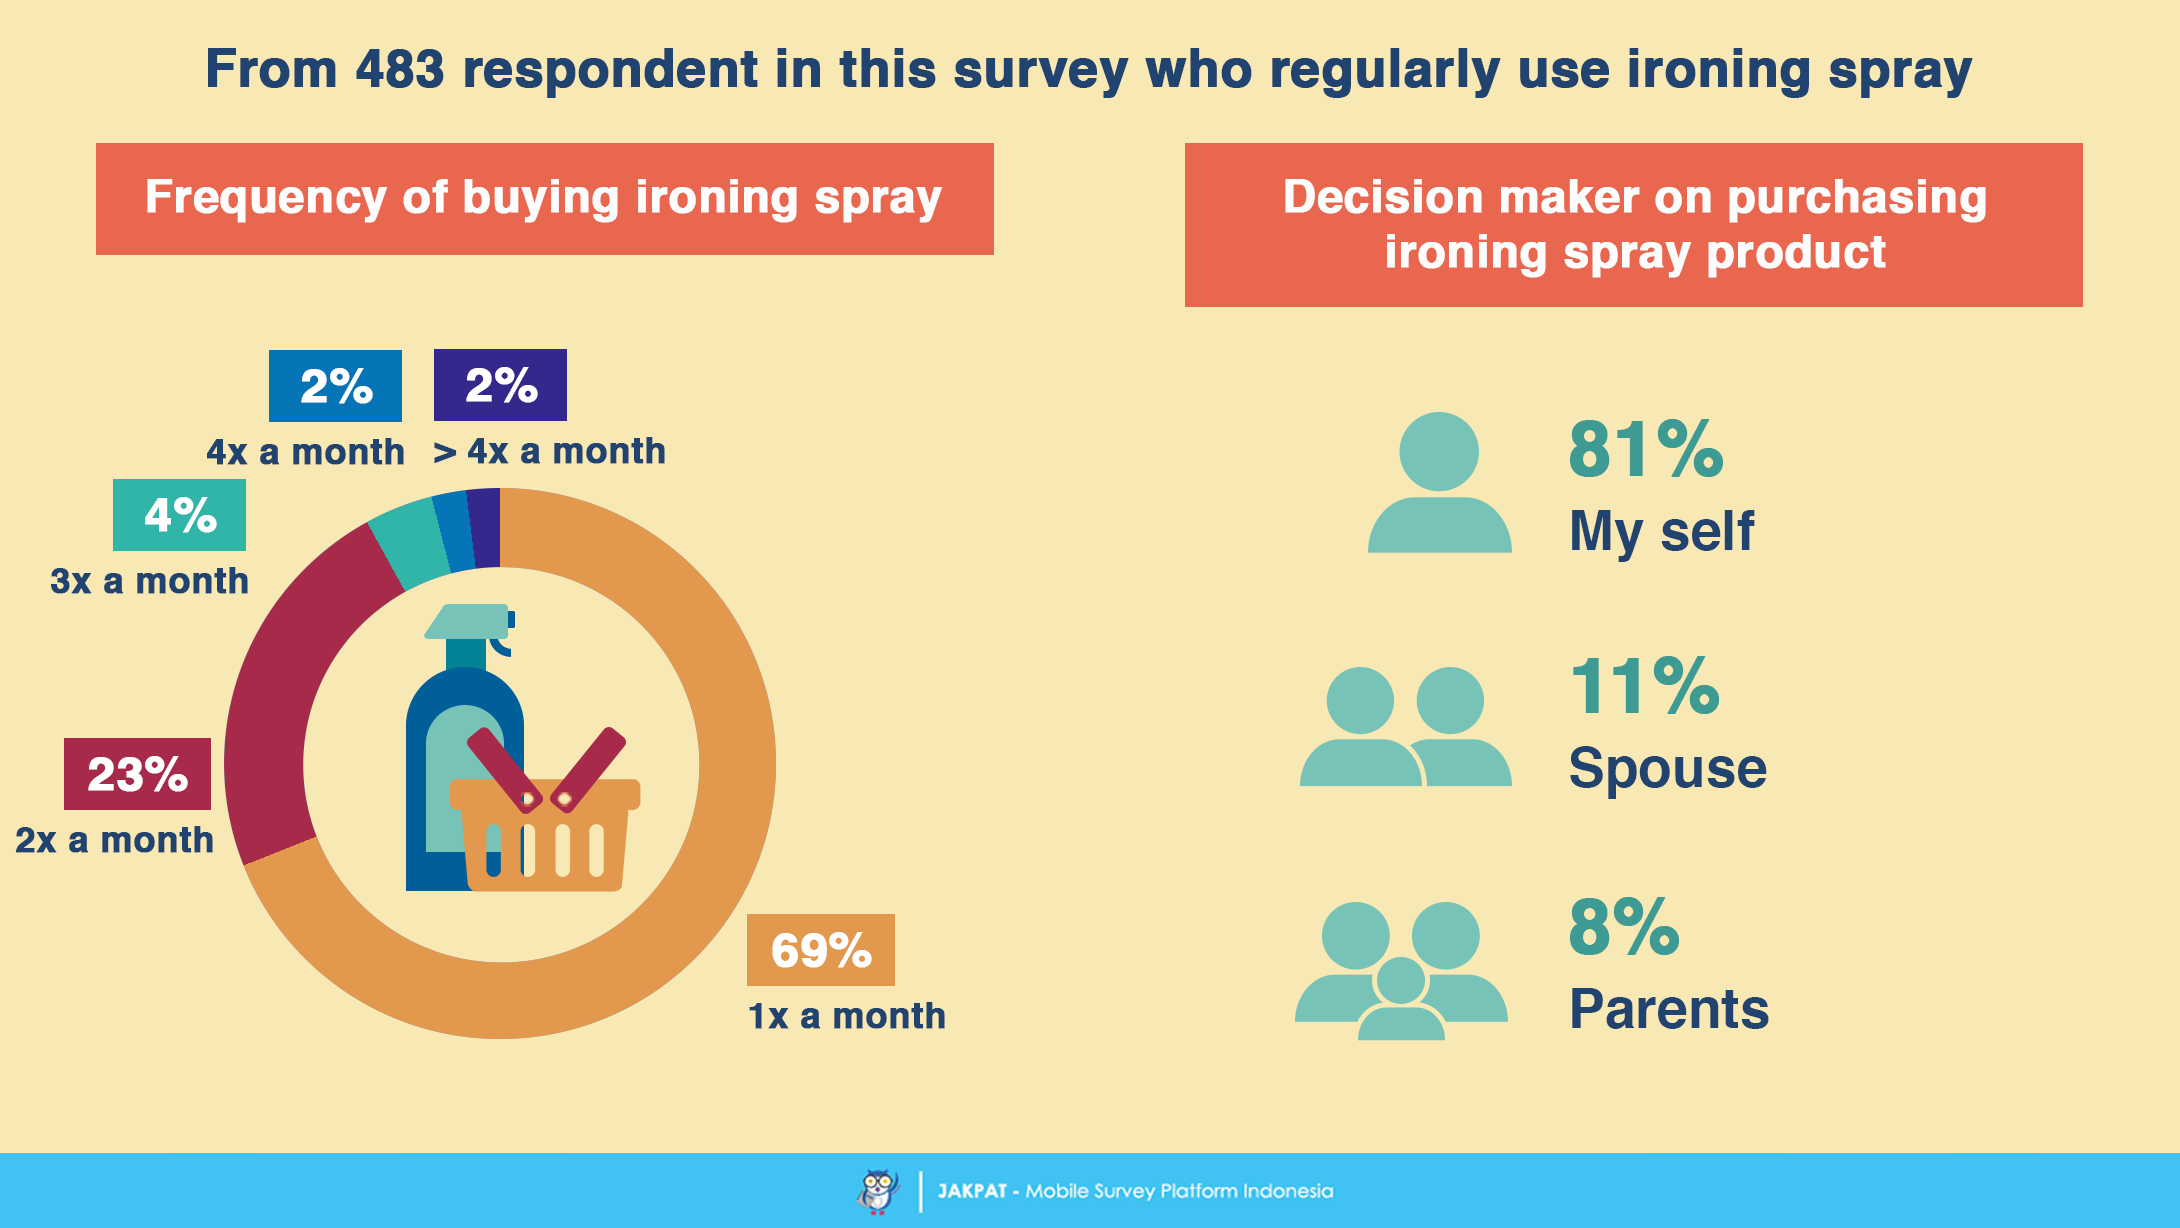
Another essential in cloth care product is the ironing spray. Most respondents in this survey buy ironing spray in about once to twice a month. The purchase decision on ironing product is mostly done by the respondents themselves.
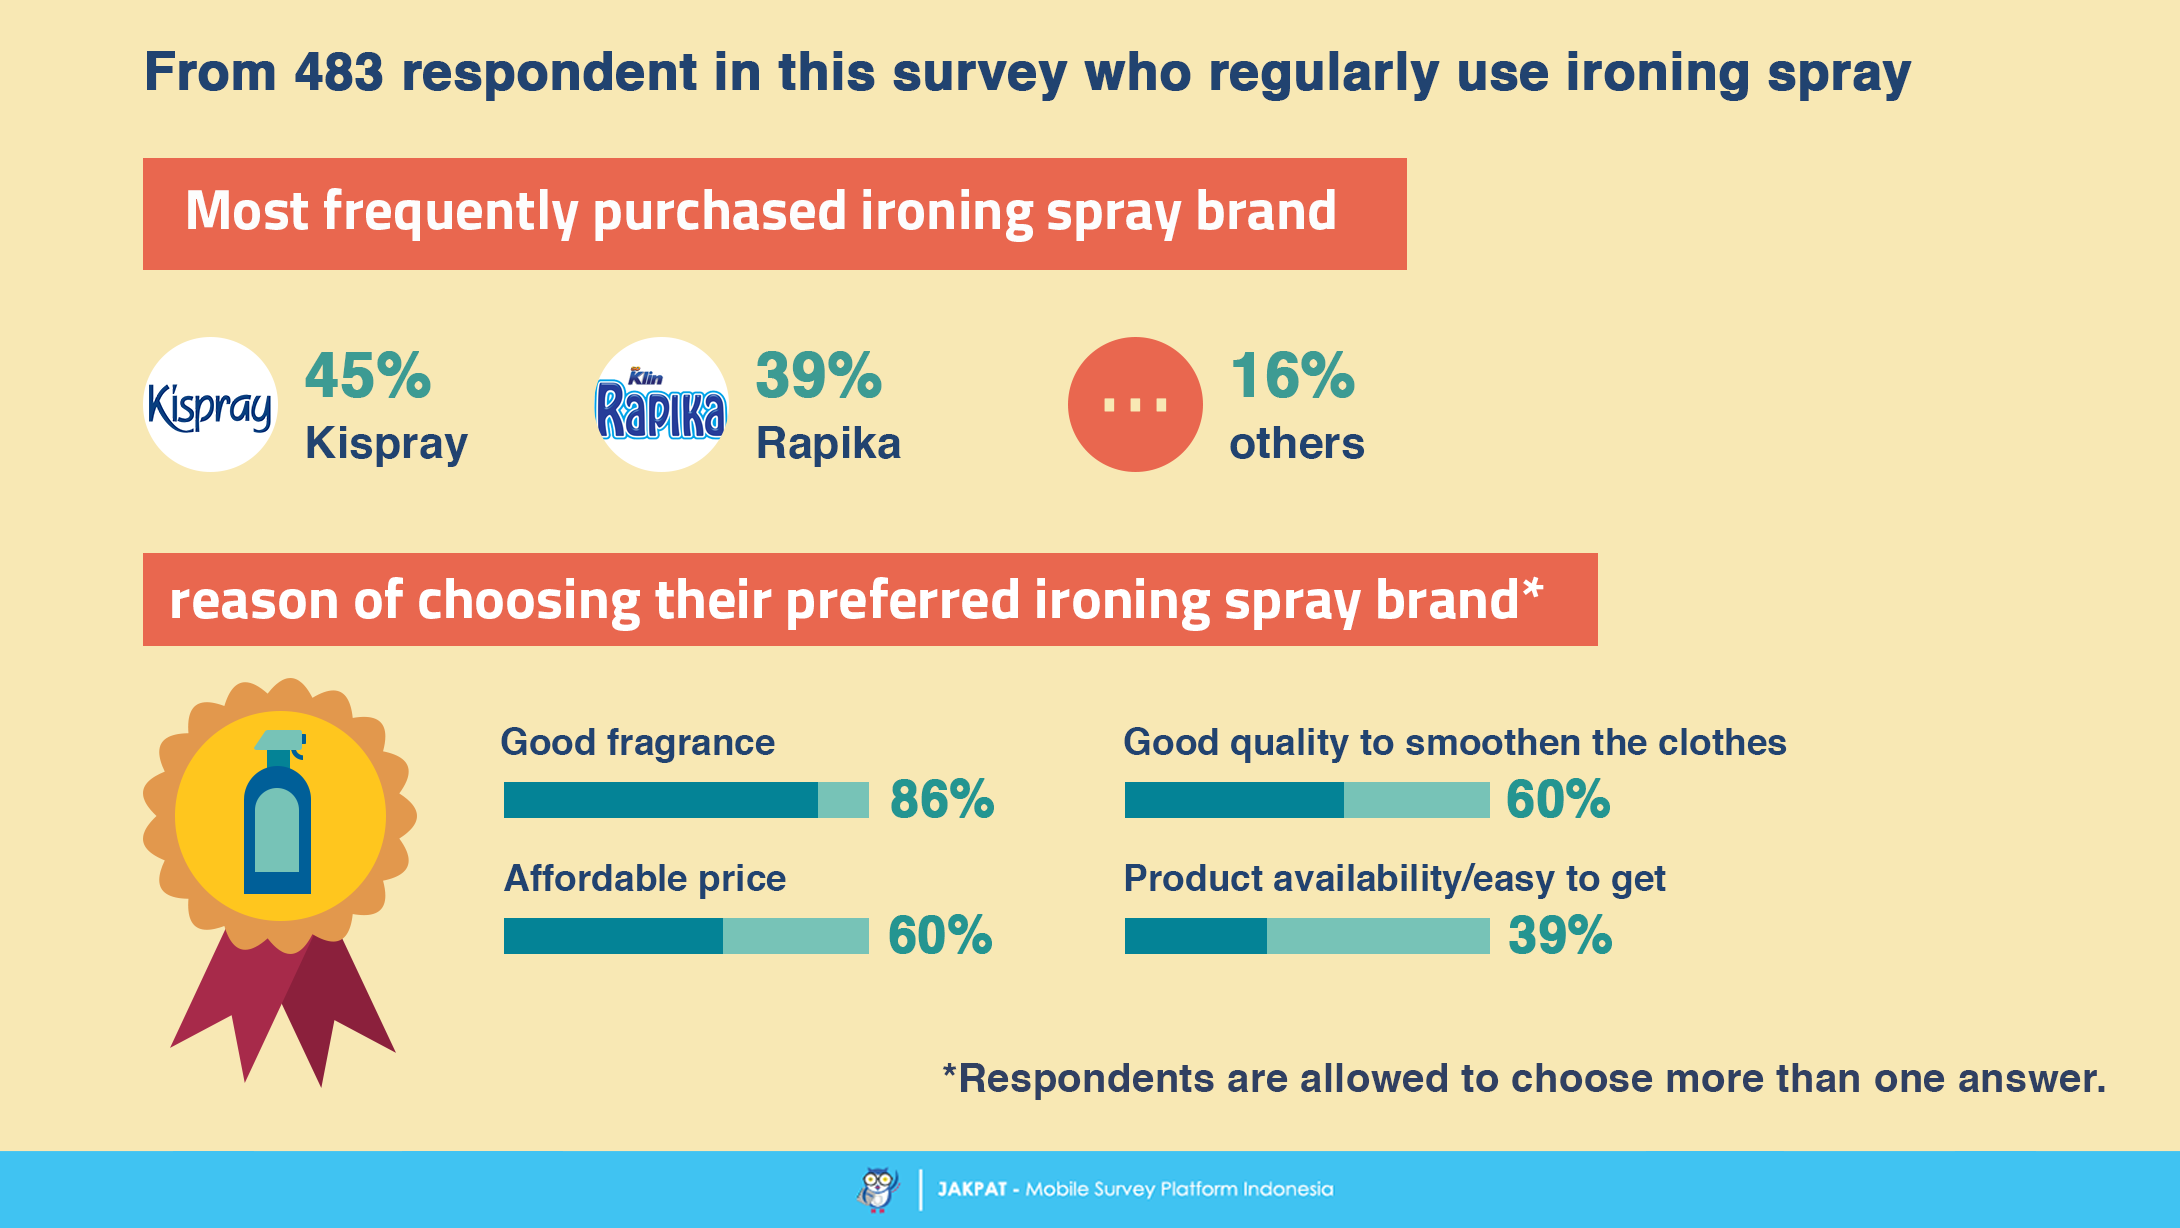
Kispray and Rapika tend to dominate the ironing spray market competition. Both brands are mentioned as the most frequently purchased ironing spray product. The percentage difference between Kispray and Rapika is very few, so that it may enables them to be the head to head competitors. Moreover, product fragrance and price become two most important factors for most respondents in this survey regarding their reason on choosing ironing spray product.
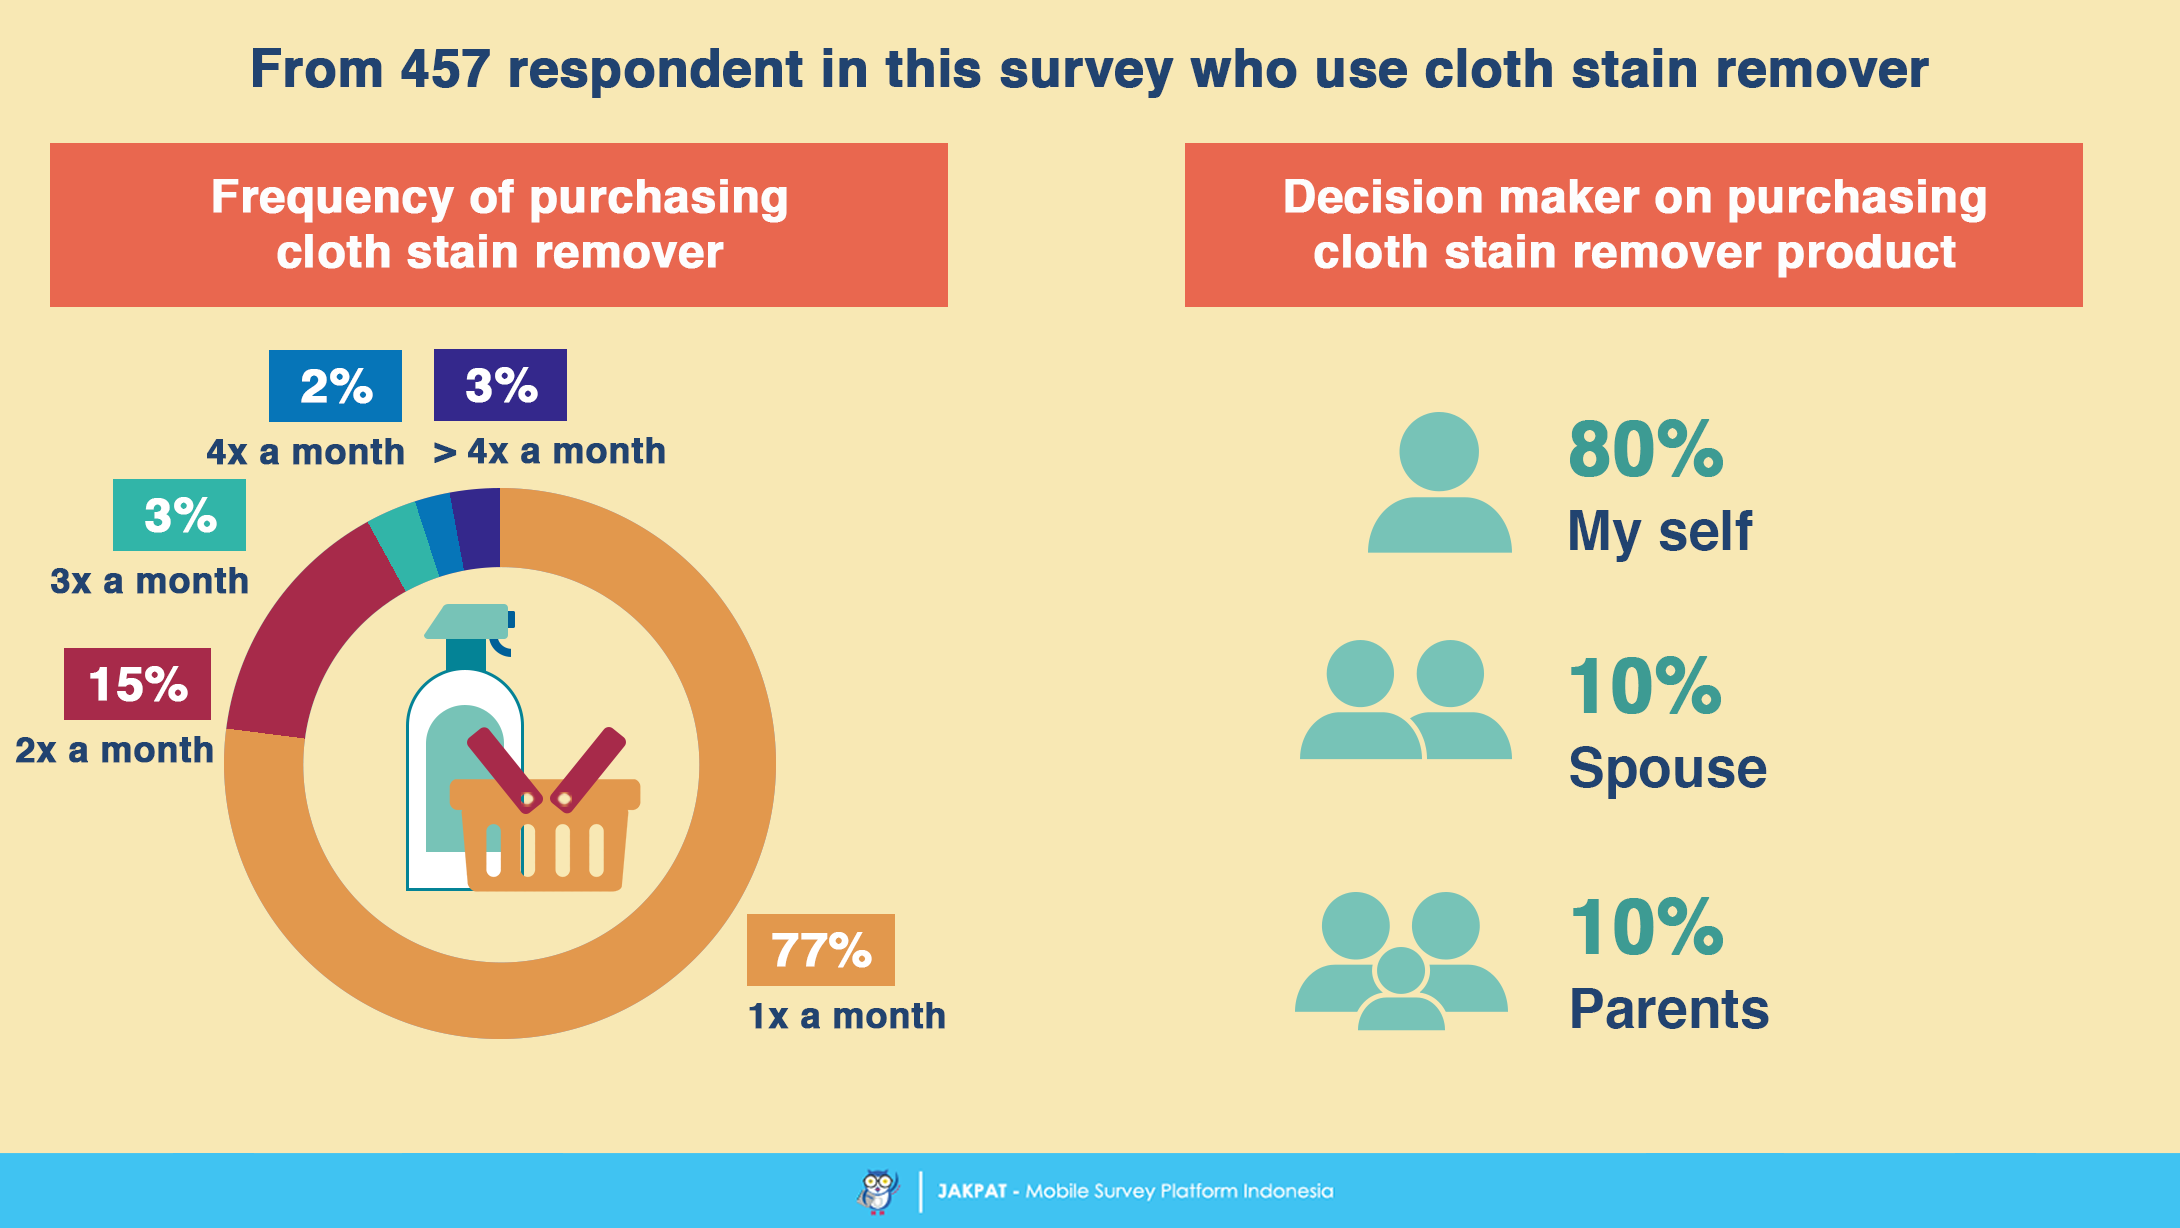
The most annoying part on doing cloth cleaning is when we find any stain in our clothes. The cloth stain remover may not be used frequently, but its existence plays an essential role. Quite similar as other cloth cleaning product, the purchase frequency and decision maker on purchasing cloth stain remover product is not showing any difference.
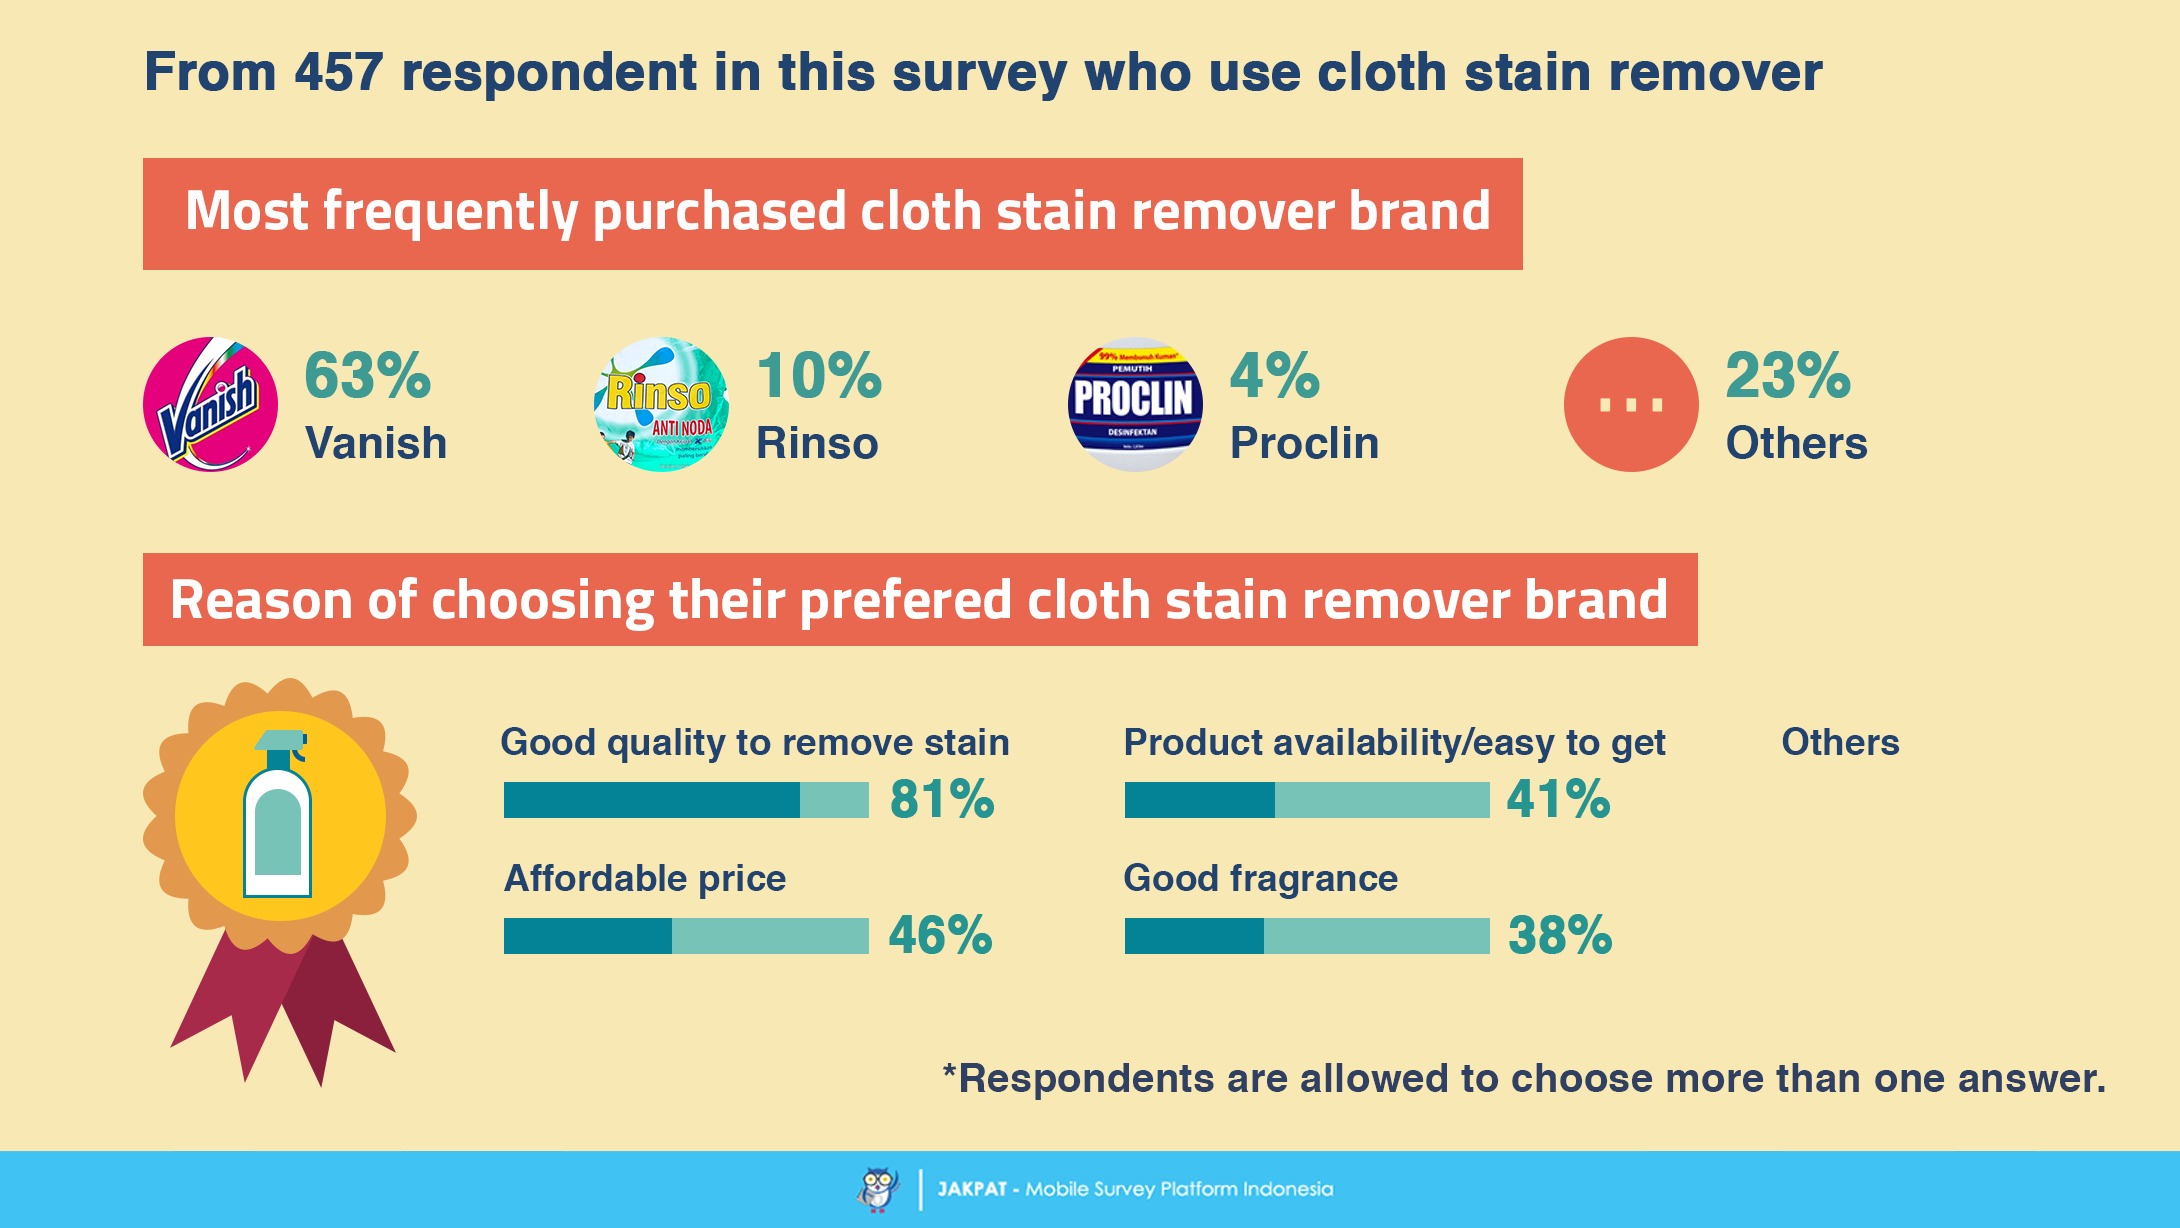
Among all cloth stain remover brand mentioned in this survey, Vanish is in the top position compared to other brands. More than half of respondent in this survey mention Vanish as their most frequently purchased cloth stain remover brand. Moreover, their preference on cloth stain remover product is mostly based on the product quality and price.
For more detail you can download XLS report at the button below (Bahasa Indonesia). JAKPAT report consists of 3 parts which are 1) Respondent Profile, 2) Crosstabulation for each question and 3) Raw Data. Respondent profile shows you demographic profiles ( gender,age range, location by province, and monthly spending). Cross tabulation enables you to define different demographic segment preference on each answer.
![]()
You can also download PDF here:
![]()

or Get A Sales Quote by filling this form or Call to +622745015293
