

In this survey, we, JAKPAT, wanted to update the previous survey relating to boarding house renters (anak kos in Bahasa). In order to conduct this survey, we chose 978 respondents of 2165 respondents as sample in this survey. The proportion between male and female respondents is male respondents (51.02%) and female respondents (48.98%). Our respondents participating in this survey are from <16 to 45 y/o. You may see more information concerning our respondents from respondents’ profile below. 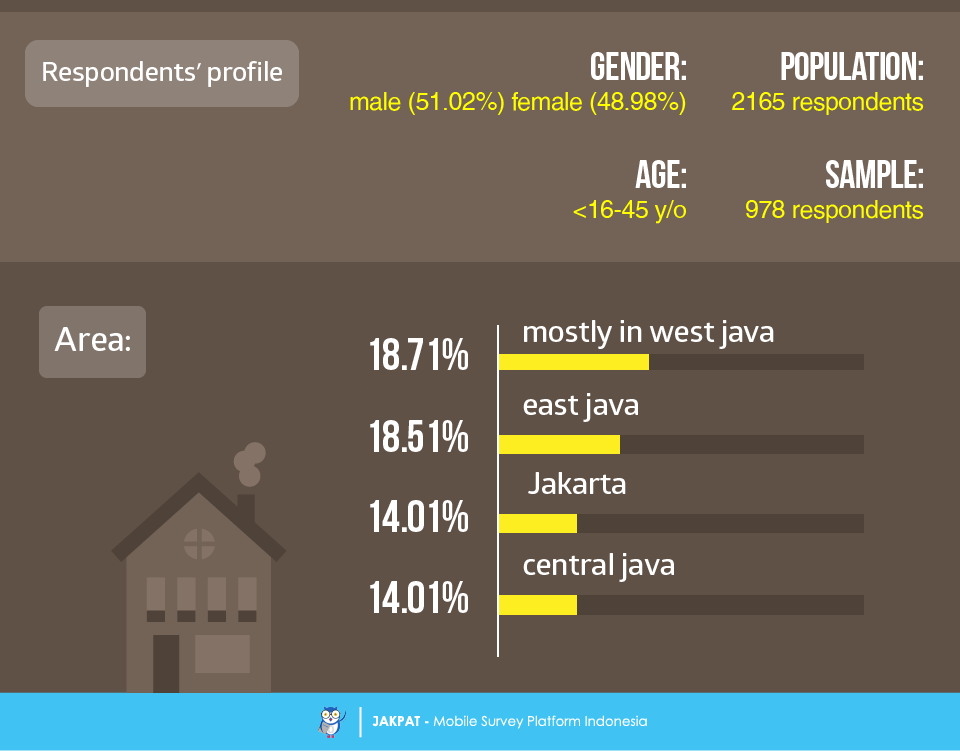
 The most interesting fact we found in this survey is our respondents, either male or female tend to have similar Buy inflatable water slide Canada answer, except for question regarding online shopping. Male respondents are less inclined to do online shopping than female respondents.
 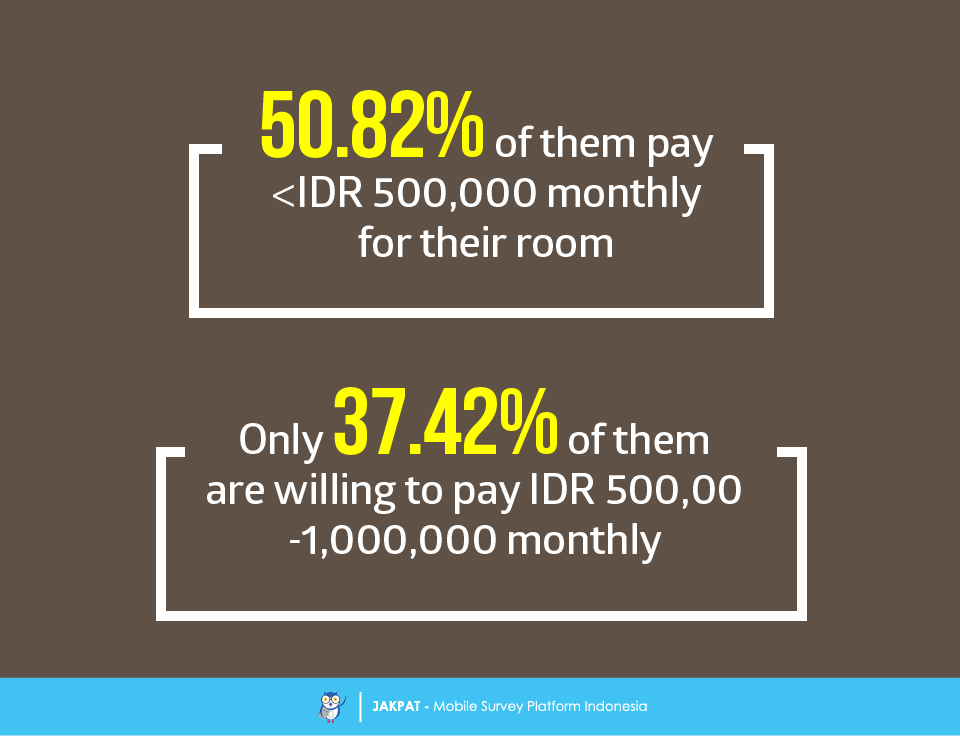 How much do they pay for renting cost? Majority of respondents said that they pay monthly <IDR 500,000. Although we found that some of our respondents pay monthly IDR 500,000-1,000,000 for renting cost, we saw that they are respondents who are 30-35 years old.
  Majority of respondents prefer having private bathroom in their rooms (53.07%). And the priority of other facilities to our respondents differs from ±10% to ±20%.
  Most of our respondents spend <IDR 50,000 for their food (67.59%). We also found that some of respondents spend IDR 50,000-1,000,000 for food. And they are respondents who are 30-35 y/o. majority of respondents who are 30-35 y/o tend to spend more money for their food.
  Cook or buy? Most of our respondents prefer buying to cooking their food (75.77%). You may see the more detail answer regarding this fact in our xls file.
  How about their consumption for entertainment? We found no significant high tendency answer in this question, but the highest answer is our respondents want to spend IDR 100,000-200,000 for entertainment (28.12%).
 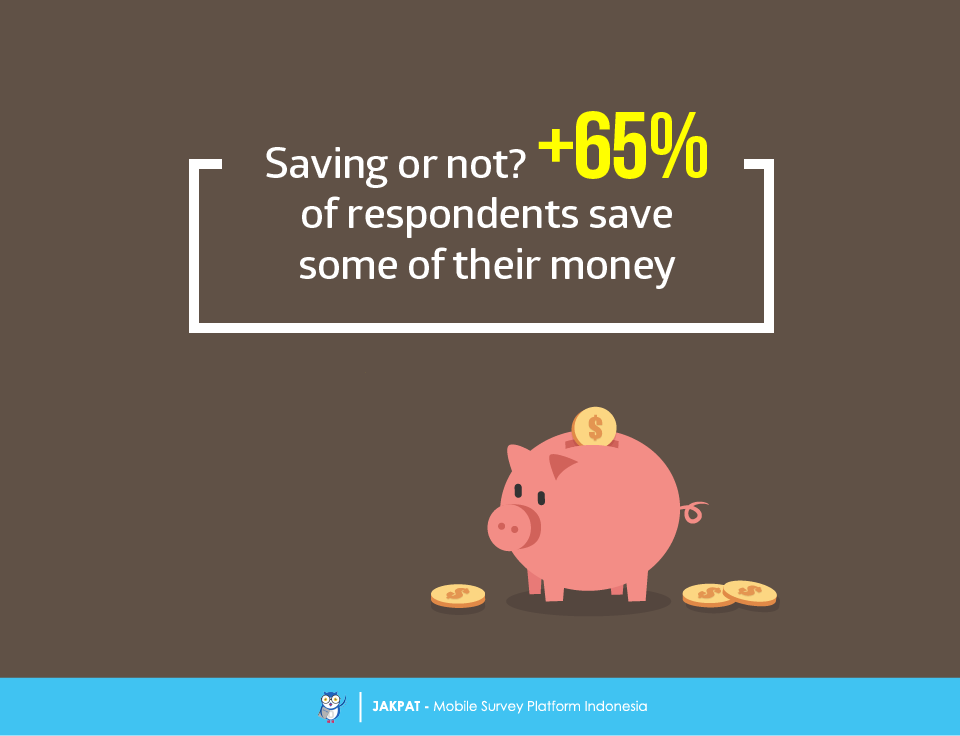 Do our respondents save some of their money? Majority of our respondents save some of their money monthly (69.33%). Those respondents answering not saving are mostly respondents who are <16 years old.
 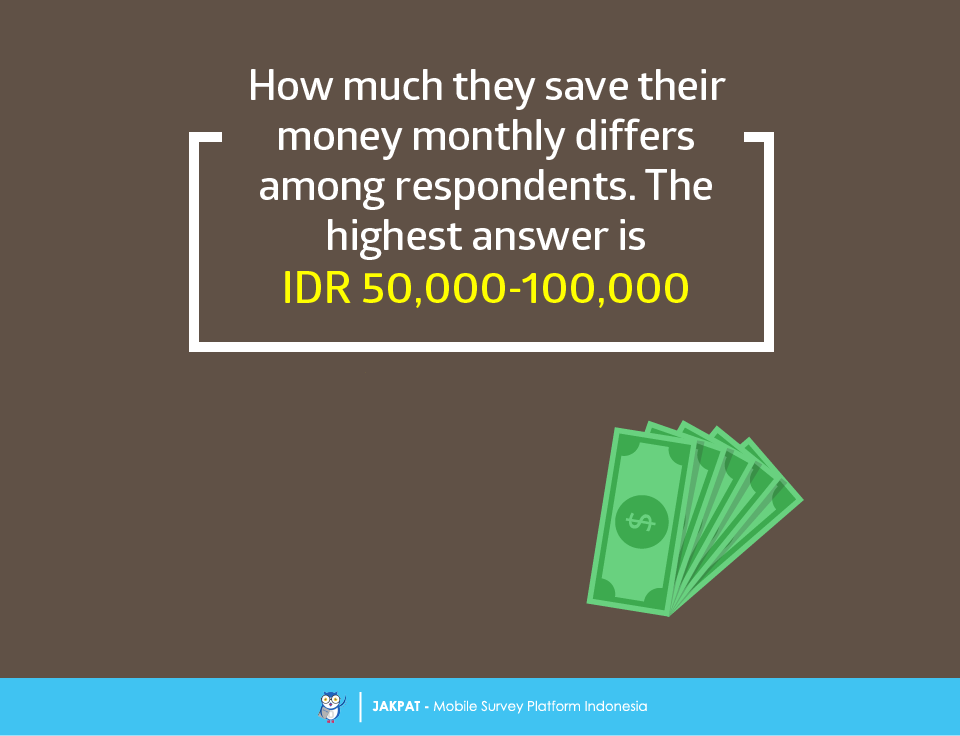 How much do they save monthly their money? We found no significant high tendency answer in this question, but the highest percentage is from IDR 50,000 to IDR 100,000 (25.37%). Other respondents’ answer are scattered among other options. You may see the detail in our xls file.
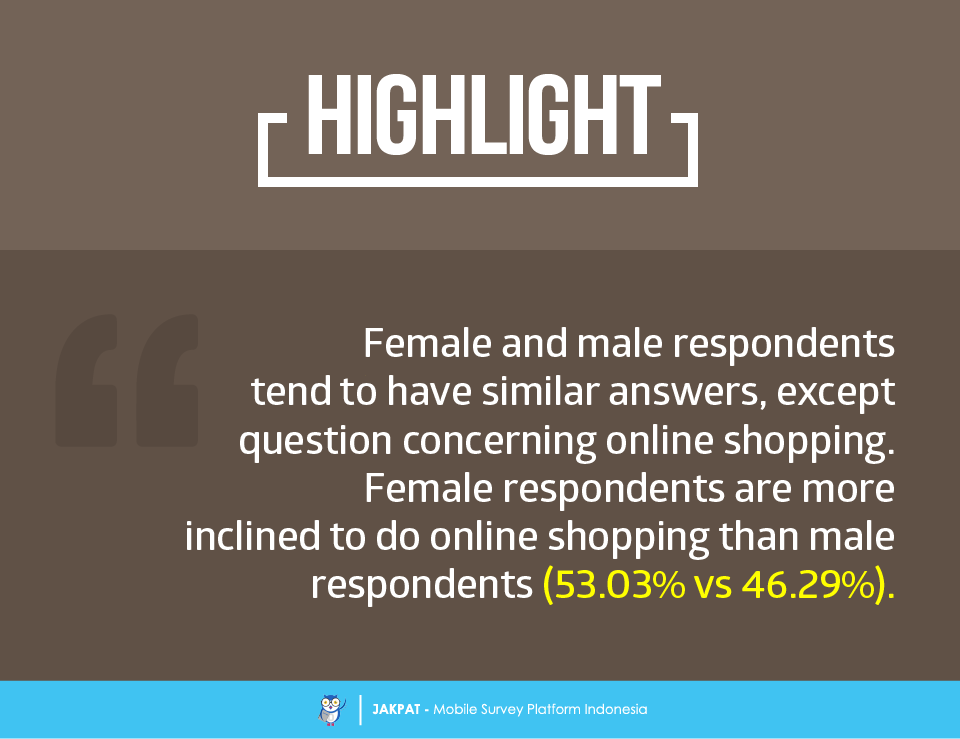
 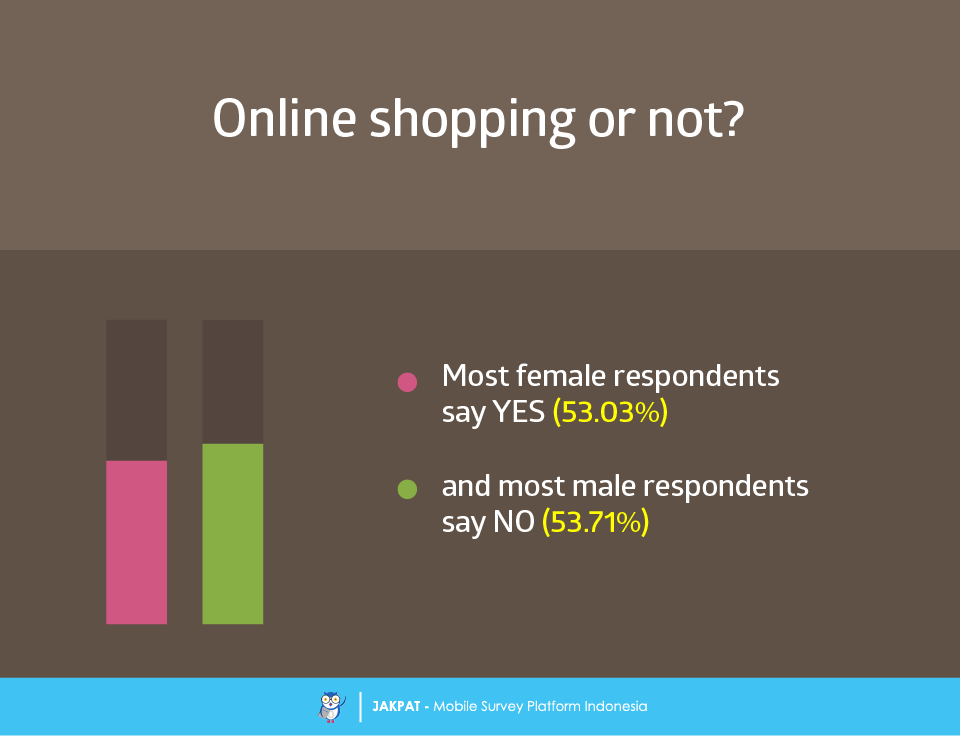 Yes or no for online shopping? Our female respondents say YES they do online shopping monthly (53.03%), but our male respondents say NO (53.71%). Yes, it turned out those female respondents in this survey like online shopping monthly.
 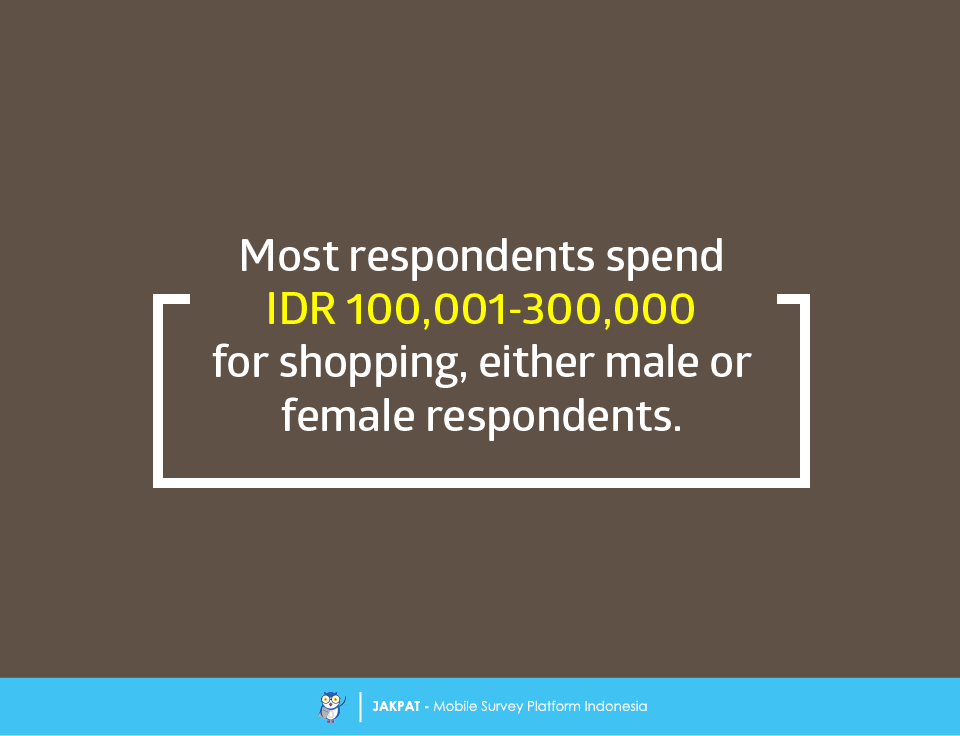 We also asked them concerning their monthly spending for shopping. It turned out that 48.87% of respondents spend IDR 100,001-300,000 for shopping monthly.
  We also wondered what vehicle they use everyday, thus we asked them this question. It turned out that motorcycle is the highest answer choosen by our respondents (68.81%). If you download our xls file, you can see that most of respondents who are <16 y/o use public transportation in their everyday life. For more detail you can download XLS report at the button below (bahasa). JAKPAT report consists of 3 parts which are 1) Respondent Profile, 2) Crosstabulation for each question and 3) Raw Data. Respondent profile shows you demographic profiles ( gender,age range, location by province, and monthly spending). Cross tabulation enables you to define different demographic segment preference on each answer.
![]()
You can also download PDF here:
![]()

or Get A Sales Quote by filling this form or Call to +622745015293
