

Donut is one of Indonesian’s favorite snacks. Derived from the word “doughnut”, donut is a type of fried dough confectionery or dessert food. Donut is popular in many countries, including Indonesia of course, and prepared in various forms as a sweet snack that can be homemade or purchased in bakeries, supermarkets, food stalls, and franchised specialty outlets.* In Indonesia, the donut’s market is dominated by two franchised outlets: Dunkin’ Donuts and J.CO Donuts. It is interesting to see how Indonesian’s preferences toward those two outlets, since one of them is an American company and has been the market leader for years, while the other one is Indonesian and has become the fastest growing chain in the country. Regarding to that matter, Jakpat recently conducted a survey involving 386 respondents with a range of age from 16 to 40 year-old. Those respondents are currently living in 10 big cities of Indonesia, including Jakarta, Bandung, Semarang, Surabaya, Bali, Medan, Balikpapan, Makassar, Lombok, and Yogyakarta.
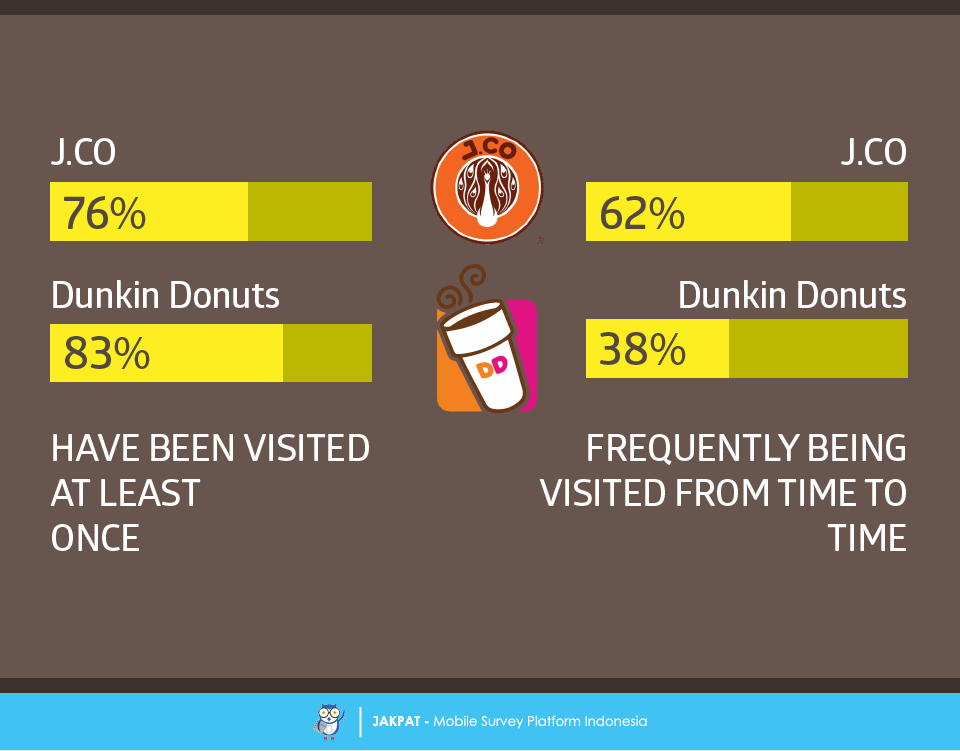
This survey begins with Indonesian’s awareness level toward both of Dunkin’s Donuts and J.CO Donuts. Apparently, Dunkin’ still has higher awareness level than J.CO (95% VS 88%), perhaps because Dunkin’ as the brand has been established way earlier than J.CO. Next, regarding to the frequent of being visited, there are more people who have been to Dunkin’ than J.CO at least once (83% VS 76%). On the other hand, when we were asking them which donuts outlets they frequently visited, it turns out they chose J.CO than Dunkin’ (62% VS 38%).
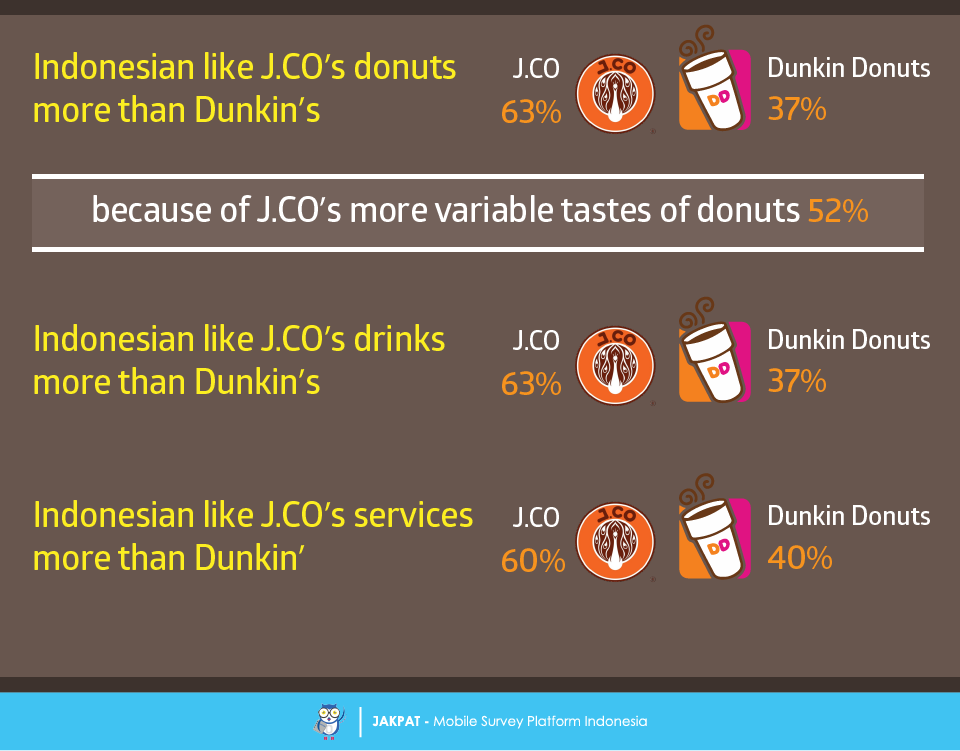
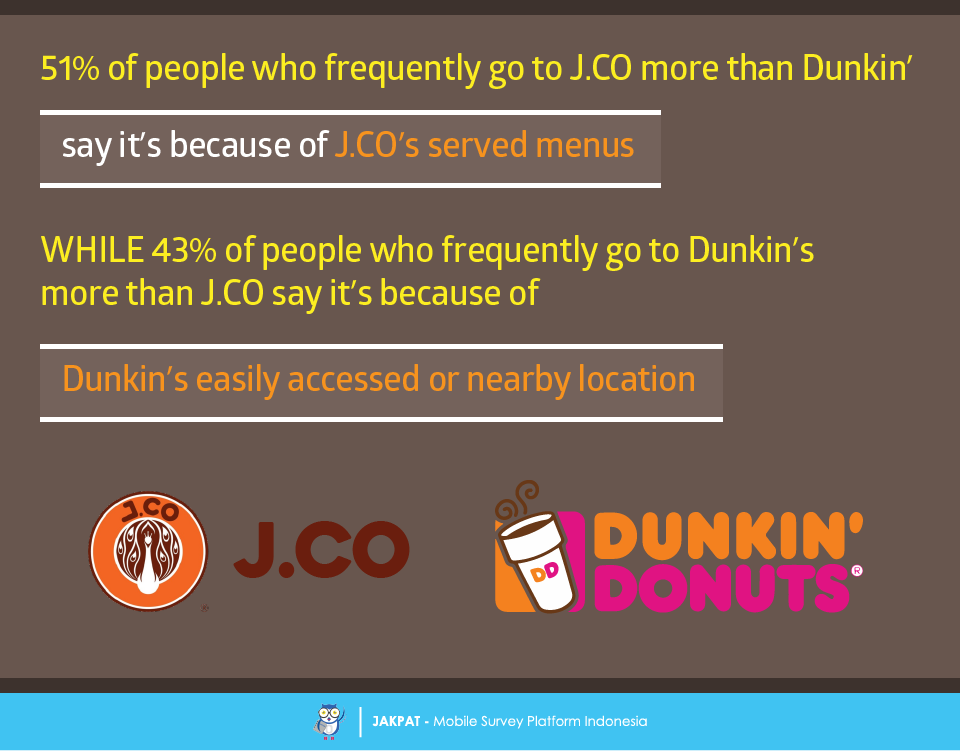
Furthermore, in regards on the flavor, we found that Indonesian prefer J.CO’s donuts rather than Dunkin’s (63% VS 37%). More than half of them who prefer J.CO (52%) said that the reason why they like J.CO’s donuts more than Dunkin’s is because J.CO’s donuts flavor varies more than Dunkin’s. Besides selling donuts as their main menu, as we all know both of Dunkin’ and J.CO also sell kinds of drink and beverages as their supporting menu. Regards on the matter of beverages, we found that J.CO beverages is more preferable than Dunkin’s (63% VS 37%). Meanwhile, on the services provided by the outlets’ waiters and waitresses, apparently J.CO service is more preferable than Dunkin’ (60% VS 40%). Henceforth, we found that J.CO slightly more preferable in terms of frequent visits than Dunkin’ by 51%, because they said that J.CO menus are more interesting and attractive toward their appetites than Dunkin’s. On the other hand, 43% of our respondents who prefer Dunkin’ are based on the notion that Dunkin outlets locations are more accessible than J.CO’s.
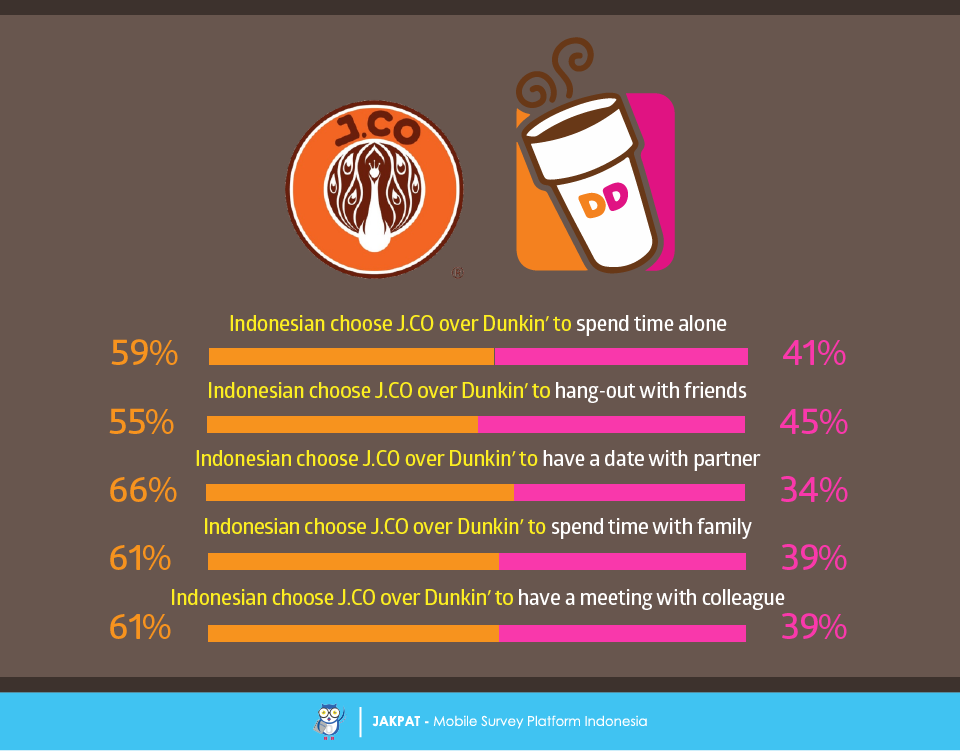
Going to donut outlets is based on the culture of modern and dynamic lifestyle of our society. Practically, it also means that the activities of going to this place are a way to contact and expand your business and social network. Based on that reality, we tried to take a look on the consumers’ preferences in terms of activities and habits while they were there. We found that consumers prefer J.CO over Dunkin’ by 59% VS 41% to spend their time alone while visiting these outlets. On the other hand, our respondents prefer J.CO over Dunkin’ in regards of hanging out with friends activity by 55% VS 45%. On the subject of romantic appointments, J.CO is more preferable than Dunkin’ by 66% VS 34%. Spending time with family, our respondents prefer J.CO than Dunkin’ by 61% VS 39%. While having a meeting with colleagues, J.CO is more preferable than Dunkin’ by 61% VS 39%.
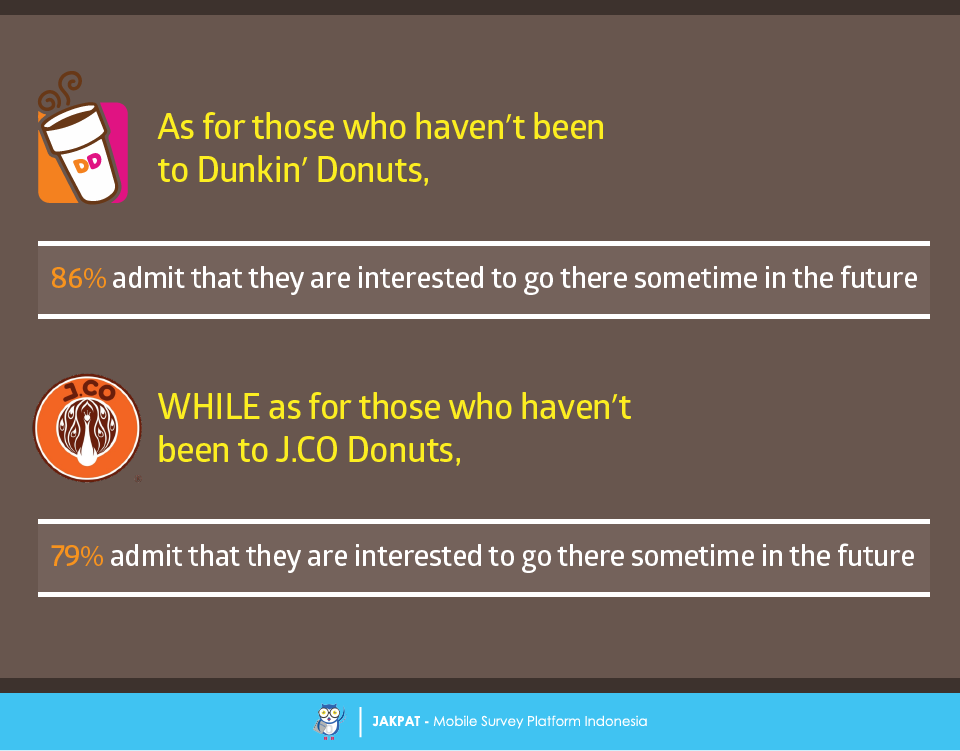
Lastly, we asked those people who haven’t been to either Dunkin’ or J.CO. As for those who haven’t been to Dunkin’ Donuts, most of them (86%) admit that they are interested to go there sometime in the future. Meanwhile, as for those who haven’t been to J.CO Donuts, there are 79% of them who admit that they are interested to go there sometime in the future.
*source: https://en.wikipedia.org/wiki/Doughnut
For more detail you can download XLS report at the button below (bahasa). JAKPAT report consists of 3 parts which are 1) Respondent Profile, 2) Crosstabulation for each question and 3) Raw Data. Respondent profile shows you demographic profiles ( gender,age range, location by province, and monthly spending). Cross tabulation enables you to define different demographic segment preference on each answer.
![]()
You can also download PDF here:
![]()

or Get A Sales Quote by filling this form or Call to +622745015293

awareness level dunkin and jco terbalik kayanya, yg bener infographicnya atau artikel?
Wah, iya, Yang benar artikelnya. Infographicnya keliru. Maaf, akan segera diperbaiki. Terima kasih banyak atas perhatiannya.