

Automotive industry wins a big market in Indonesia. The rising economic rate, the growth of middle class society, and the increasing buying power from millennials segment encourage the expansion of this industry within the last decade. This condition is even more dynamic due to the various payment scheme offered by the corporation and leasing such as low rate of interest and relatively low-cost down payment. Among all kind of personally owned vehicles, motorbike and car becomes two most prominent types which significantly increase every year. However, although motorbike industry seems to be the most significantly increasing category, but car industry could not be underestimated as well.
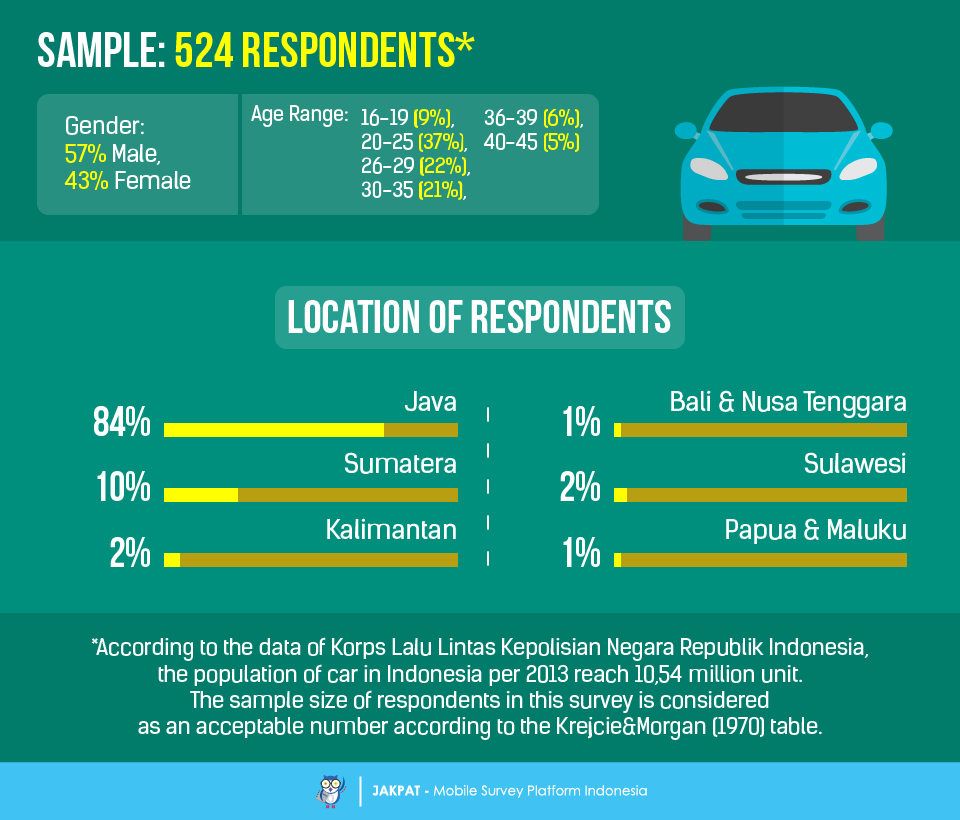
We conduct a survey to our 524 panel of respondents in nationwide to map their profile as car owner. According to the data of Korlantas Polri, up to 2013 the total population of car vehicle in Indonesia has been reaching 10.54 million. Therefore, our sample size is considered as an acceptable number based on Krejcie and Morgan (1970) table of sample size guidance.
The highlights of our findings in this survey are mostly related to the difference profile of female and male respondents, as well as the older and younger respondents. For female respondents in this survey, the influence of spouse and parents on their car purchasing experience is very high. The same finding also be found on the younger respondents in this survey whose age were under 19 years old.
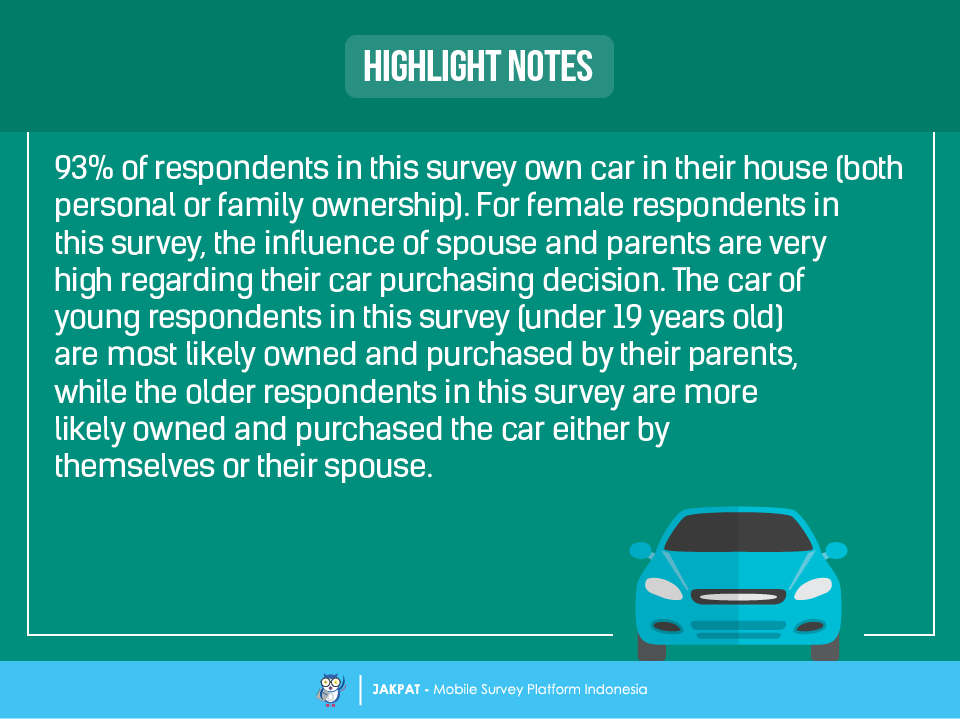
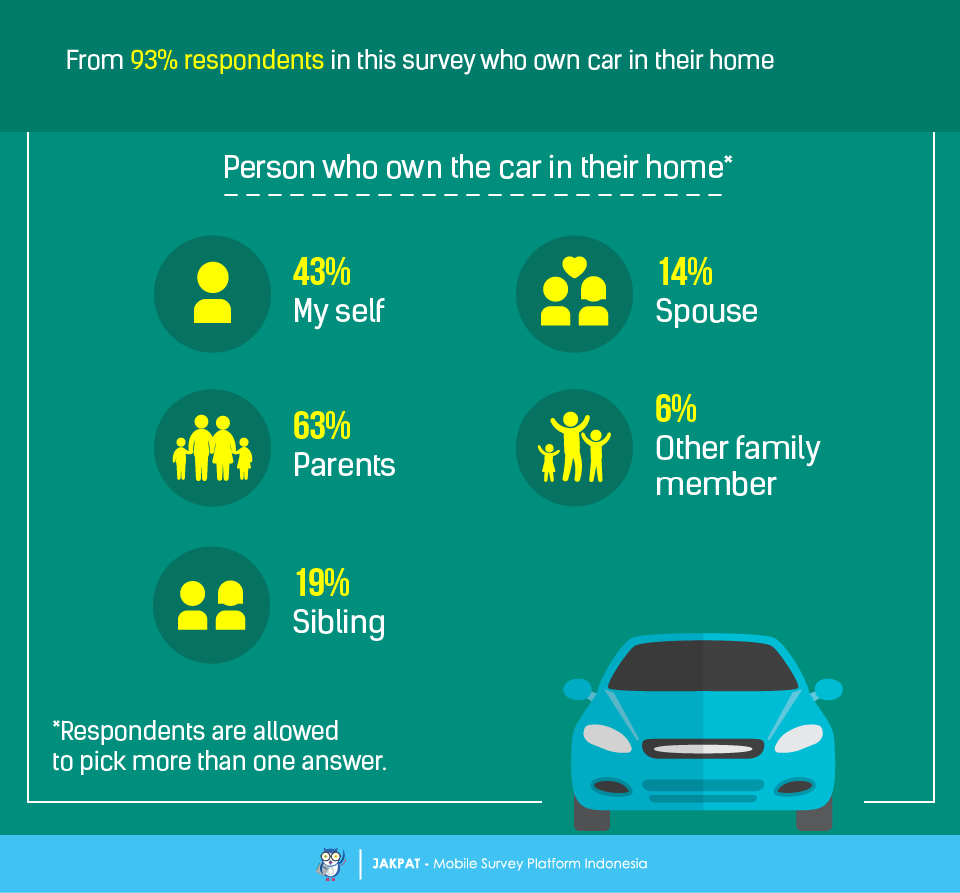
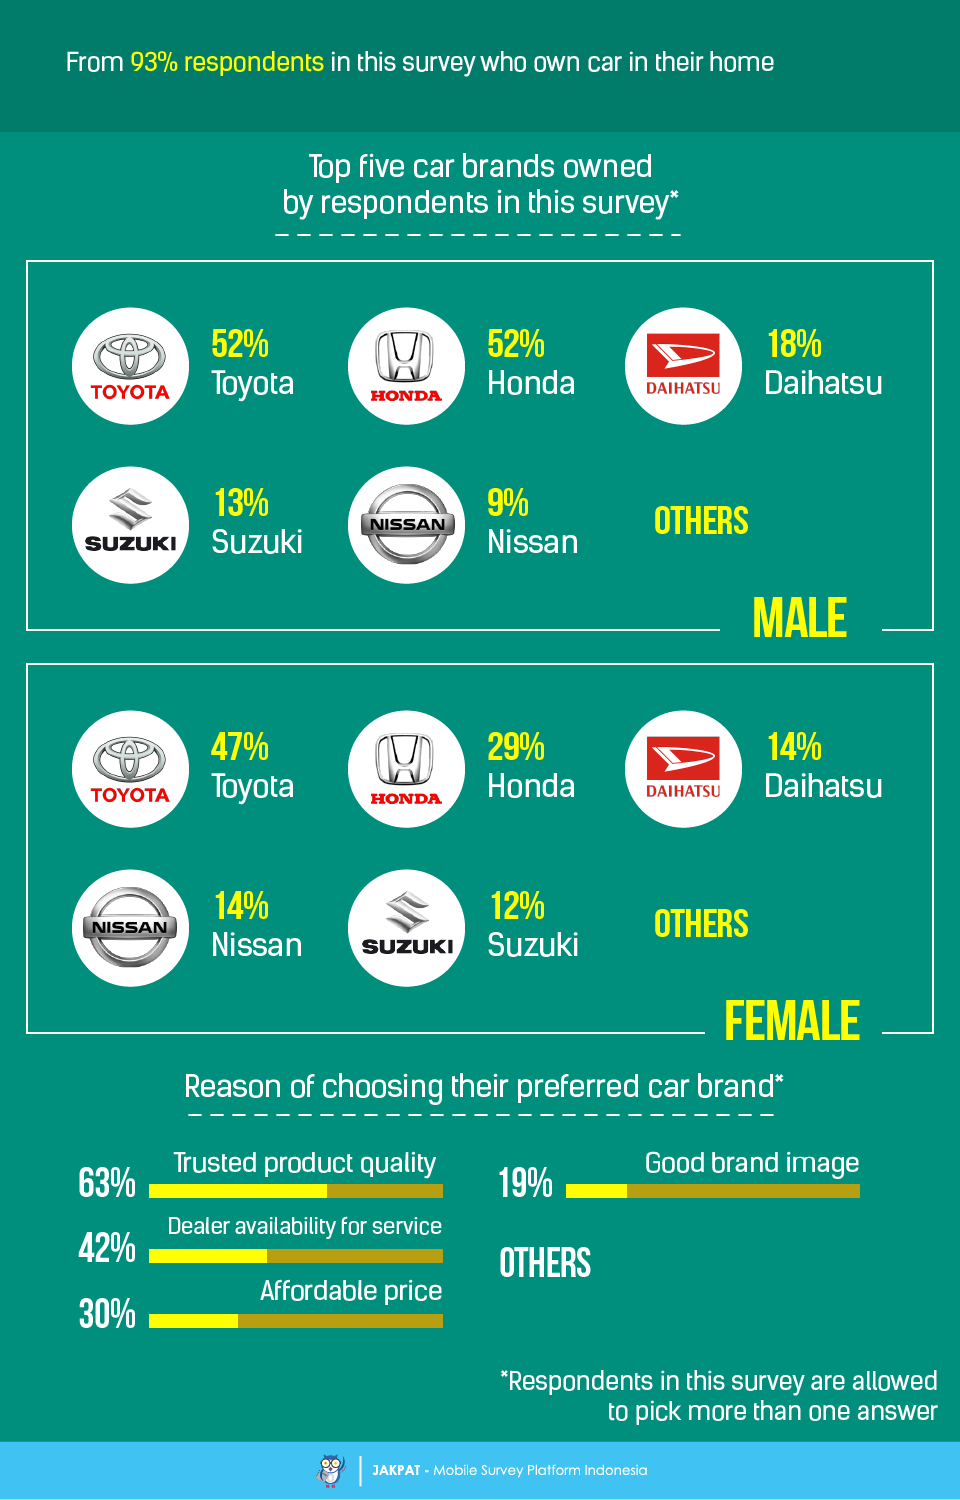
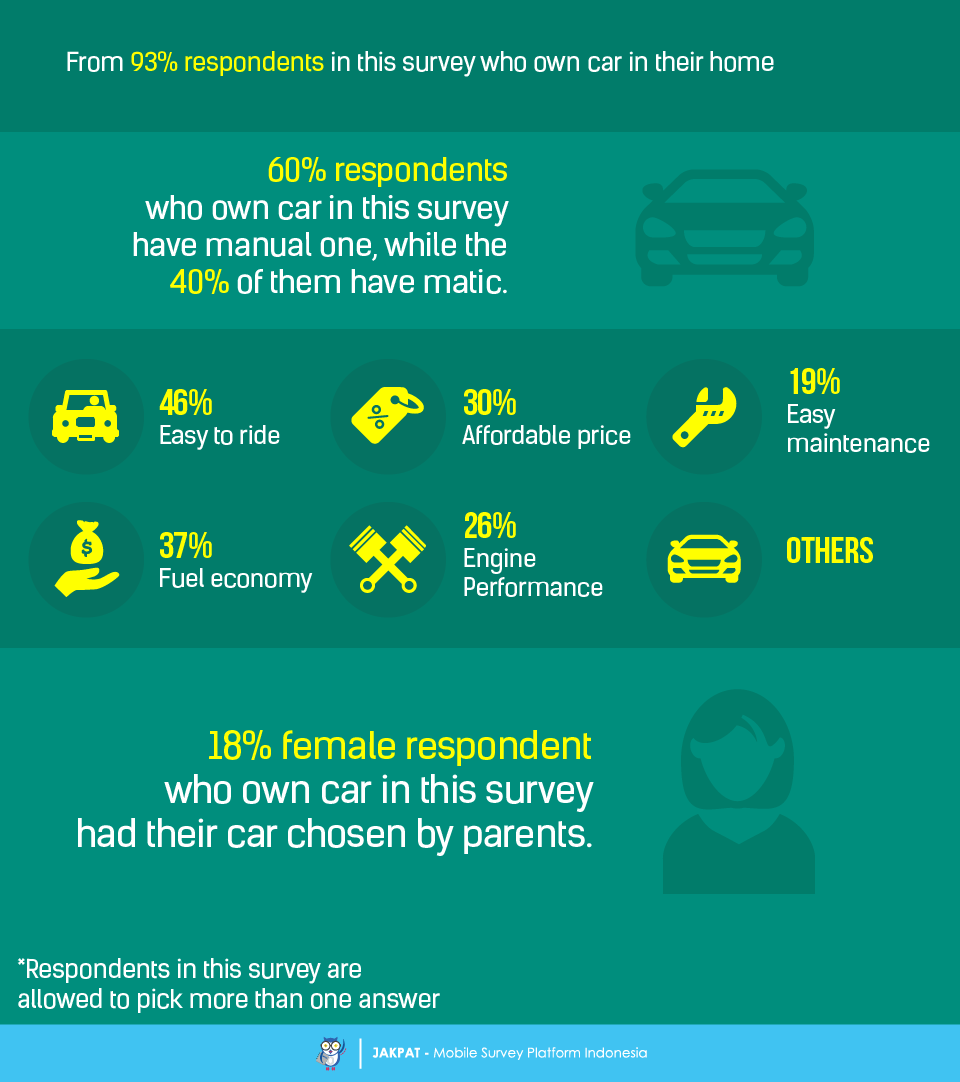
For the first step of this survey, we filter our respondents based on their car ownership in their house. According to our data, 93% of respondents in this survey own car in their home. Moreover, the owner of the car in their house is displayed in the image below.
From 93% respondents in this survey, we further ask them to mention their owned car brand. In general, five car brands are mentioned by most respondents in this survey such as Toyota, Honda, Daihatsu, Suzuki, and Nissan. Furthermore, regarding the reason of choosing their preferred car brand, most respondents in this survey tend to emphasize on their trust of product quality and after sales service aspect.
Comparing the manual and matic car product, most respondents in this survey tend to own the manual one. However, we also find that few female respondents in this survey who own car tend to have their car chosen by parents. Although the number of female respondents who have the condition is relatively lower than the overall respondents, but compared to the male respondent, their number is relatively much higher.
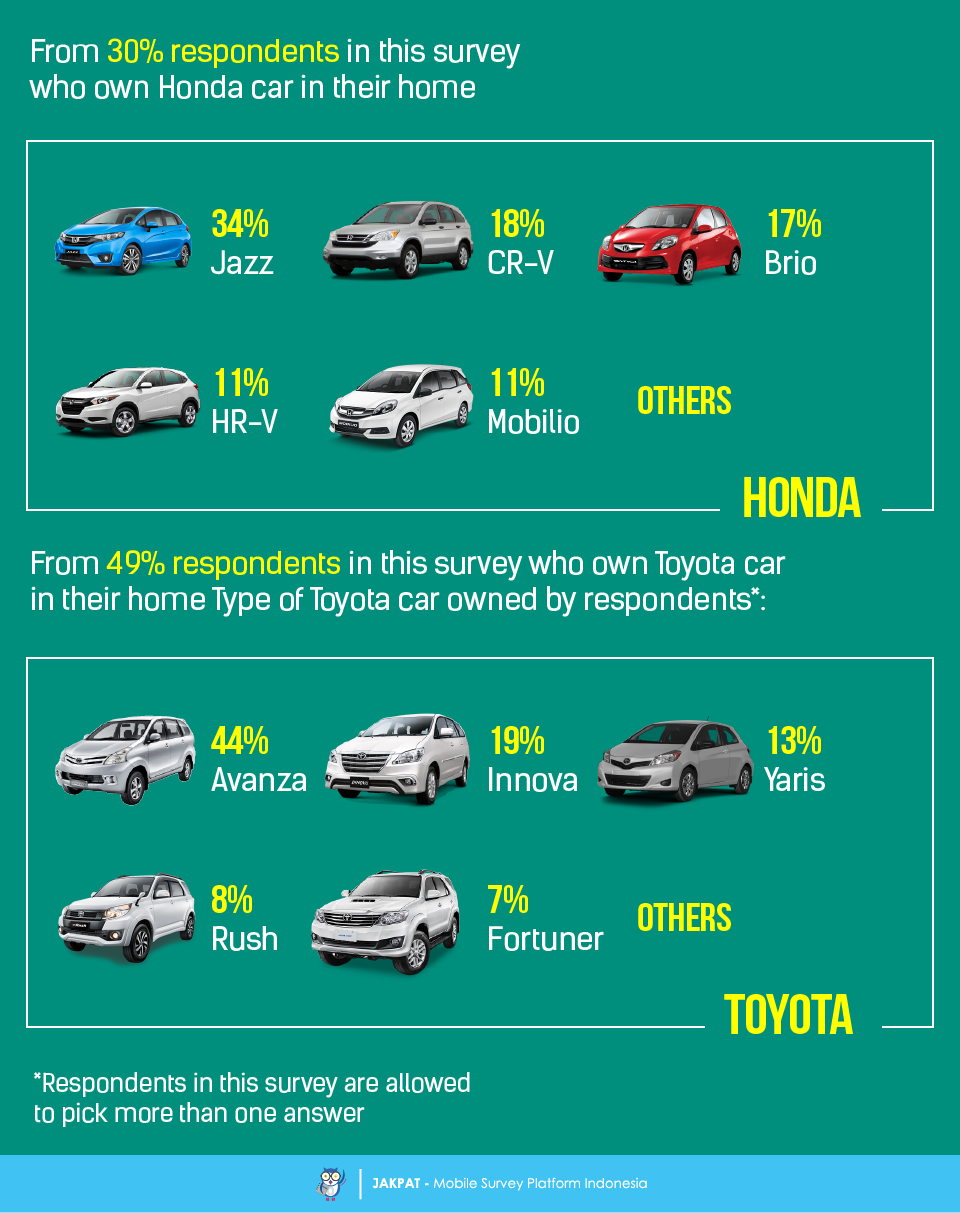
We track down the detail of our respondents in this survey based on their preferred car brand they own in their home. Below we provide several types of top five car brands owned by respondents in this survey.
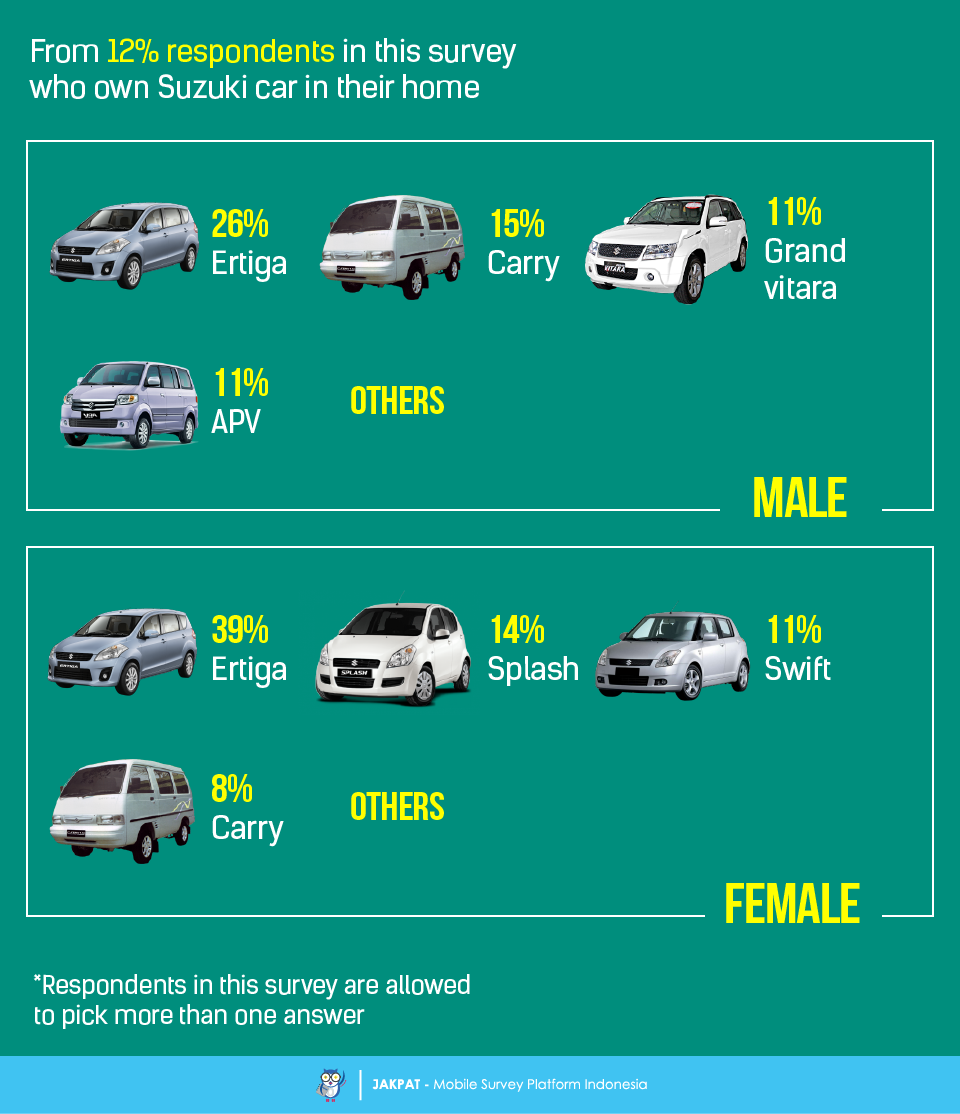
From 12% respondents in this survey who own Suzuki car in their home, the types of mostly owned car by them.
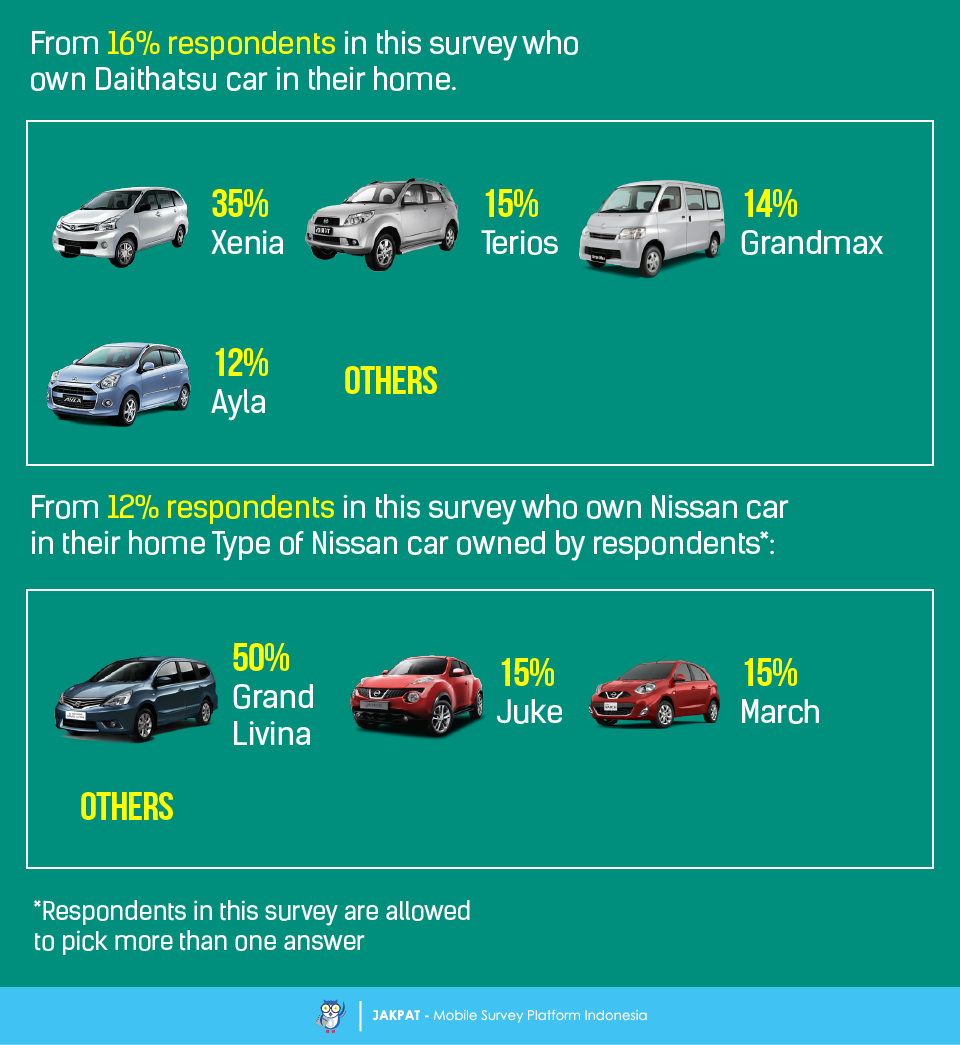
The type of Daihatsu and Nissan car owned by respondents in this survey.
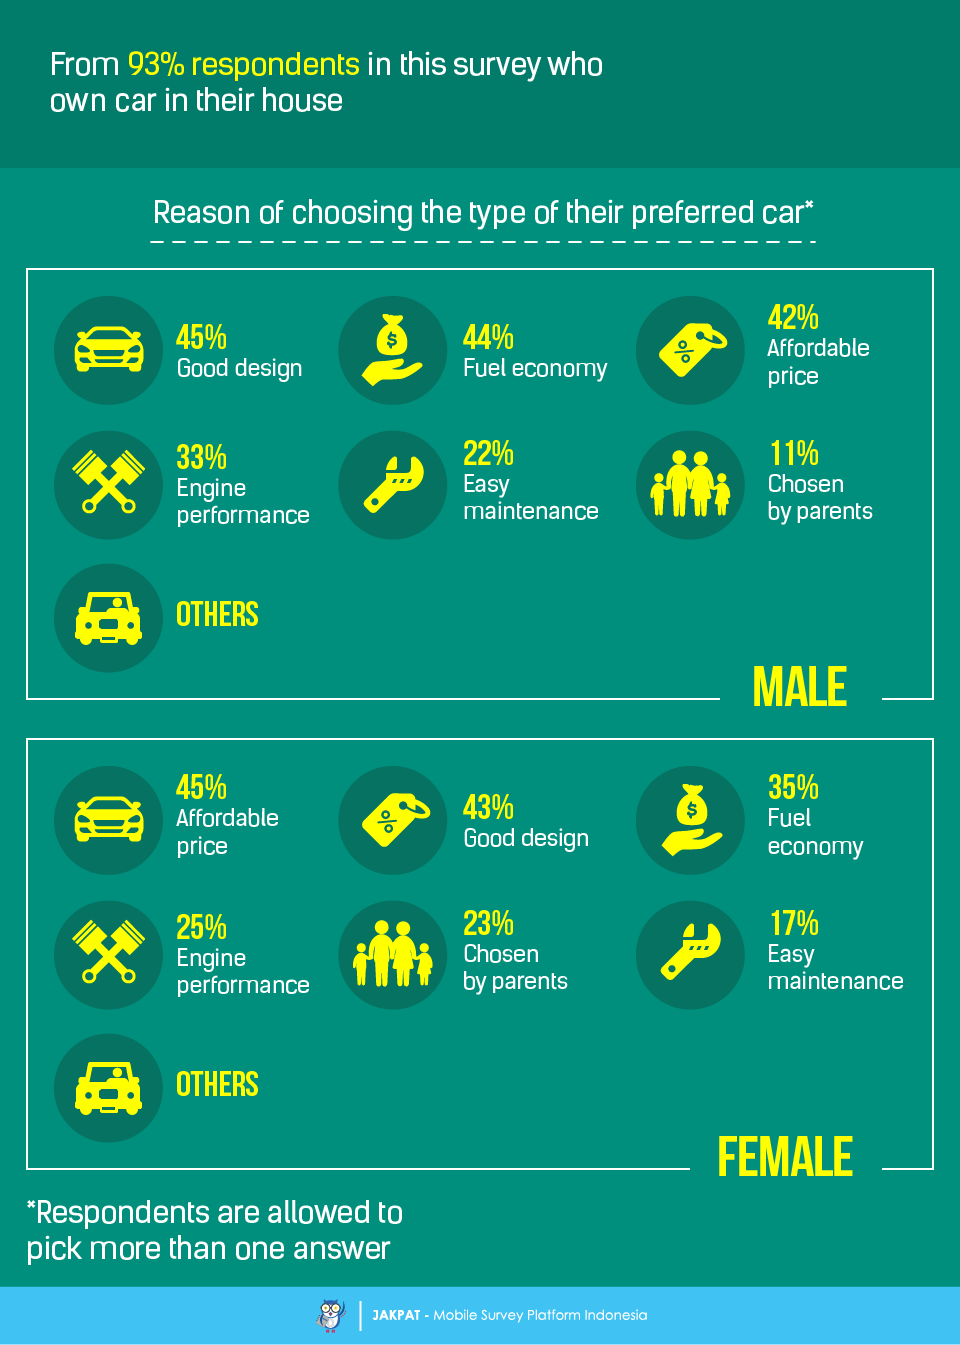
We further try to understand the reason of respondents’ preference on choosing the type of their preferred car. Apparently, the reason behind purchasing decision between the male and female respondents in this survey is different. The male respondents tend to emphasis on the design, fuel economy, and product price at the first place. In other hand, the female respondents in this survey tend to emphasis otherwise.
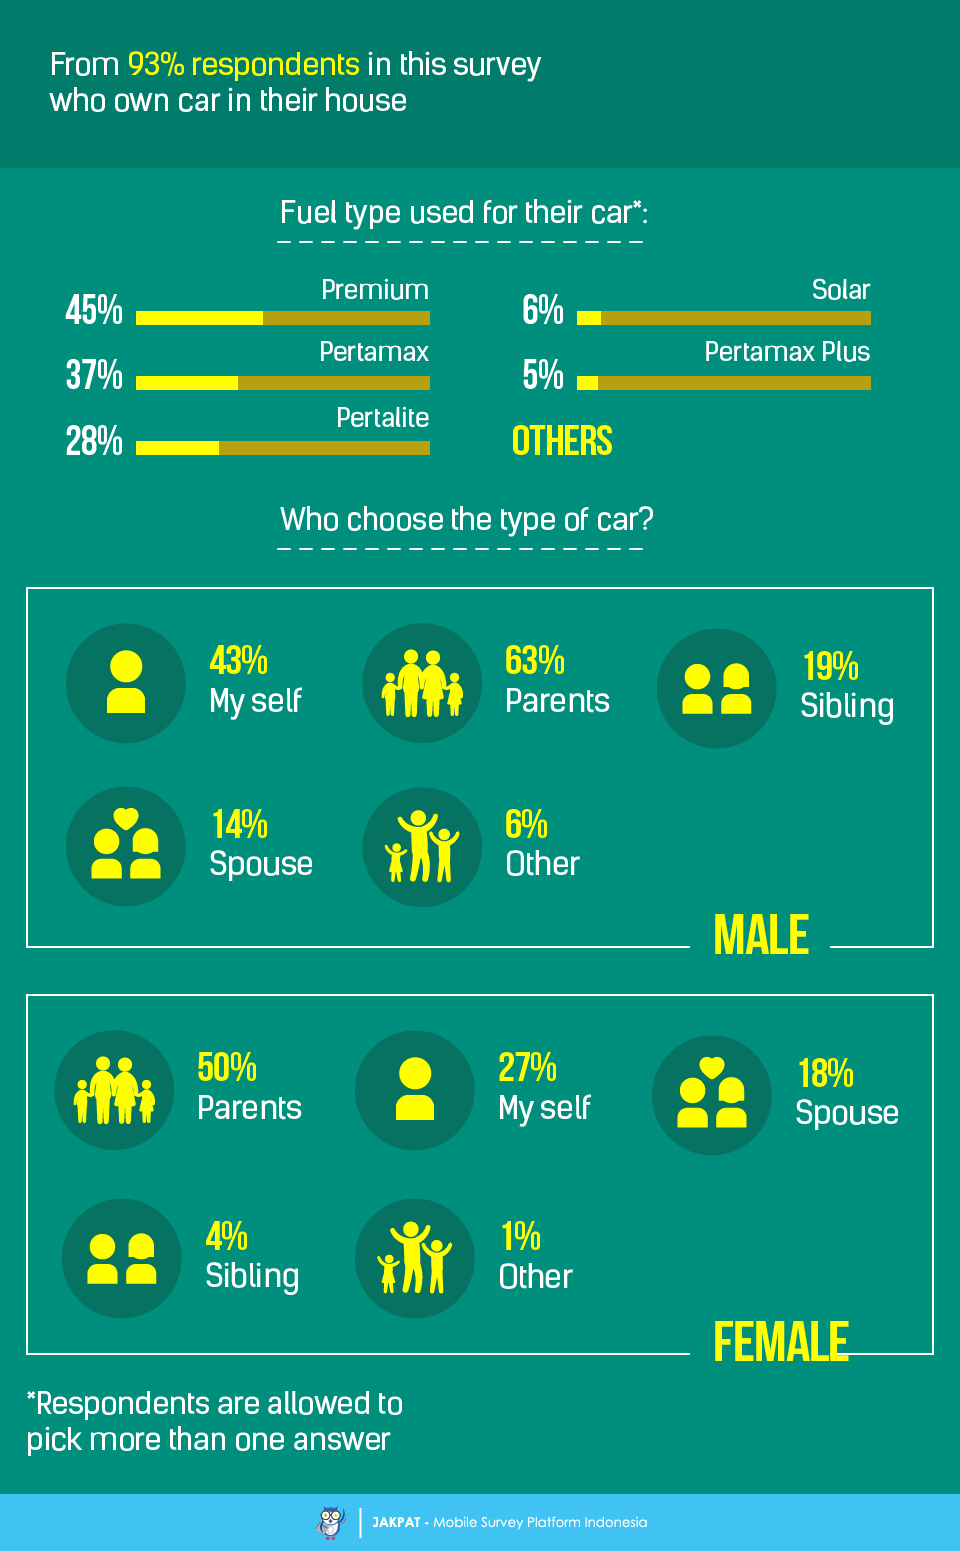
Regarding the fuel consumption for their car, most respondents who own car in this survey tend to use Premium and Pertamax. Moreover, the difference between our male and female respondents is shown as well regarding the person who chooses the type of car they bought.
At last, we would like to discover the purchasing information from our 93% respondents in this survey who own car in their house. Parents tend to be the funding source to buy the car. Moreover, regarding the payment method used by respondents, most female respondents in this survey tend to use credit instalment, while the male respondents tend to pay cash. Finally, although right now most of our respondents in this survey already own car in their home, but they expect to change or switch their car into another type or brand in the next two years.

For more detail you can download XLS report at the button below (bahasa). JAKPAT report consists of 3 parts which are 1) Respondent Profile, 2) Crosstabulation for each question and 3) Raw Data. Respondent profile shows you demographic profiles ( gender,age range, location by province, and monthly spending). Cross tabulation enables you to define different demographic segment preference on each answer.
![]()
You can also download PDF here:
![]()

or Get A Sales Quote by filling this form or Call to +622745015293
