


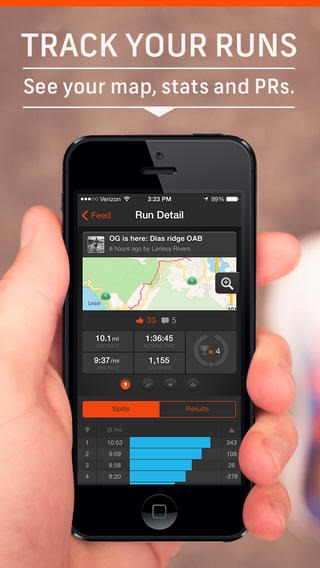
Jogging, running, riding bicycle, fitness what do you often to do for exercise? Now you can do exercise with your smartphone by using exercise assistance app in your smartphone. So, you do not have to go to gym center or fitness center. As we can find in app store or google play store there are several exercise assistance app can be installed to help you doing exercise such as Endomondo, Nike Running++, Yoga and Ocd. These apps can help you doing your exercise anytime and anywhere.
 Here JAKPAT conducted a survey concerning Indonesians’ opinion about exercise assistance app in their smartphone. This survey is followed by 166 respondents having exercise assistance app in their smartphones. Those 166 respondents are gathered from 515 respondents JAKPAT, we asked a screening question asking whether they ever install an exercise assistance app.
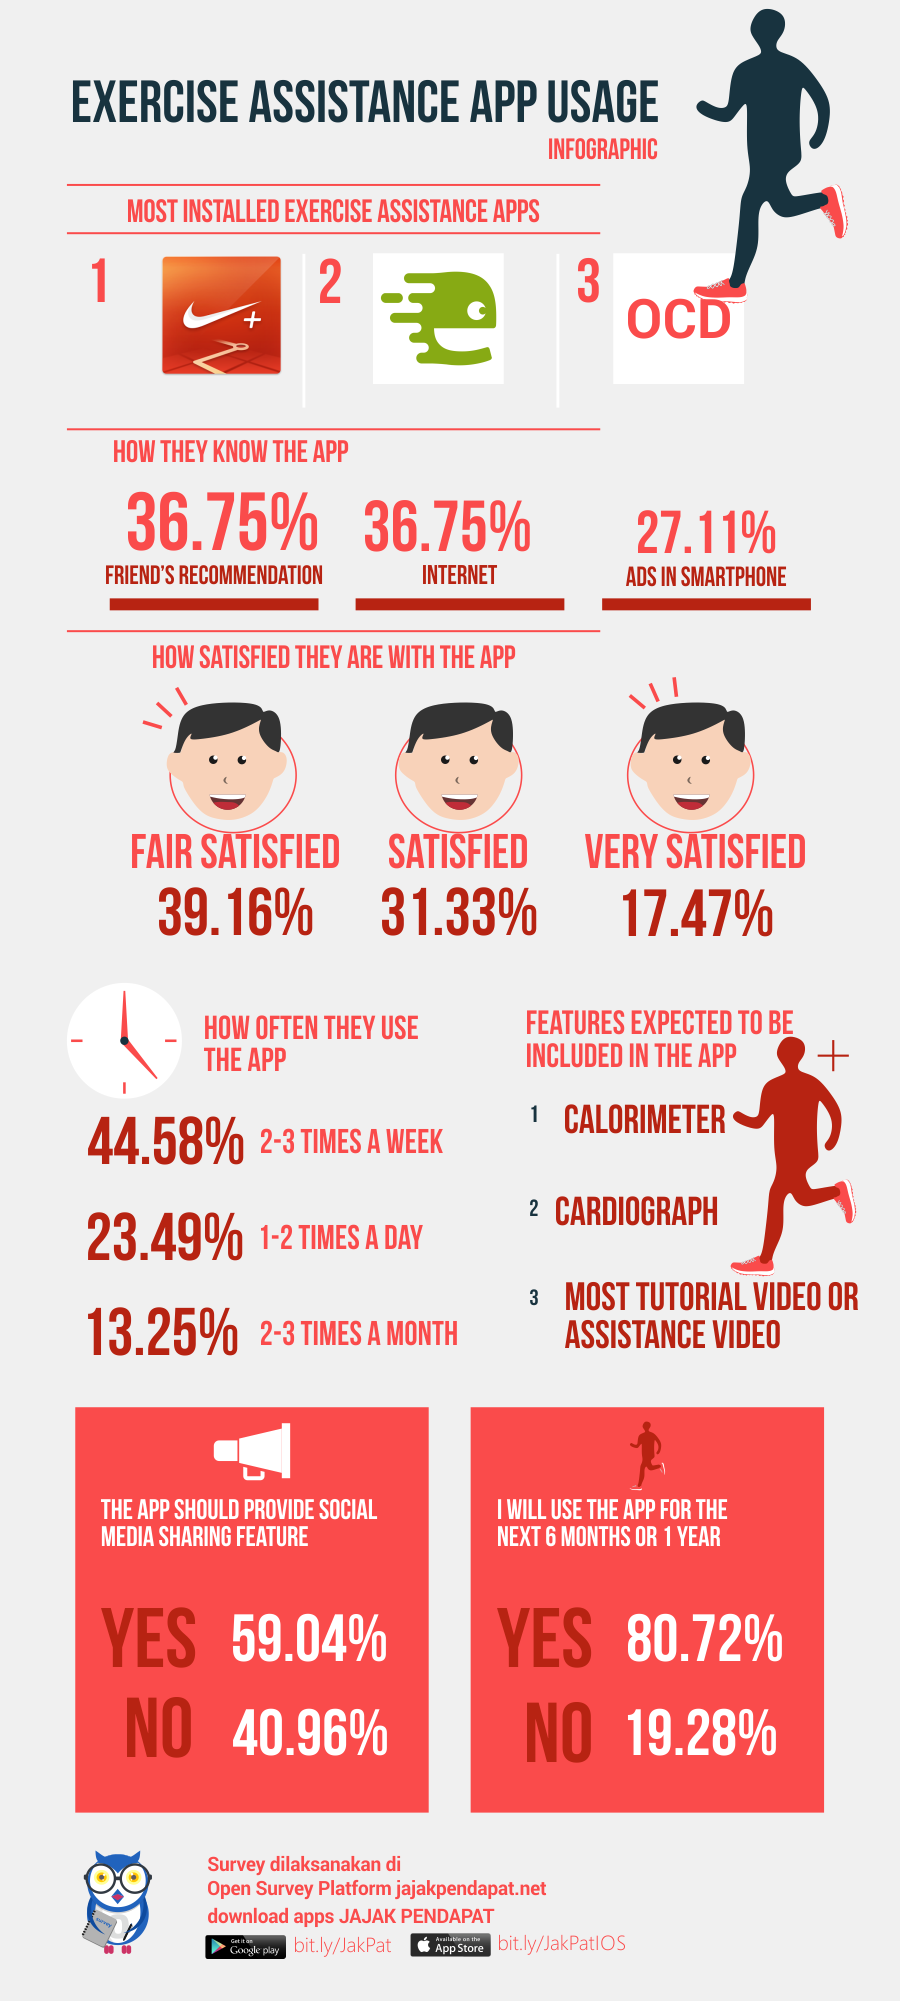
At first, we asked an open ended question to them about exercise assistance app that they installed in their smartphones. Most respondents answer that they installed Nike Running++ in their smartphones. Other apps that fair installed are OCD and Endomondo.
Most respondents browse the app in the internet and know it from their friends
Respondents know about the app because they browse the app in the internet (36.75%) and are informed by their friends (36.75%).
| Q3 (multiple answer) : how do you know about the app? | Total | Gender | |
| Male | Female | ||
| Option 1 : i know it from my friends | 61 | 44 | 17 |
| 36,75% | 26,51% | 10,24% | |
| Option 2 : i see it from an advertisement in my smartphone | 44 | 24 | 20 |
| 26,51% | 14,46% | 12,05% | |
| Option 3 : i browse the app in the internet | 61 | 44 | 17 |
| 36,75% | 26,51% | 10,24% | |
| Option 4 : i know it from my family | 3 | 1 | 2 |
| 1,81% | 0,60% | 1,20% | |
| Option 5 : it is a built-in app in my smartphone | 14 | 10 | 4 |
| 8,43% | 6,02% | 2,41% | |
| Option 6 : Other | 4 | 2 | 2 |
| 2,41% | 1,20% | 1,20% | |
| Total | 187 | 125 | 62 |
| 112,65% | 75,30% | 37,35% | |
The interesting facts that we found are: more respondents who are among 16 and 25 years old know about the app because they browse the app in the internet, and those who are among 26 and 35 years old know the app from their friends. Friends for those who are among 26 and 35 have great influence.
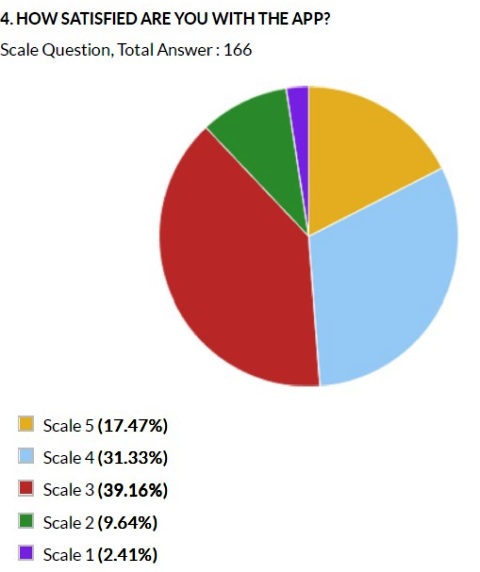
Then, when we asked about their opinion towards the app installed in their smartphones, most of them say that they are fair satisfied (39.16%, scale 3) from scale 1 to 5. Moreover, there is slight difference between those who are fair satisfied and satisfied. 31.33% of respondents are satisfied with the app and 17.47% of respondents are very satisfied.
45%+ respondents use the app 2-3 times a week
| Q5 (single answer) : how many times do you use the app to assist your exercise? | Total | Gender | |
| Male | Female | ||
| Option 1 : 1-2 times a day | 38 | 22 | 16 |
| 23,03% | 20,56% | 27,59% | |
| Option 2 : 2-3 times a week | 74 | 52 | 22 |
| 44,85% | 48,60% | 37,93% | |
| Option 3 : 4-5 times a week | 10 | 7 | 3 |
| 6,06% | 6,54% | 5,17% | |
| Option 4 : more than 5 times a week | 6 | 6 | 0 |
| 3,64% | 5,61% | 0,00% | |
| Option 5 : 2-3 times a month | 22 | 11 | 11 |
| 13,33% | 10,28% | 18,97% | |
| Option 6 : 4-5 times a month | 15 | 9 | 6 |
| 9,09% | 8,41% | 10,34% | |
| Total | 165 | 107 | 58 |
| 100,00% | 100,00% | 100,00% | |
When we asked about features that they expect to be included in the app, most of them want calorimeter to be included in the app. Other features that they also expect are: cardiograph and tutorial video or assistance video.
More than 50% of respondents need media social sharing
| Q7 (single answer) : do you prefer that the app can be shared with your social media account? | Total | Gender | |
| Male | Female | ||
| Option 1 : yes | 98 | 68 | 30 |
| 59,39% | 63,55% | 51,72% | |
| Option 2 : no | 67 | 39 | 28 |
| 40,61% | 36,45% | 48,28% | |
| Total | 165 | 107 | 58 |
| 100,00% | 100,00% | 100,00% | |
More than 80% of respondents are willing to use the app for the next 6 months or 1 year
| Q8 (single answer) : will you use the app for the next 6 month or 1 year? | Total | Gender | |
| Male | Female | ||
| Option 1 : yes | 134 | 86 | 48 |
| 81,21% | 80,37% | 82,76% | |
| Option 2 : no | 31 | 21 | 10 |
| 18,79% | 19,63% | 17,24% | |
| Total | 165 | 107 | 58 |
| 100,00% | 100,00% | 100,00% | |
For more detail you can download XLS report at the button below. AKPAT report consists of 3 parts which are 1) Respondent Profile, 2) Crosstabulation for each question and 3) Raw Data. Respondent profile shows you demographic profiles ( gendr,age range, locationby province, and monthly spending). Cross tabulation enables you to define different demographic segment preference on each answer.
![]()
Click the icon to download XLS report
And also PDF Report here:
If you’re interested to do survey on retail and consumer goods field toward our respondents, we have over 23,000 mobile respondents ranged from age 17-50 years old, smartphone active users, and located in all regions of Indonesia that has installed our app and readily answering your survey.
Those 23,000 respondents has been verified, profiled, and continuously tracked to make sure you get the updated profiles of them. Our respondents has been profiled based on their demographic (age,gender,location, spending level, profession,religion), lifestyle habit (smoking/non, gamers/non, wearing glasses/non, frequent flyer/non, online shopper/non), and also brand consumption level ( brand A users, brand B users in FMCG, Retail, E-commerce,etc).
If you want to do research toward our respondent, please signup here and directly create your survey there. Or directly contact our Bizdev - Chrisprastika at +62-878-3908-9833. To non-Indonesian client, we offer free translation from foreign languages includes English, Chinese,Hindi,etc.