

One of the needs that people have to fulfill for surviving is eating and drinking. These days the sources that provide people with food and beverage have gotten bigger in number and in variety. This survey was conducted in a purpose of finding out the pattern of grocery shopping for people who live in select big cities of Indonesia. Just over a thousand respondents were involved in this survey. Let’s dig in the results.
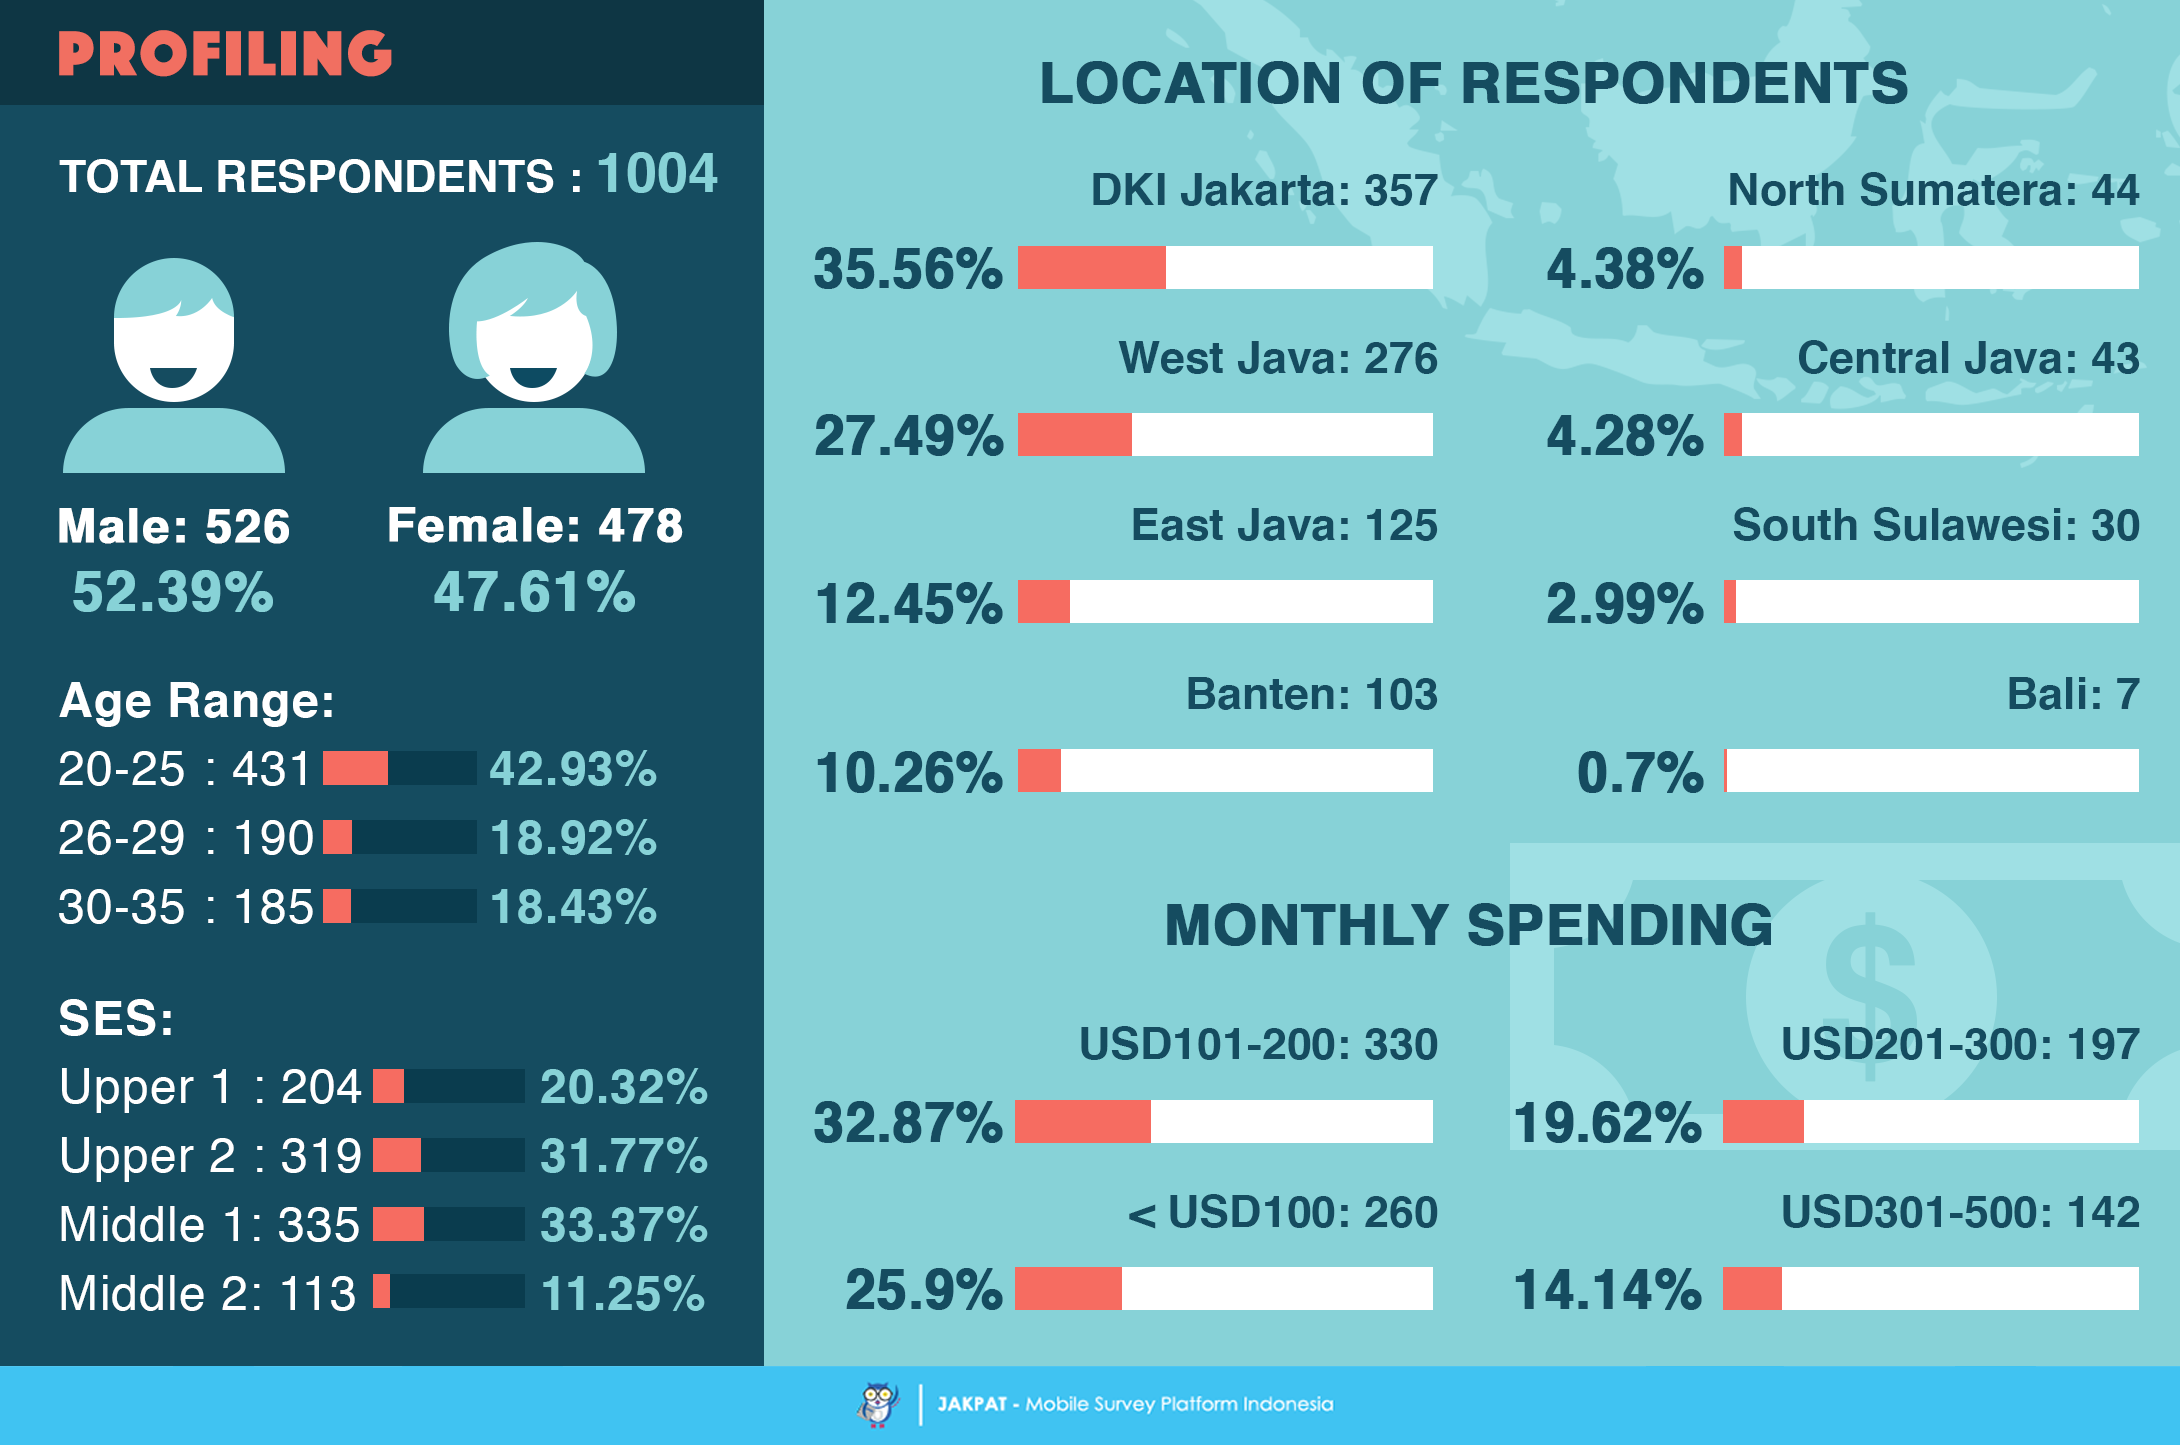
We managed to collect survey results from our respondents who live in provinces such as Special Region of Jakarta (357 respondents), West Java (276 respondents), East Java (125 respondents), Banten (103 respondents), North Sumatera (44 respondents), Central Java (43 respondents), South Sulawesi (30 respondents), Bali (19 respondents), and lastly East Kalimantan (7 respondents). In total we managed to collect 1004 respondents. For the rest of the respondents’ profile, you can see the infographic shown above.
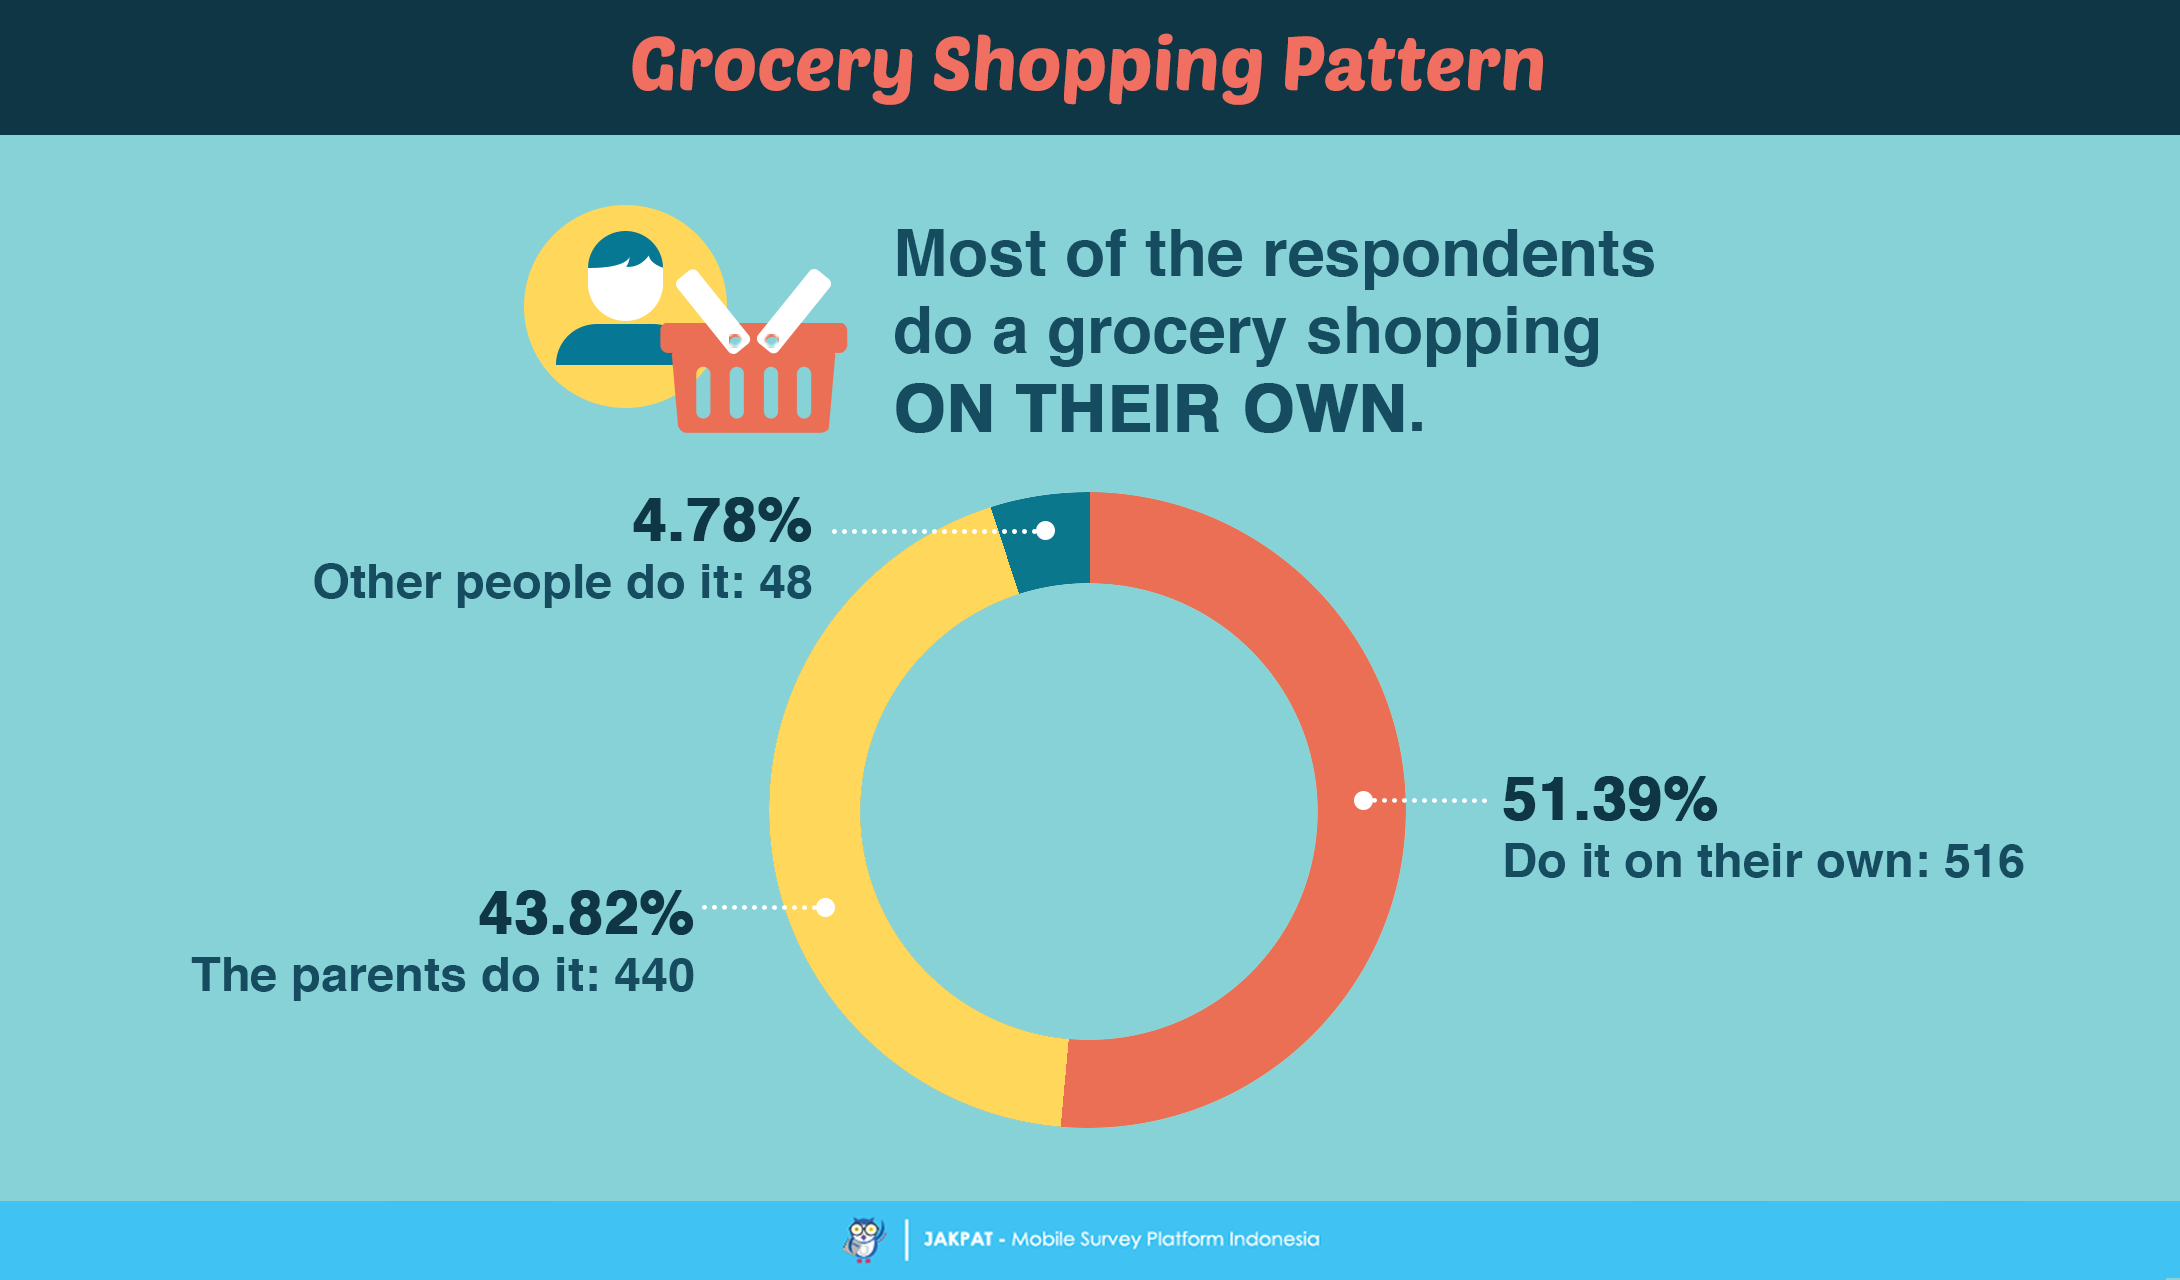
As you can see in the infographic, most of the respondents (51,39%) do their grocery shopping on their own. Some say their parents do the shopping (43.82%). Only 1.69% of respondents say that their household assistant do the grocery shopping.
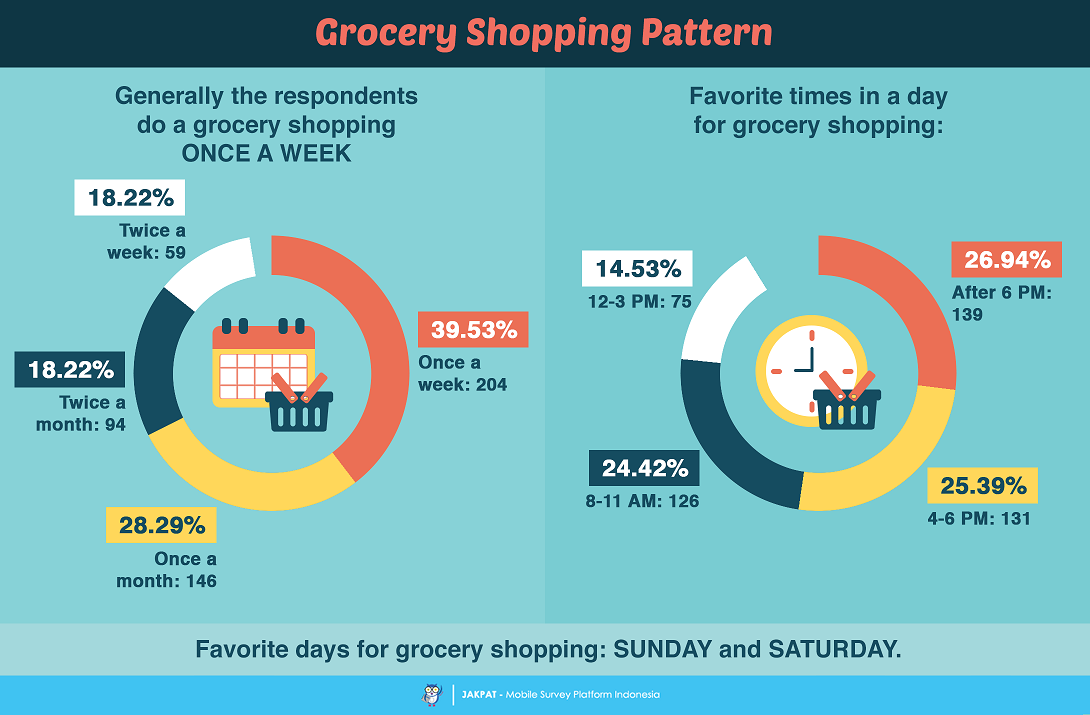
From now on we only focus on the respondents who do the grocery shopping on their own without the help from anybody. That should count the 516 respondents out of the 1004 respondents. We then asked those independent shoppers about the frequency of the grocery shopping. 39.53% of them say they do it once a week. That is the top answer. The other answers include once a month (28.29%), twice a month (18.22%), and twice a week (11.43%).
We also asked the same respondents what days of the week they usually go for a grocery shopping. Most respondents admit that they do the shopping on Sundays (40.12%). Other answers include on Saturdays (35.66%), Fridays (8.72%), Mondays (7.36%), Wednesdays (3.88%), Tuesdays (2.71%) and Thursdays (1.55%). That makes sense because Sunday is when most people don’t go to work or to school.
After we found what day in a week, we then later asked the respondents what time in a day they usually go for grocery shopping. The most frequent time of the day for grocery shopping, according to 26.94% of the respondents, is after 6PM. The other answers include 4-6PM (25.3%), 8-11AM (24.42%), 12-3PM (14.53%), and before 8AM (8.72%). The respondents seem to have time for grocery shopping after work or after school time.
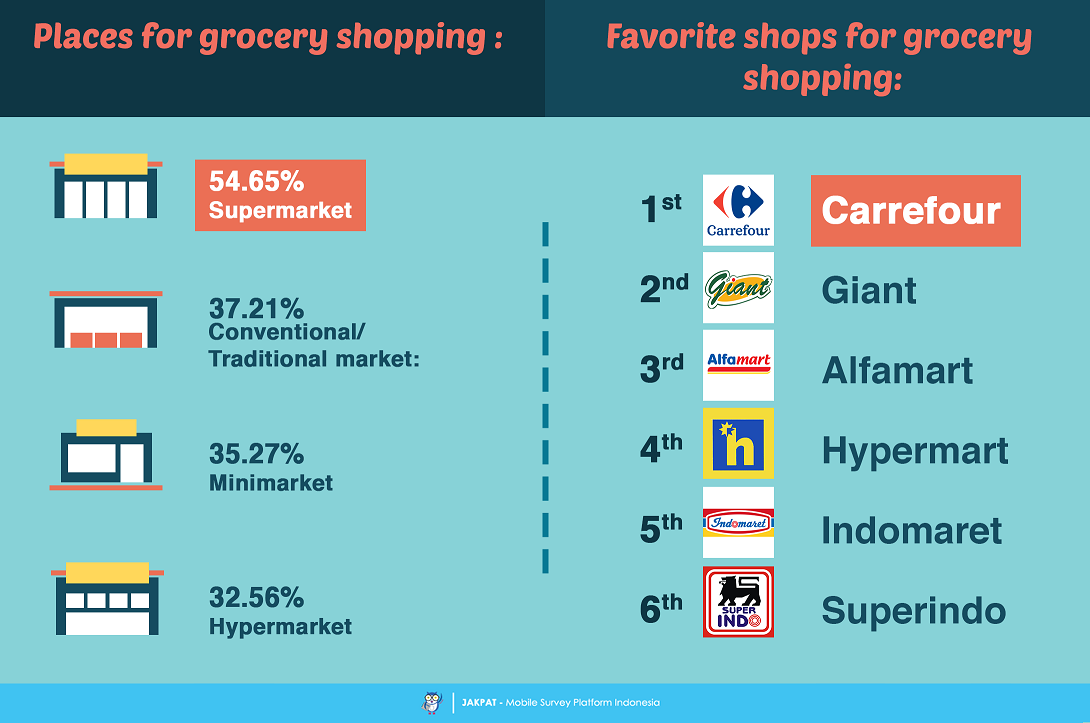
Now we are going to deliver information about where the independent respondents go for grocery shopping. Most of the respondents say that they go to the supermarket (54.65%) for grocery shopping. Other answers include the conventional market (37.21%), the minimarket (35.27%), the hypermarket (32.56%), and the stall (14.73%). As for the top places for grocery shopping include Carrefour being the number one favorite place, followed by Giant, Alfamart, Hypermart, Indomaret, Superindo and other more local-branded places.
Now we are going one by one place for grocery shopping to find out what our respondents tend to buy, from the number one item category that is most frequently purchased to the number ten item category that is least purchased.
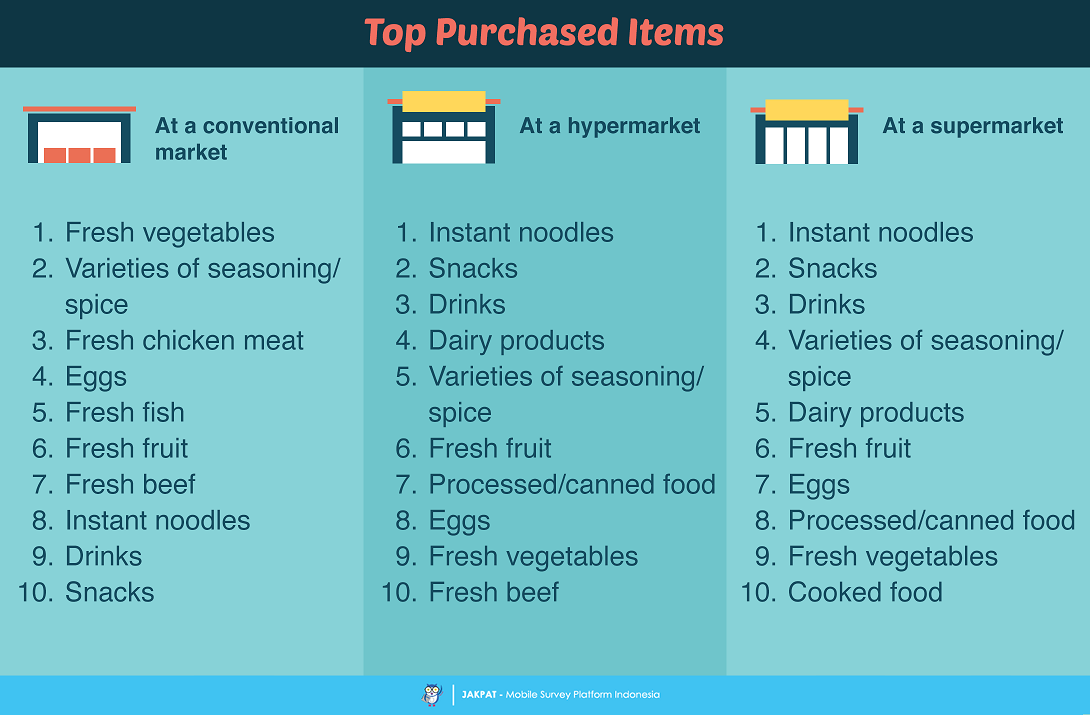
Conventional market. There is a reason why this type of market can also be called a wet market, for the items for sales tend to be newly fresh out of the harvested fields. From the total of 192 respondents who admit that they go to the conventional market for grocery shopping, here are the items that the respondents regularly purchase at a conventional market, from most to least popular: fresh vegetables (86.98%), varieties of seasoning or spice (72.4%), fresh chicken meat (67.71%), eggs (65.1%), fresh fish (64.06%), fresh fruits (52.6%), fresh beef (48.44%), instant noodles (21.88%), drinks (14.06%), snacks (13.54%), processed/canned food (10.94%), cooked food (10.94%), and dairy products (9.38%). In conclusion, the respondents tend to look to buy fresh vegetables, spices and fresh chicken meat at a conventional or traditional market.
Hypermarket. This type of market is likely to be large in size and people can buy the items in groups or packages instead of individually. From the total of 168 respondents who admit that they go to the hypermarket for grocery shopping, here are the times that our respondents regularly purchase at a hypermarket, from most to least popular: instant noodles (81.55%), snacks (70.83%), drinks (65.48%), dairy products (63.1%), spices (61.31%), fresh fruits (59.52%), processed/canned food (57.74%), eggs (50%), fresh vegetables (39.88%), fresh beef (38.69%), fresh chicken meat (38.1%), cooked food (33.33%), and fresh fish (26.79%). In conclusion, the respondents tend to look to buy instant noodles, snacks and drinks at a hypermarket.
Supermarket. This type of market is smaller in size than the hypermarket. The market can also be found more easily than the hypermarket thanks to the more frequent area of spread. From the total of 282 respondents who admit that they go to the supermarket for grocery shopping, here are the items that the respondents regularly purchase at a supermarket, from most to least popular: instant noodles (79.43%) snacks (69.5%), drinks (64.54%), spices (52.84%), dairy products (51.06%), fresh fruits (50%), eggs (44.68%), processed/canned food (42.55%), fresh vegetables (33.69%), cooked food (32.98%), fresh chicken meat (31.56%), fresh beef (25.53%), and fresh fish (20.57%). In conclusion, the respondents tend to look to buy instant noodles, snacks and drinks at a supermarket. The purchase trend in supermarket is very similar to that of in hypermarket.
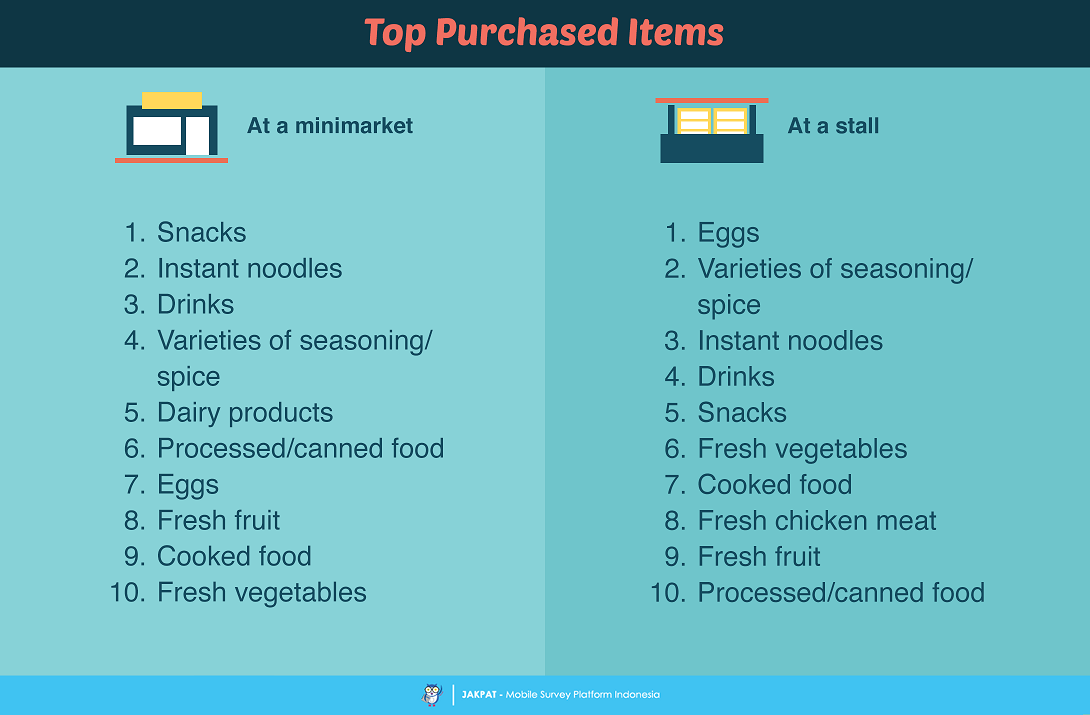
Minimarket. This type of market is smaller in size than the supermarket. Therefore the area of spread is more frequent because the building can fit smaller space between other buildings. From the total of 182 respondents who admit that they go to the minimarket for grocery shopping, here are the items that the respondents regularly purchase at a minimarket, from most to least popular: snacks (81.32%), instant noodles (77.47%), drinks (69.23%), spices (42.86%), dairy products (39.56%), processed/canned food (36.26%), eggs (24.18%), fresh fruits (22.53%), cooked food (19.23%), fresh vegetables (11.54%), fresh beef (8.24%), fresh chicken meat (8.24%), and fresh fish (7.14%). In conclusion, the respondents tend to look to buy snacks, instant noodles and drinks at a minimarket. Once again the trend is similar to the trend that can be found in supermarket and hypermarket.
Stall. This type of “market” is even smaller than a minimarket. In Indonesia it usually does not provide much space for the customers to walk with much convenience. From the total of 76 respondents who admit that they go to the stall for grocery shopping, here are the items that the respondents regularly purchase at a stall, from most to least popular: eggs (65.79%), spices (56.58%), instant noodles (55.26%), drinks (42.11%), snacks (38.16%), fresh vegetables (26.32%), cooked food (25%), fresh chicken meat (22.37%), fresh fruits (15.79%), processed/canned food (13.16%), fresh fish (11.84%), and fresh beef (10.53%). In conclusion, the respondents tend to look to buy eggs, spices and instant noodles at a stall.
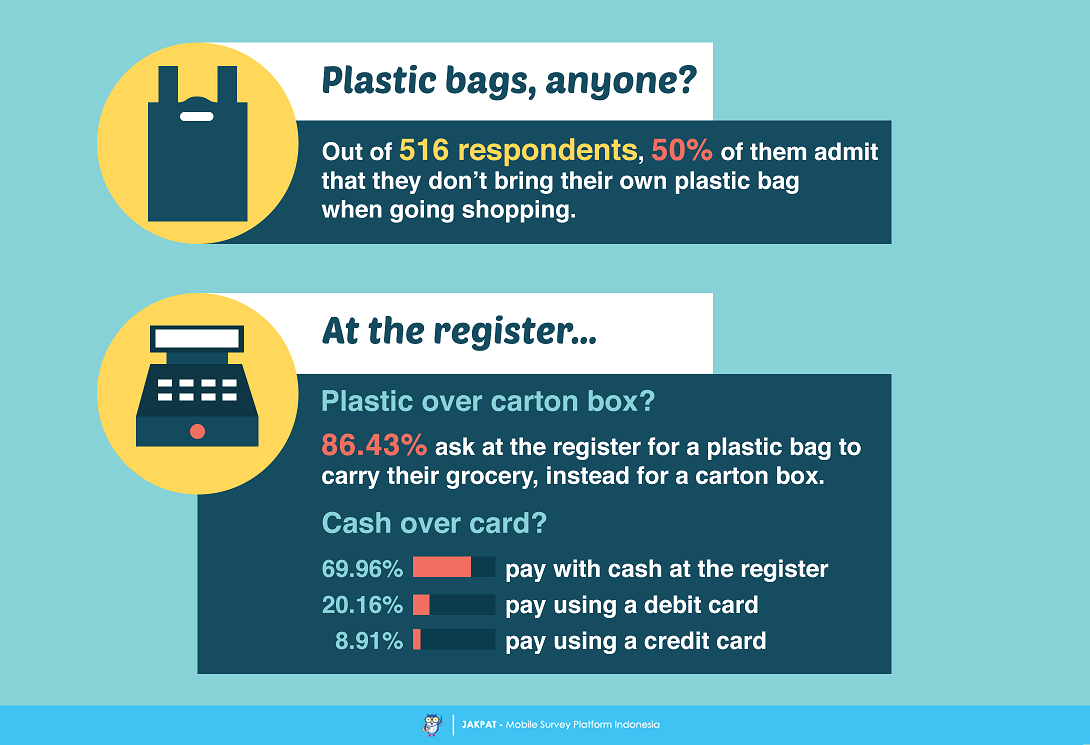
We then asked a question to our respondents about the choice of using a shopping bag. We specifically asked if the respondents usually bring their own shopping bag to wherever they go for grocery shopping. 50% of 516 respondents say they do bring a shopping bag. That also means the other exact half of the respondents group do not bring a shopping bag to grocery shop. As for those who do not bring a shopping bag on their own to a grocery shopping place, at the register or cashier we found that 86.43% of the respondents would ask for a plastic bag. 12.02% of the respondents would ask for a carton box. All to carry their grocery.
The last question we asked was about how our involved respondents usually pay for their grocery. We found that 69.96% of the respondents pay with cash. 20.16% use a debit card. Lastly, 8.91% of the respondents use a credit card.
For more detail you can download XLS report at the button below (Bahasa Indonesia). JAKPAT report consists of 3 parts which are 1) Respondent Profile, 2) Crosstabulation for each question and 3) Raw Data. Respondent profile shows you demographic profiles ( gender,age range, location by province, and monthly spending). Cross tabulation enables you to define different demographic segment preference on each answer.
![]()
You can also download PDF here:
![]()

or Get A Sales Quote by filling this form or Call to +622745015293
