


Instagram is still one of the most widely used applications in the world. Trends in social media that lately become viral often started from Instagram. Few times ago we have conducted a survey on user behavior instagram (Here is the link of our previous survey http://blog.jakpat.net/instagram-users-instagram/). Our curiosity on instagram user behavior does not stop there. We decided to do a survey on user behavior instagram part 2. The survey involved 3002 instagram users as respondents.
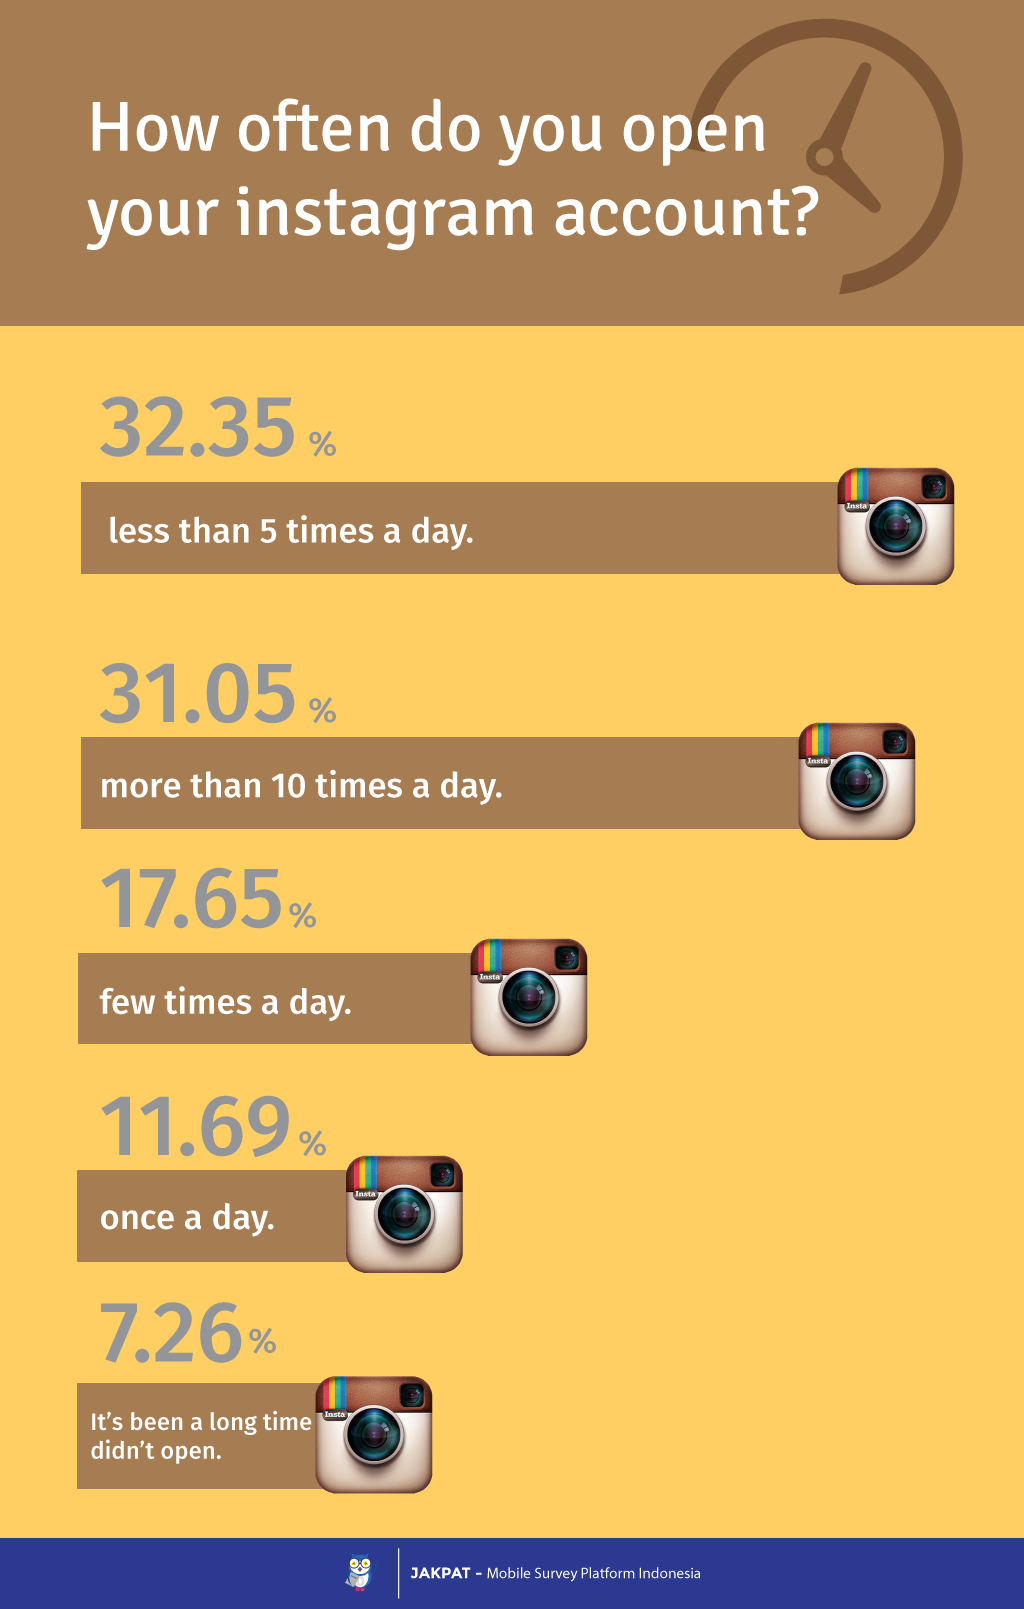
We started the survey by asking the respondents how often they open Instagram a day. And mostly respondents answered less than 5 times a day, but second most frequent answer was more than 10 times a day. Quite contradictory.
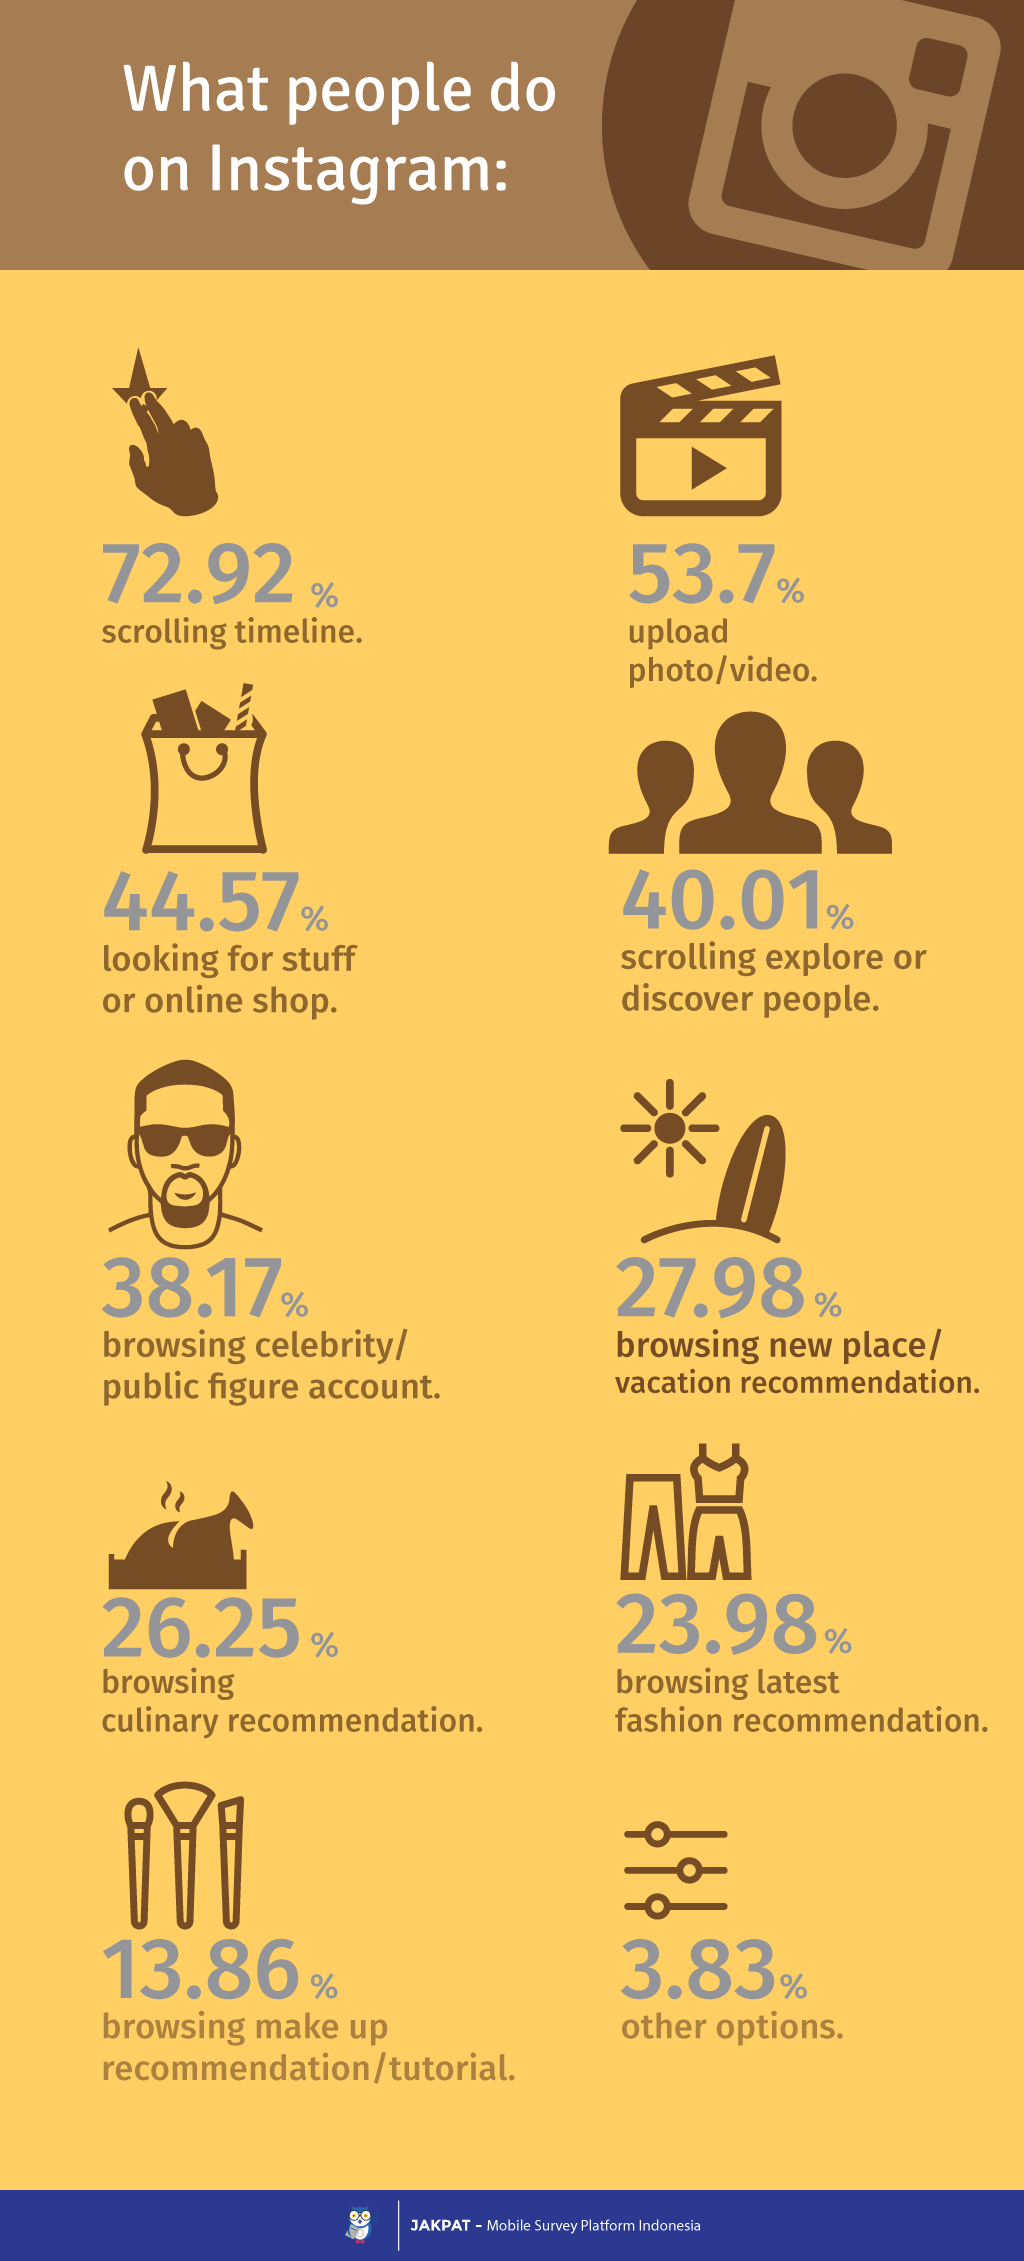
Lately, Instagram renewed its feature, one of which is the ‘explore’. In the ‘explore’ feature, user can find photos uploaded randomly. The emergence of these photos is based on photographs that are liked by people that users follow. Feature on Instagram so allows users to do many things. Therefore, we want to know what activities are performed by users when accessing Instagram. Here is the answer:
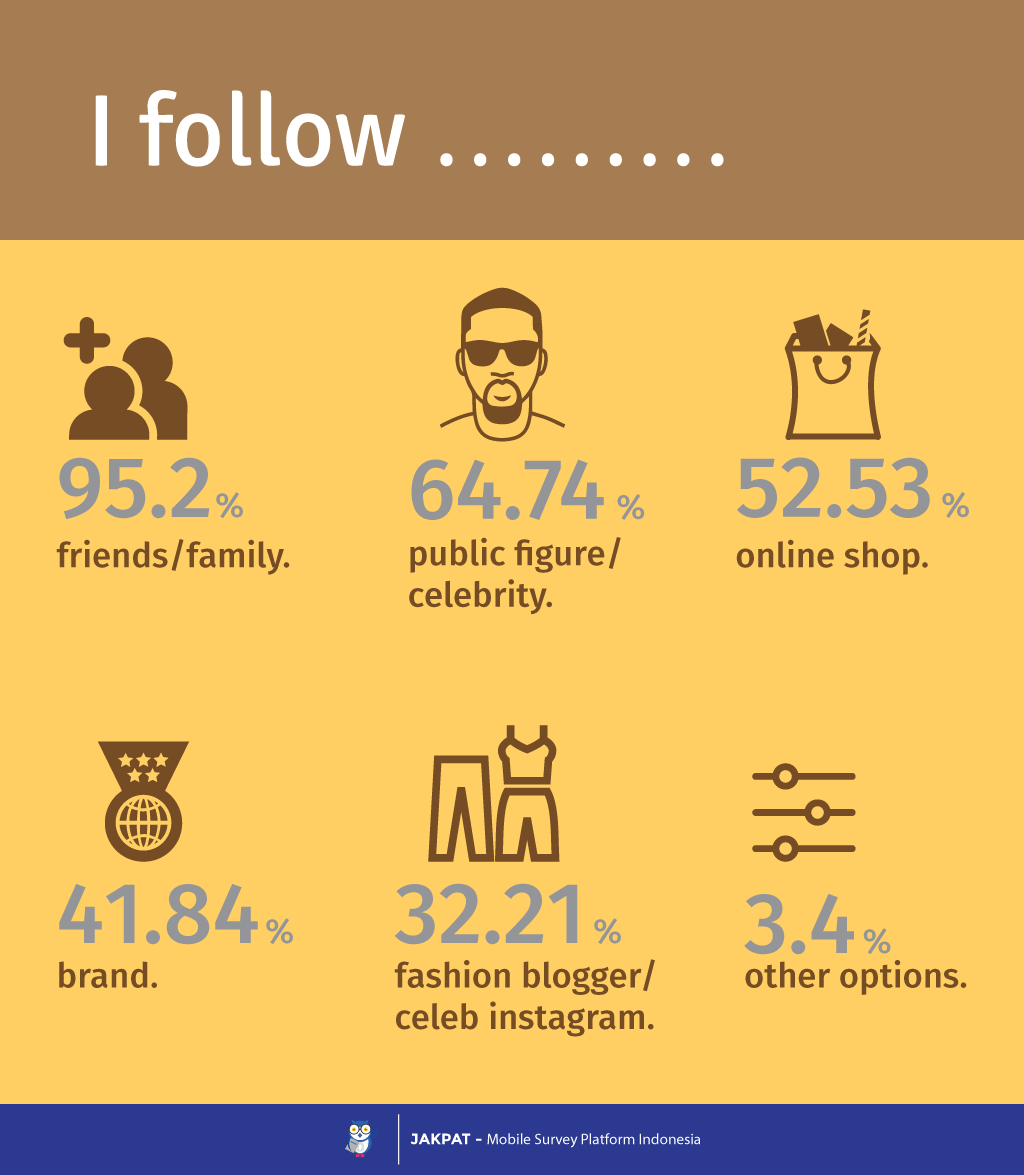
Follow and following are two important things in Instagram. We also asked respondents who are they follow on Instagram. On this question, we allowed respondents to choose more than 1 answer. In fact, friends / family was the top answer chosen by the respondents (95.2%). Meanwhile, the artist / famous personalities chosen as the second most frequent answer (64.74%). The third was online shop account as much as 52.53%
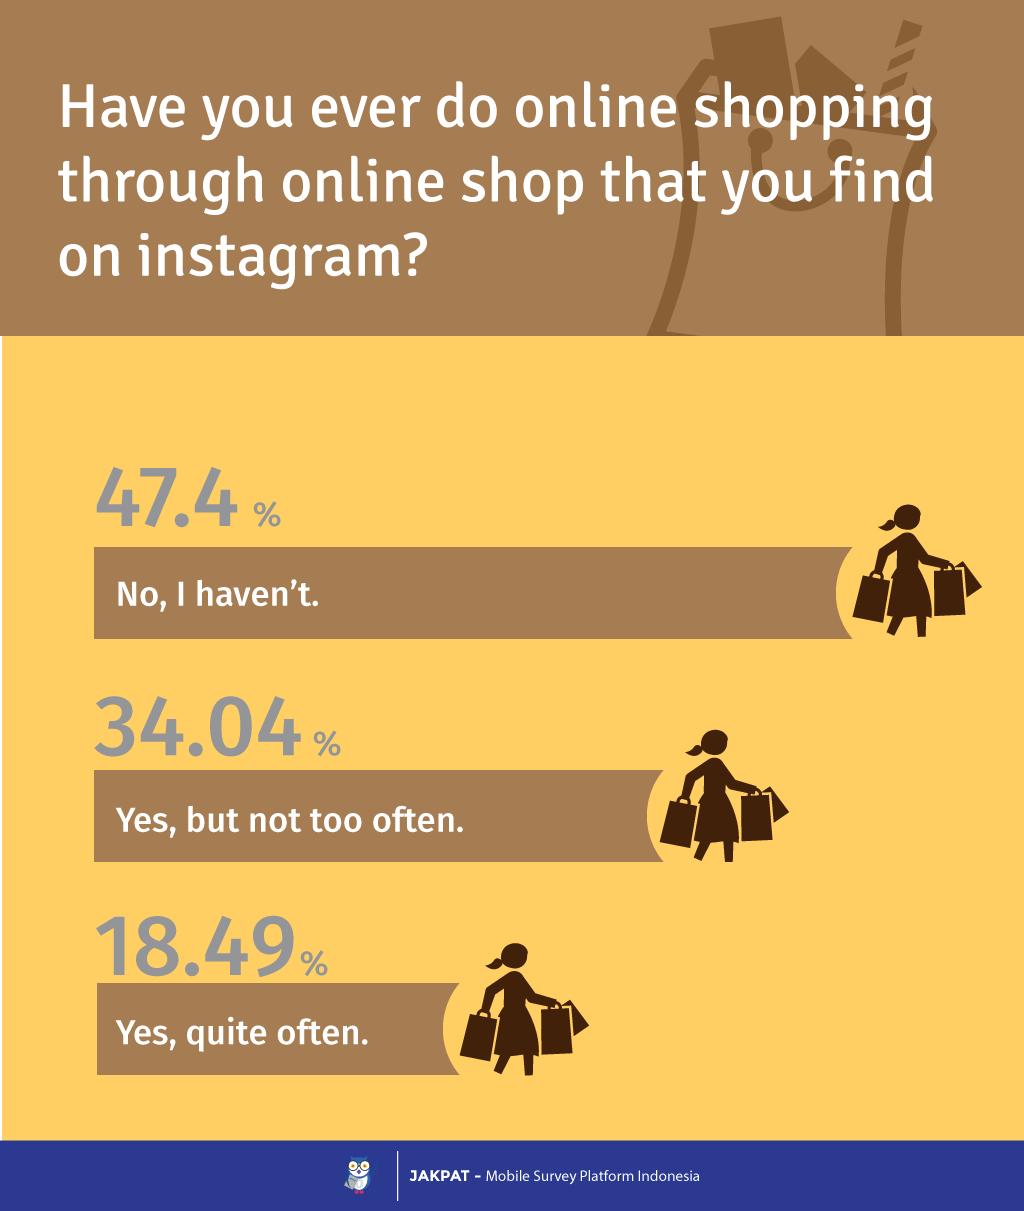
It is undeniable that the existence of Instagram contribute to the growth of the online shop. We also asked respondents whether they like to shop at online shop they meet in Instagram. 47.4% of respondents stated they have never shopped, 34.04% of the respondents had been but not often, while the 18:49% of respondents admitted quite often.
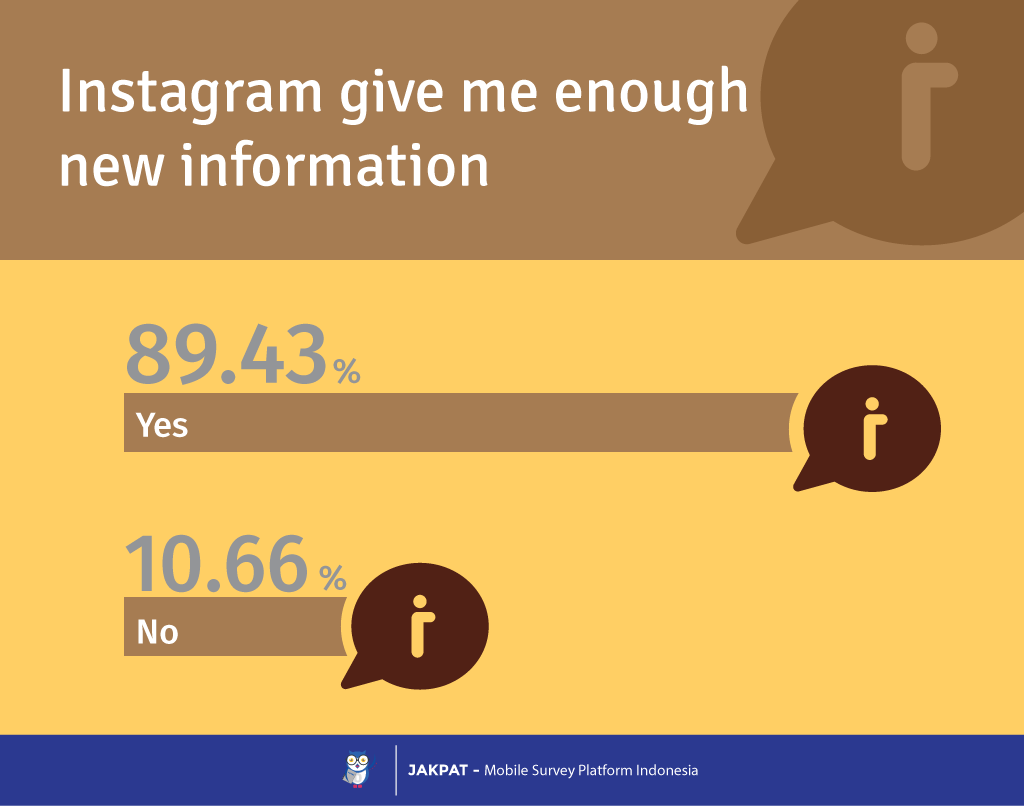
As a final question, we asked whether Instagram provide enough new information to the respondent. 89.43% of respondents said yes!
For more detail you can download XLS report at the button below. JAKPAT report consists of 3 parts which are 1) Respondent Profile, 2) Crosstabulation for each question and 3) Raw Data. Respondent profile shows you demographic profiles ( gendr,age range, locationby province, and monthly spending). Cross tabulation enables you to define different demographic segment preference on each answer.
![]()
Click the icon to download XLS report ( in Bahasa)
Ready to Send A Survey?

or Get A Sales Quote by filling this form or Call to +622745015293
