


Marriage is one of the stages of human life that brought many changes in one’s life. Changes in lifestyle habits, finances, plus more if you already have children. In this survey, Jakpat wants to know life of the millennial panel married.
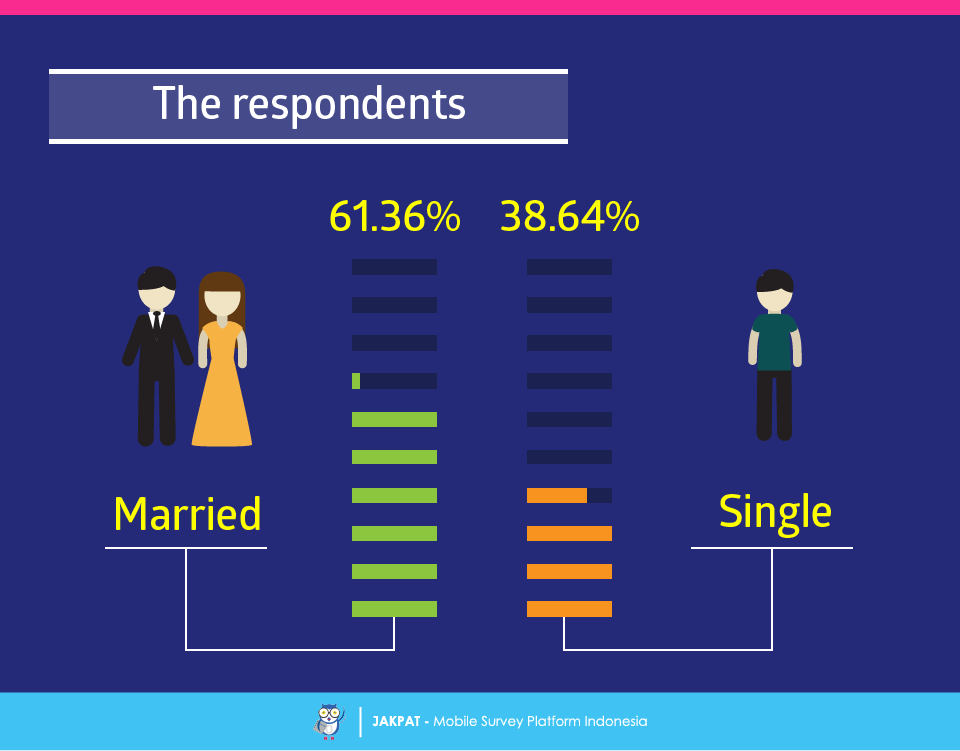
In this survey we involved a total of 500 respondents aged 25-35 years. At the beginning we did a screening survey of 500 respondents, and obtained 61.36% were married, while the rest claimed not married. Then we went on the survey questions further to 61.36% of respondents.
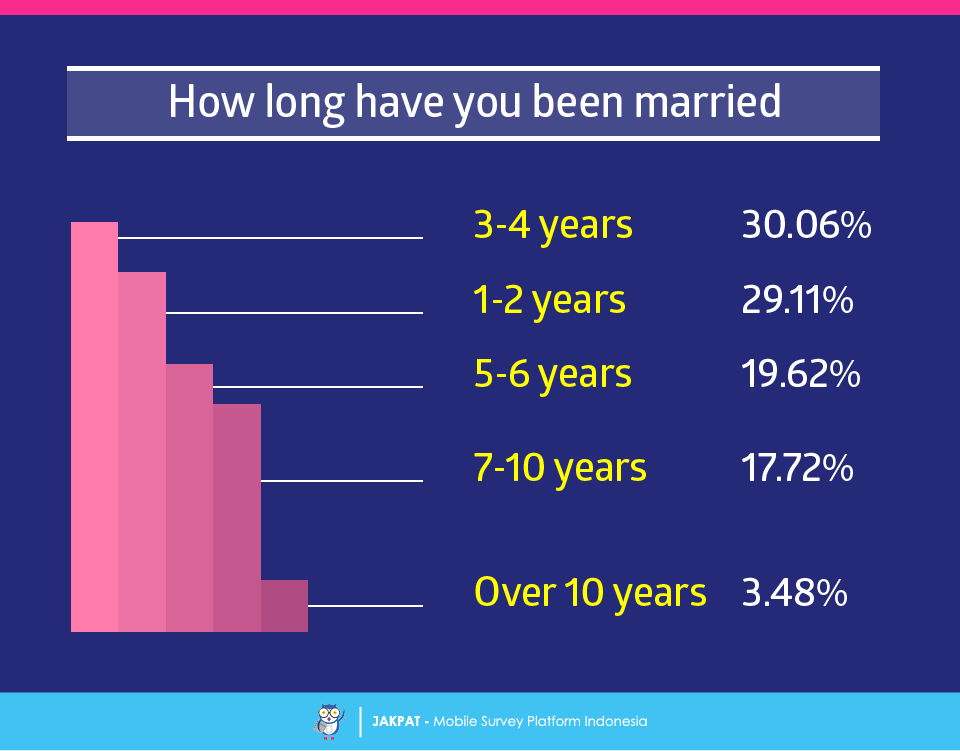
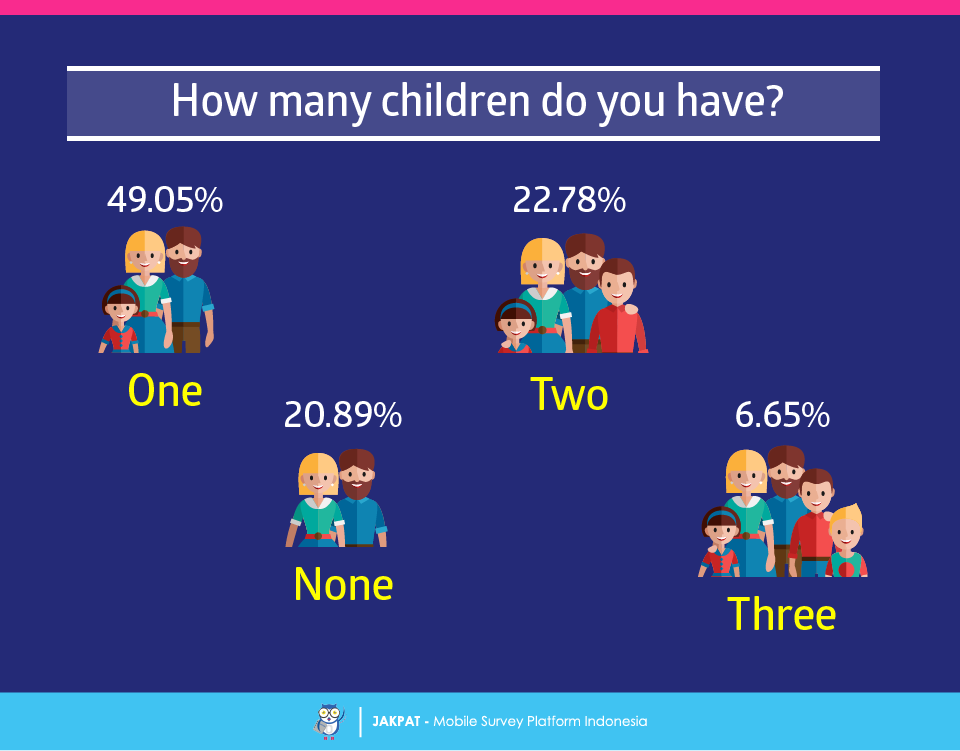
1. The majority of respondents claimed to have been married 3-4 years old, married at the age of 25 years, and has one child
We started with a survey by asking the panel marriage age. The majority of states have been married for 3-4 years. And about 20% admitted to marry at the age of 25 years. The findings we encountered that no respondents who had children more than 3 people. The majority claimed to only have one child, while the childless is 20.89% of respondents.
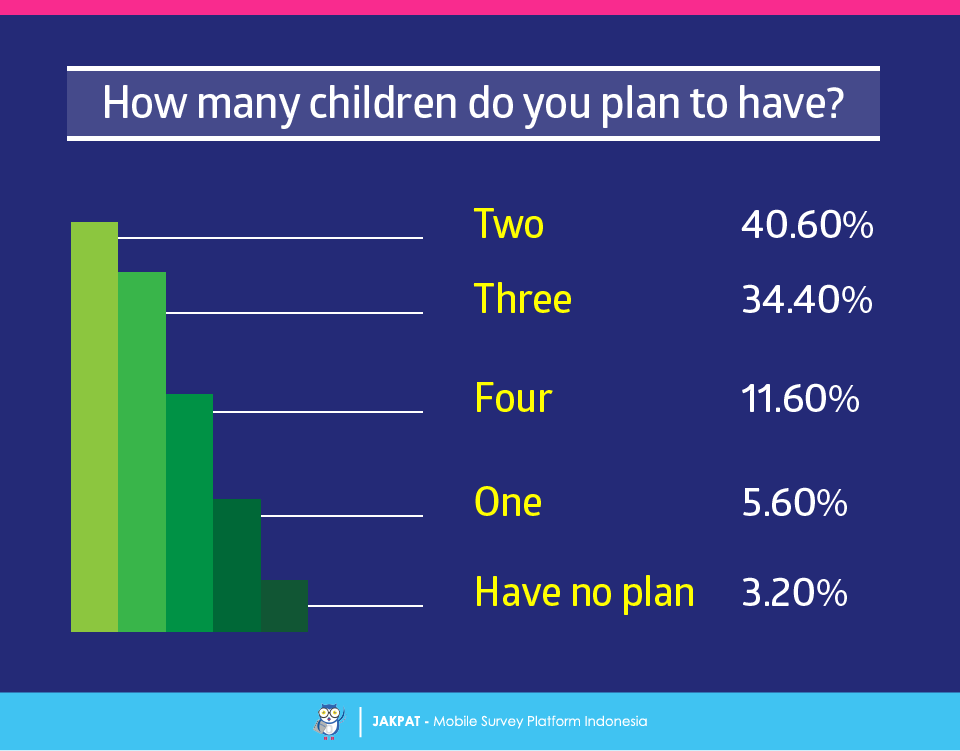
2. Two children are enough!
Nowadays, having many children may bring a lot of consideration for parents millennial. The high cost of living and living in densely populated Indonesia makes planning the number of children is an major issue in the household. The majority of respondents admitted to planning to have no more than three children.
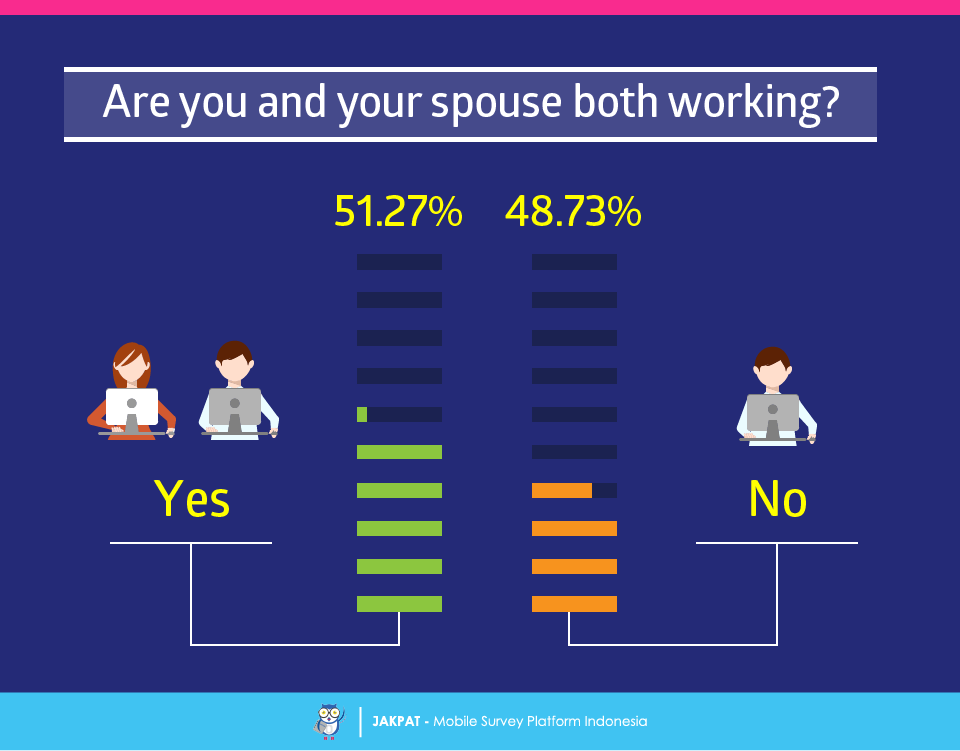
3. We are both working
In a household, the husband and wife have their respective roles. In Indonesia culture, husband has a primary obligation to make a living, while his wife took care of the child. But this time, a huge number of wives who participate earn a living both for economic and intellectual guidance themselves. More than 50% of respondents said they are both working.
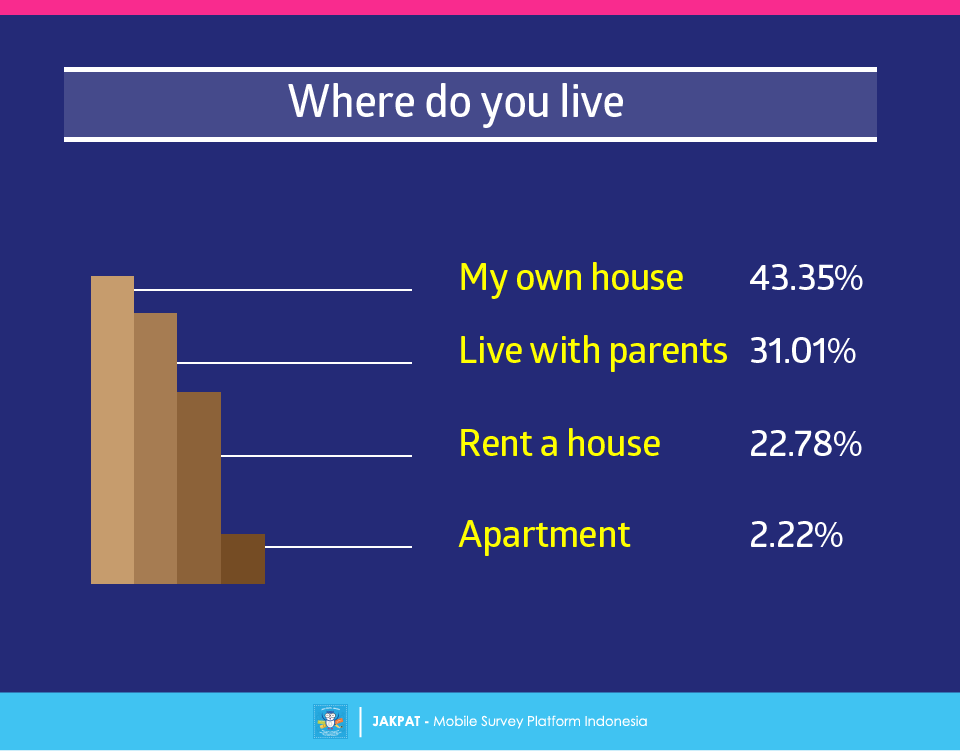
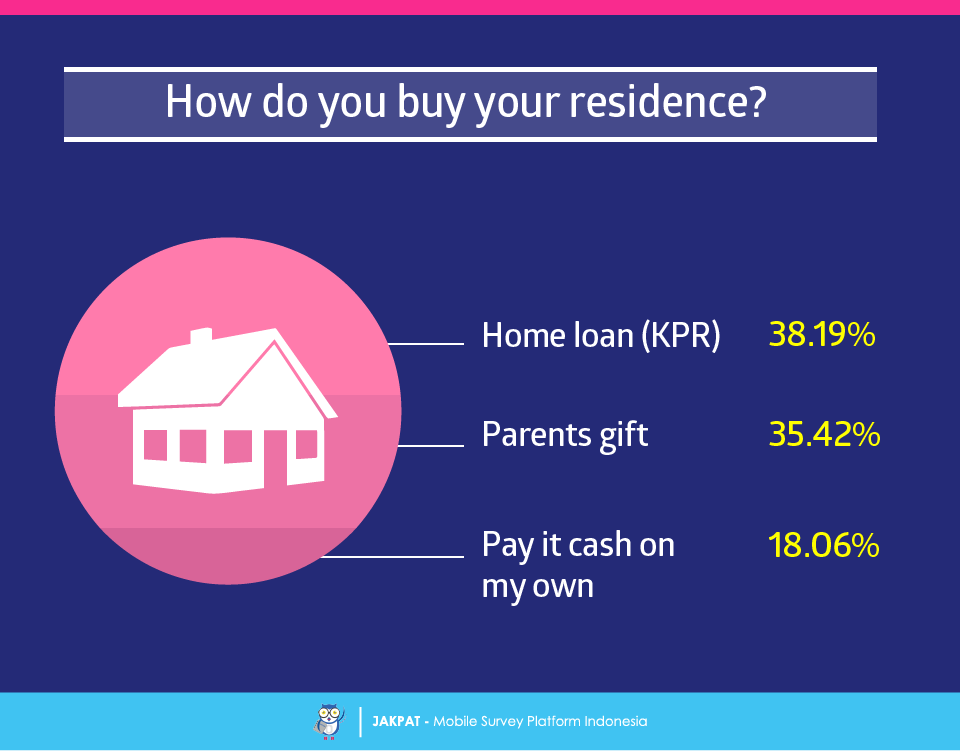
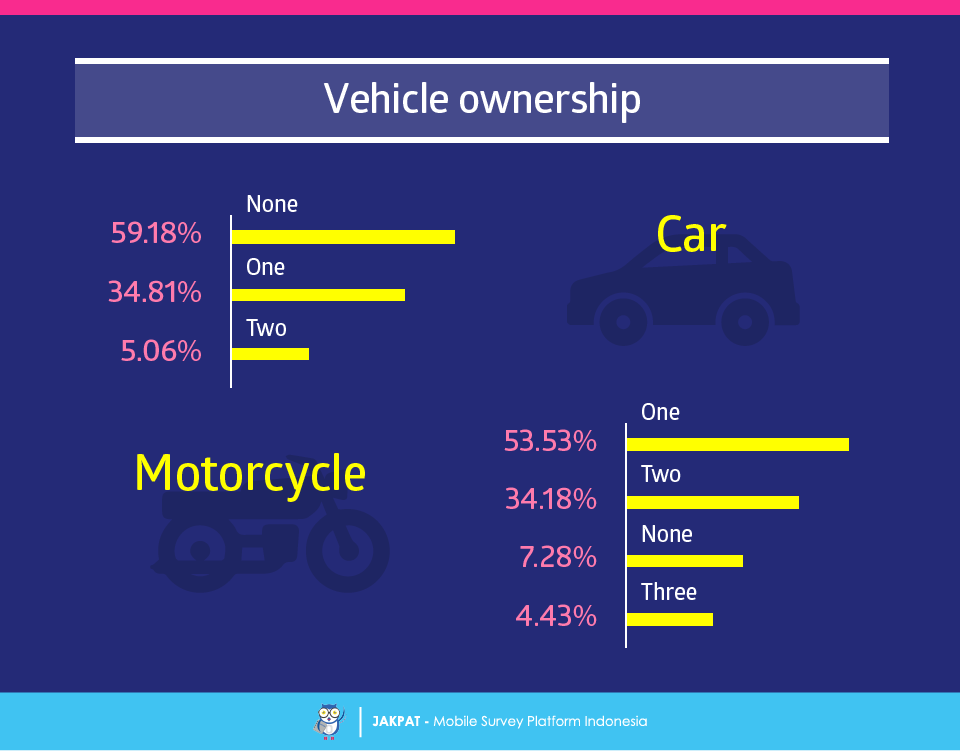
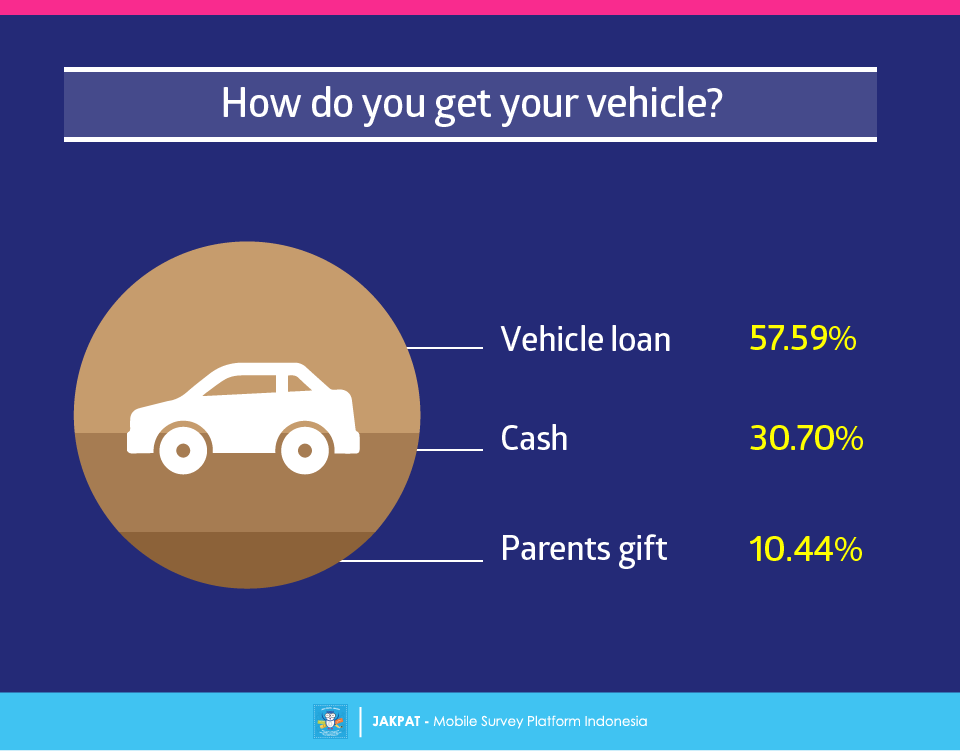
4. Where do you live, and what do you ride?
The residence and the vehicle is very important in a household. Therefore there are a lot of offers of loans for residence and vehicles. The majority of our respondents turned out to have their own houses, but not a few who claimed to still live with my parents. For respondents who claimed to own a home and apartment, we asked how they get the residence. It turned out that the majority of them using a home loan or parents gift. As for vehicles, the majority use the loan to buy a vehicle.
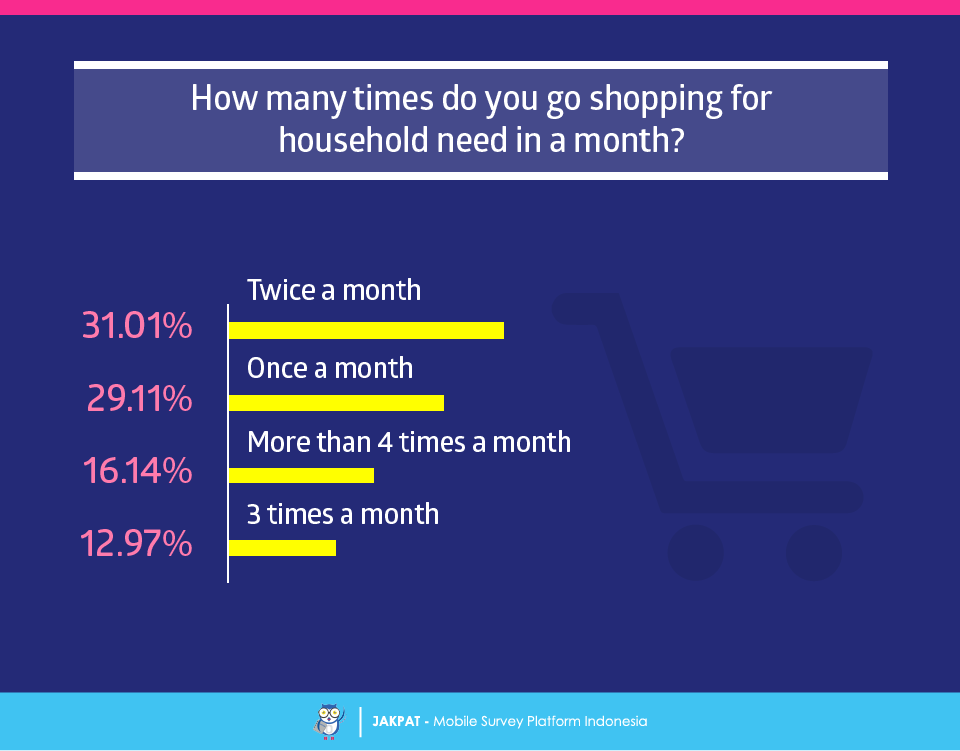
5. Household needs
Households must have had routine expenditure, there are monthly and even some are weekly. We also find out habits of the panel. Turns out the majority of their shopping twice a month.
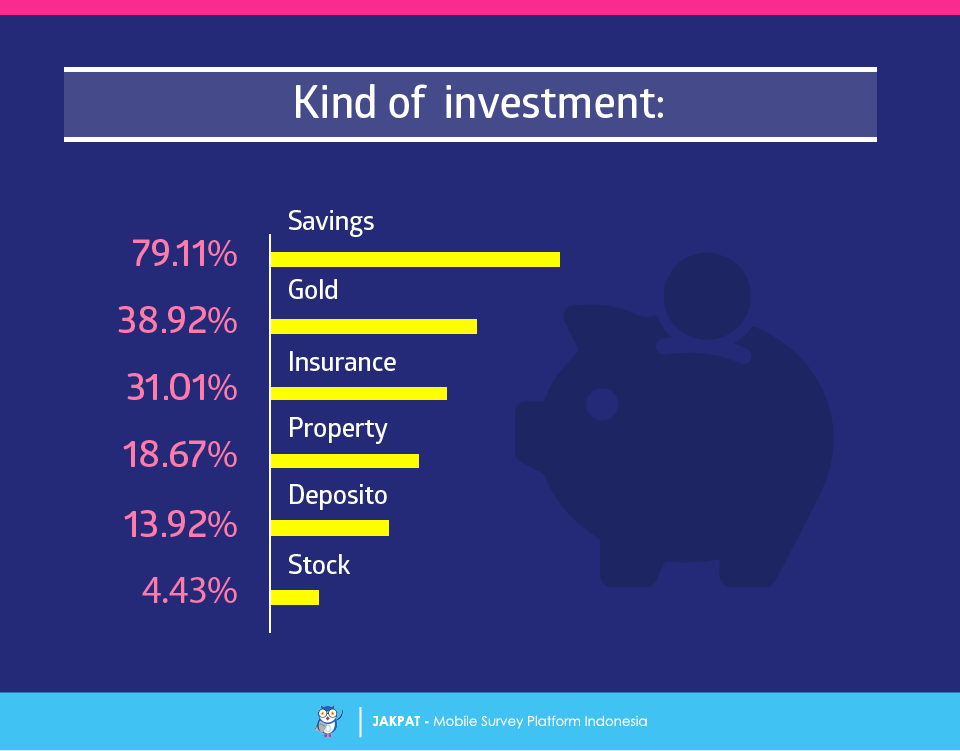
6. Investment and bills
Investment and the bill are two things that can not be separated from marriage. There are a lot of investment to do, especially if a couple have children. We asked the panel to mention any investment they have. And this is what we get:
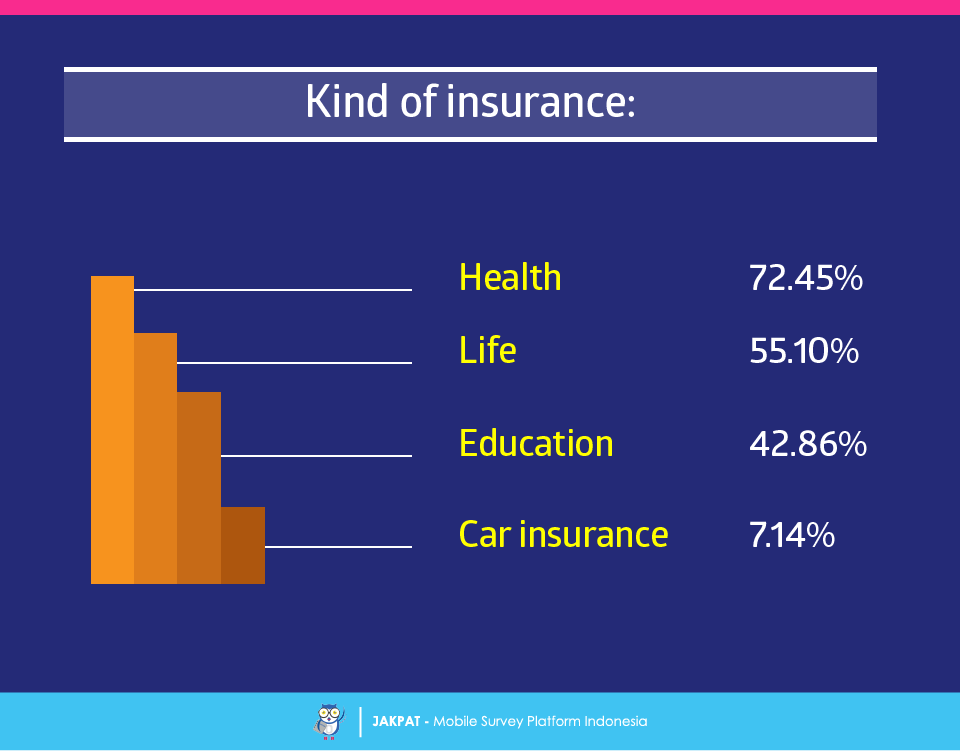
Some panels mentioned insurance as one of their investment, we were asked further what insurance they have. And this is their answer:
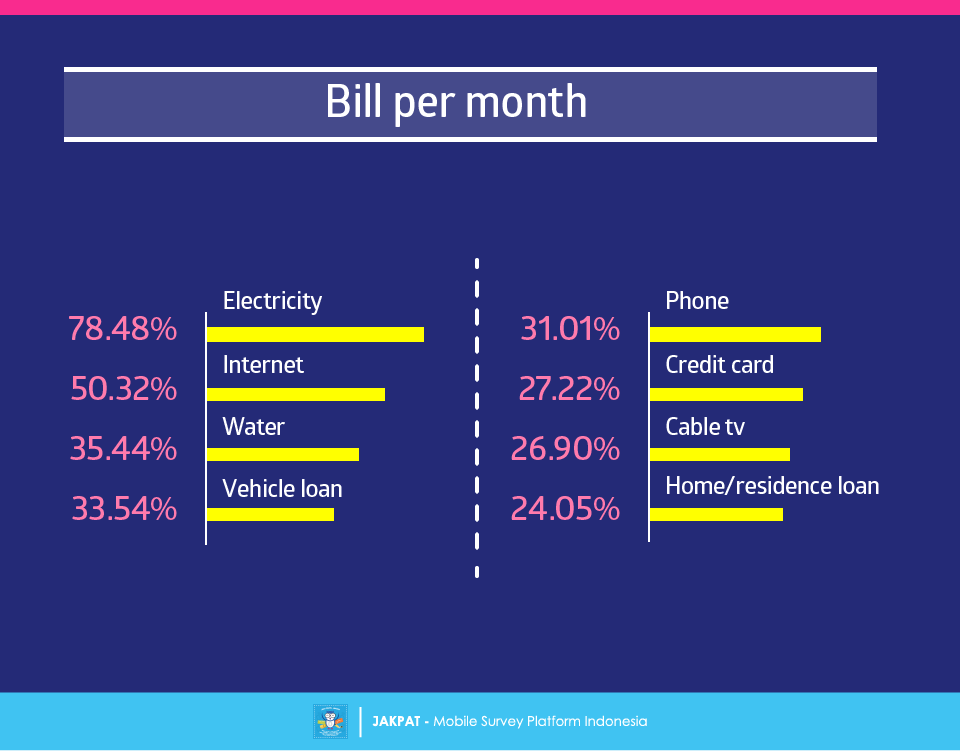
Each household has a different bill, we asked the panel to name the bill what they get each month:
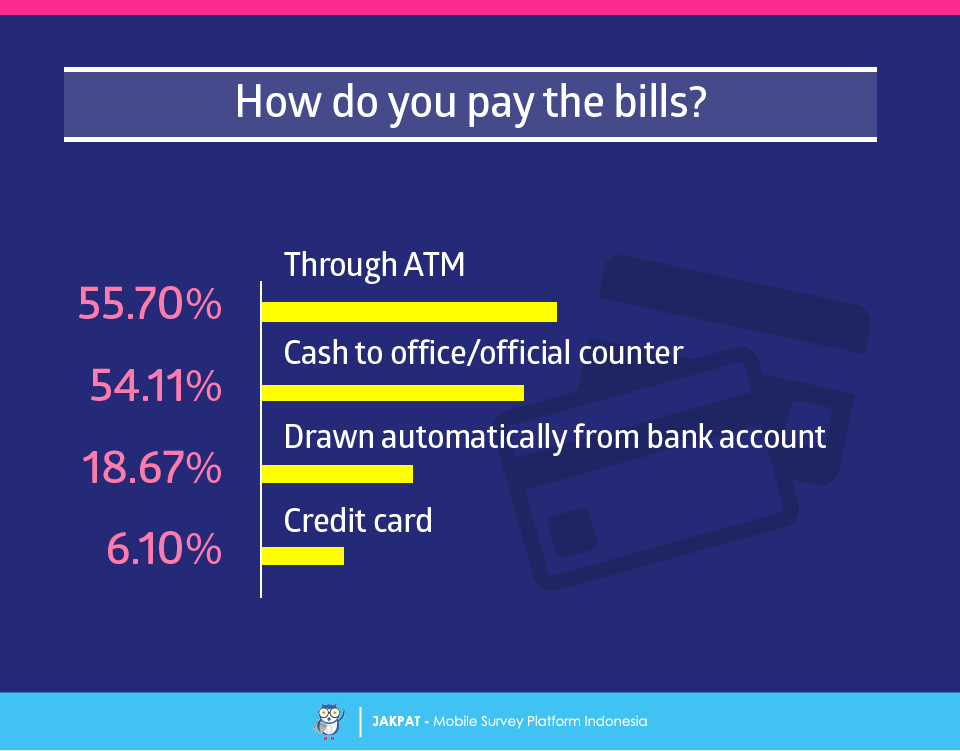
Nowadyas, payment of bills can be done in various ways, I wondered how they pay the bills per month. It turned out that the majority of respondents to make a payment through ATM.
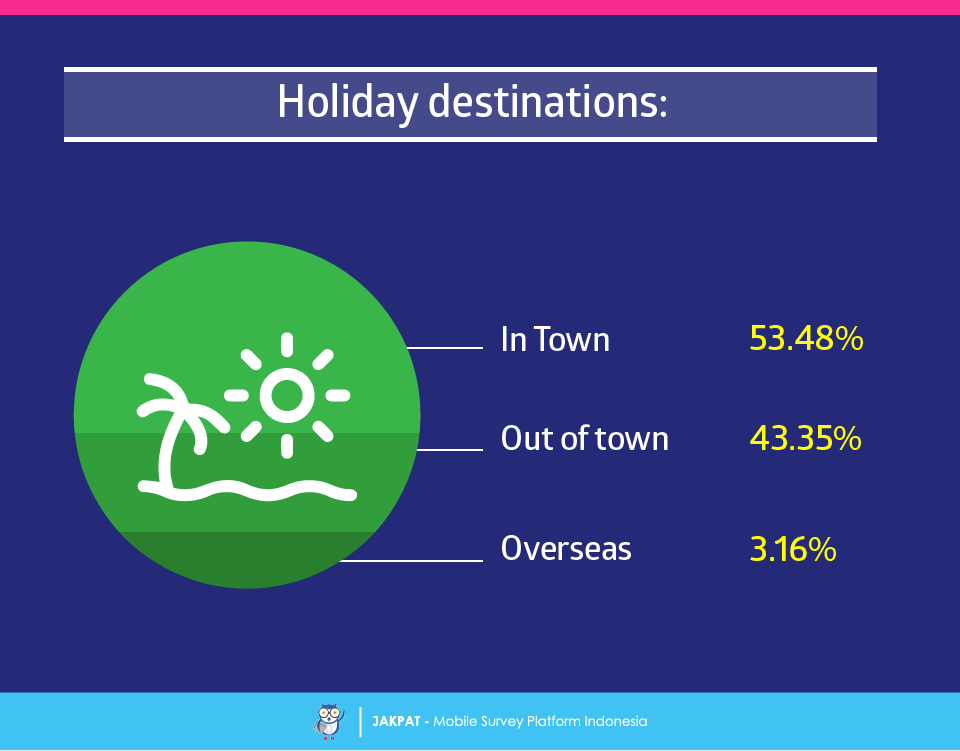
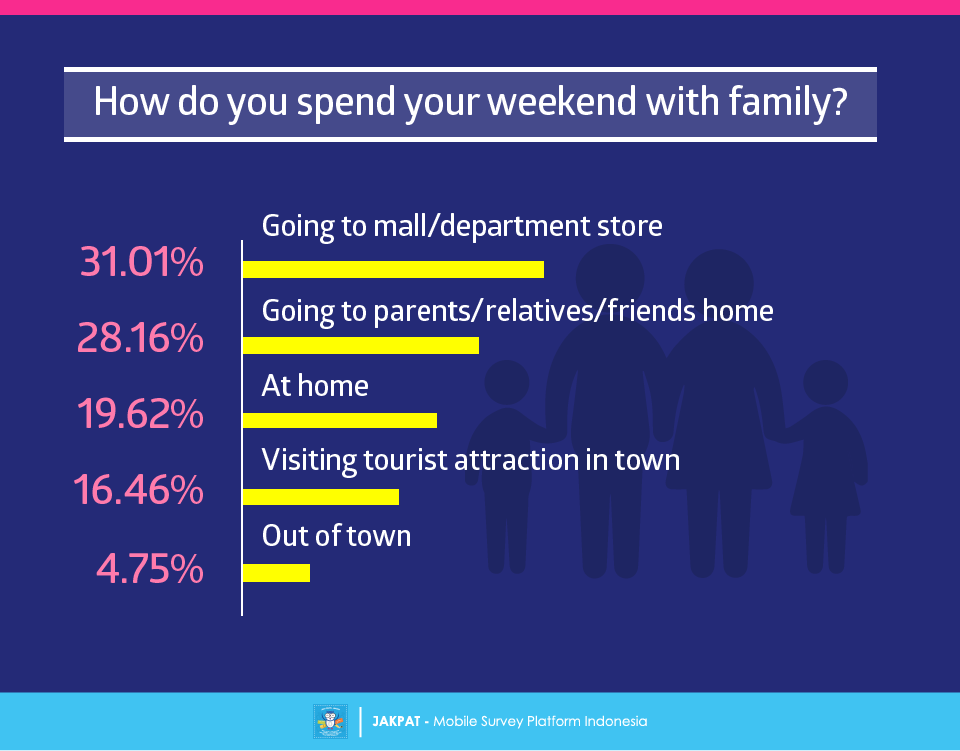
7. How do they spend the leisure?
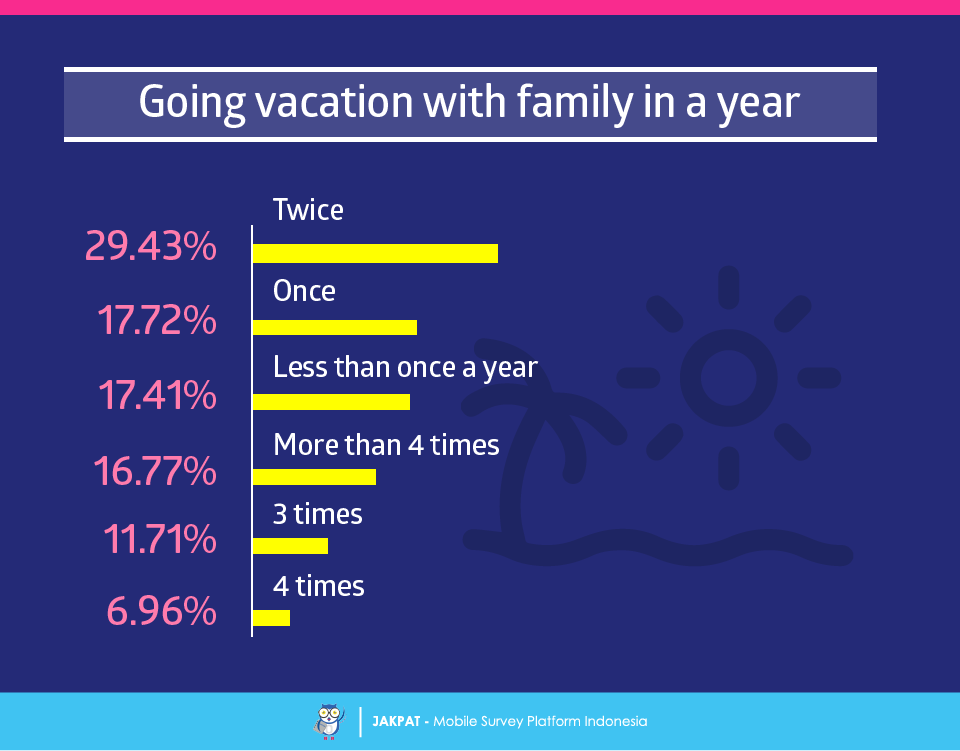
The majority of the panel claimed to go on holiday two times a year. While on his vacation destination, more than half claim to spend a holiday in the city. Visit a mall or department store become a favorite activity of the majority of respondents to spend the weekend with family.
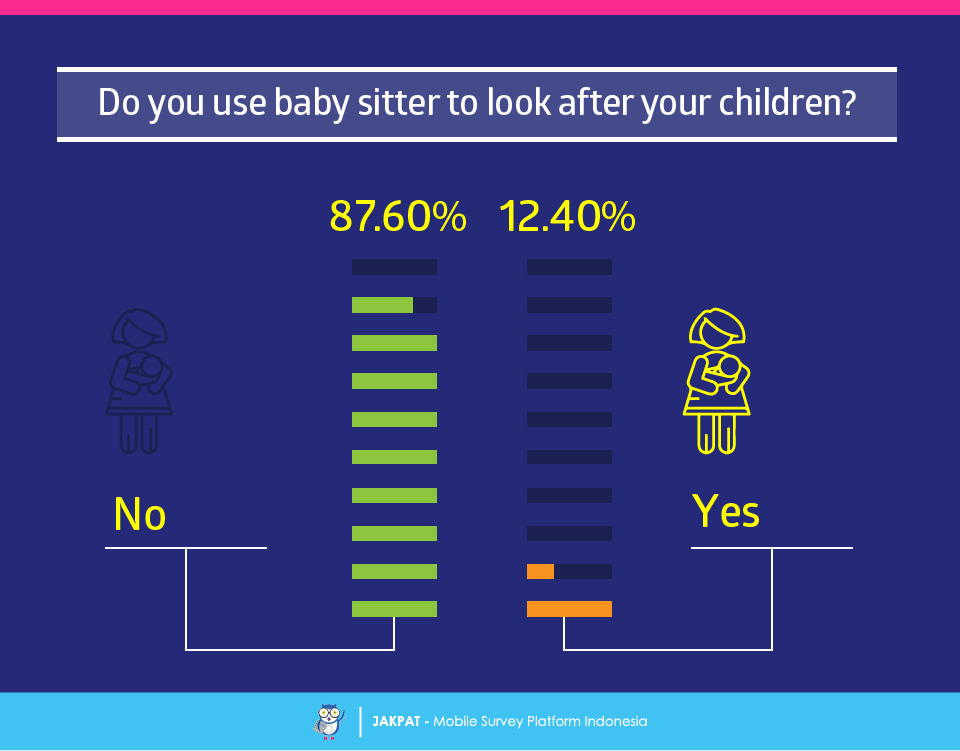
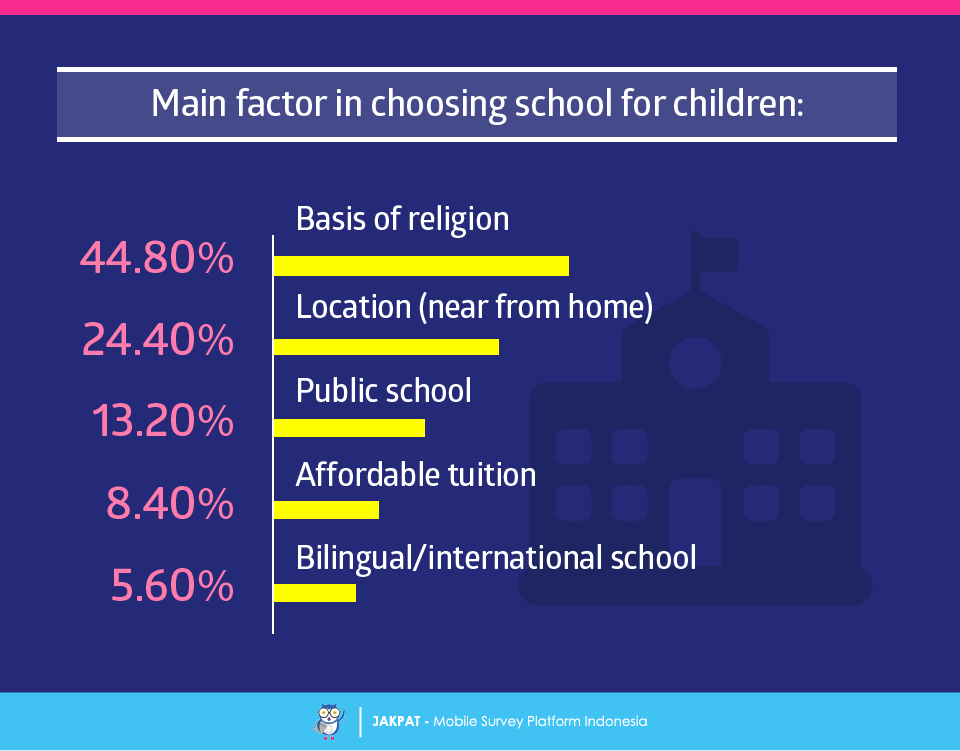
8. Taking care of children
We asked a couple who have had children, how they keep their children, whether use the nanny or not. It turned out that the majority say not use the services of a nanny. The issue of children can not be separated from education or school. The majority of respondents still consider the basis of religion becomes the most important factor in finding a school.
For more detail you can download XLS report at the button below (bahasa). JAKPAT report consists of 3 parts which are 1) Respondent Profile, 2) Crosstabulation for each question and 3) Raw Data. Respondent profile shows you demographic profiles ( gender,age range, location by province, and monthly spending). Cross tabulation enables you to define different demographic segment preference on each answer.
![]()
You can also download PDF here:
![]()

or Get A Sales Quote by filling this form or Call to +622745015293
