

Downloading contents from internet mostly becomes our regular habit, especially music and video contents. Here, JAKPAT wanted to explore regarding our respondents’ music and video content download habit. Thus, we created a simple survey towards our 513 respondents. And, here is the result. You can find more information concerning our respondents by downloading the pdf or excel file.
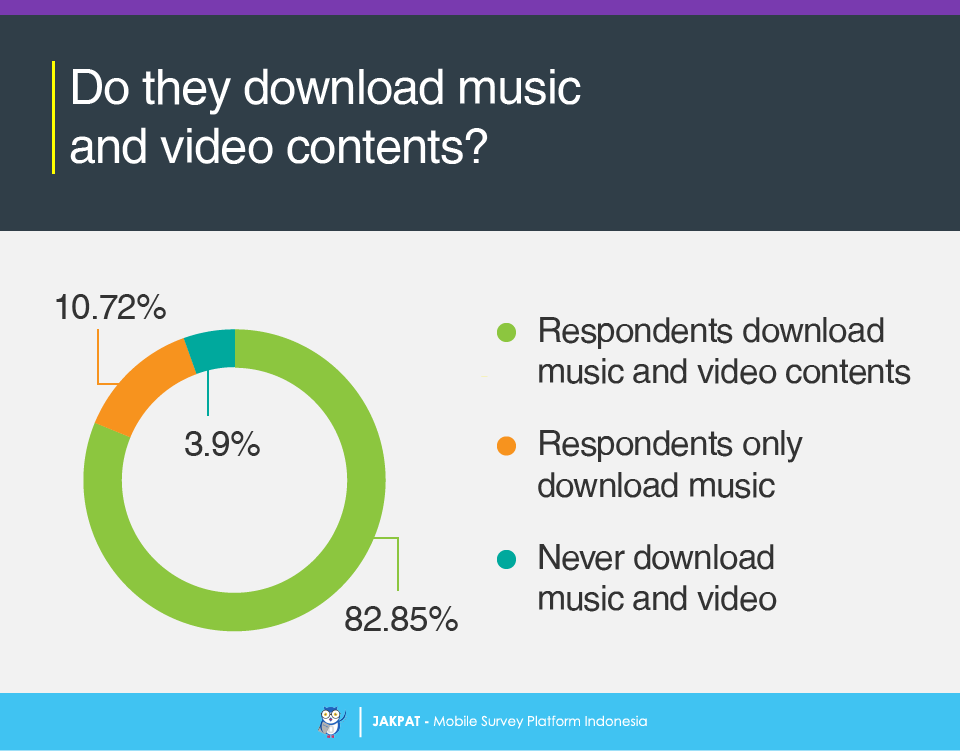
+80% of respondents download music and video
Firstly, we asked the respondents whether they ever have downloaded music and video or not. The result showed that majority of respondents ever have downloaded music and video (82.85%). Nevertheless, there are 3.9% of respondents who never have downloaded music and video from internet.
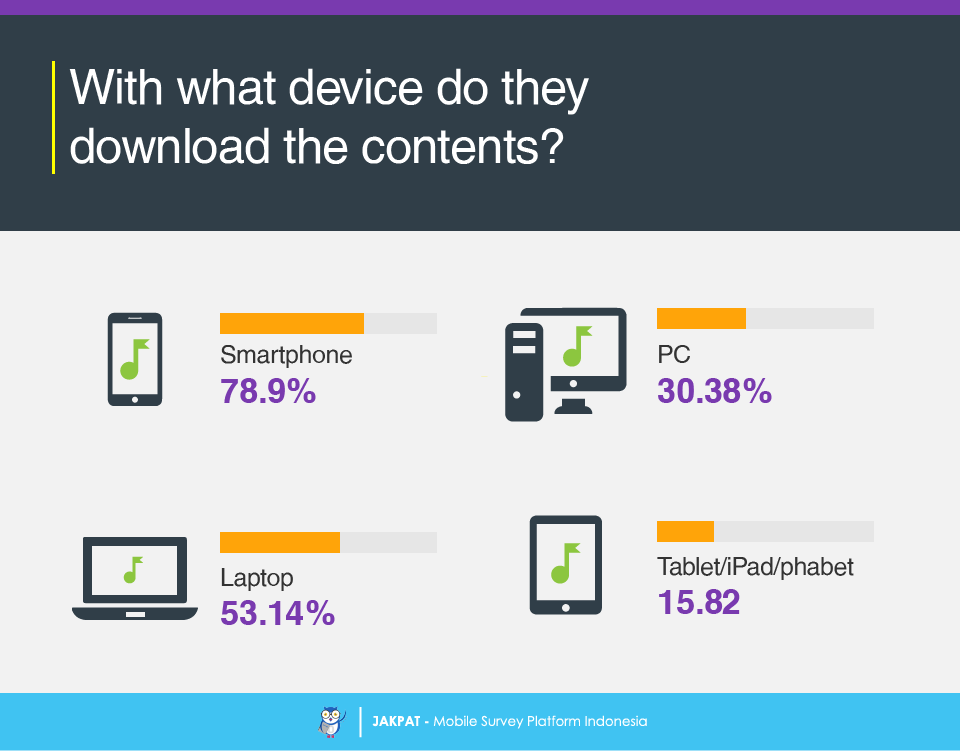
Smartphone is mostly used for downloading the contents
We also wondered how they download the media contents, thus we Buy inflatable water slide Canada asked another question concerning devices they use for downloading the contents. It turned out that most respondents use smartphone for downloading the media contents. It really shows us that smartphone eases our everyday activities and needs. Meanwhile, laptop is still often used by respondents (53.14%).
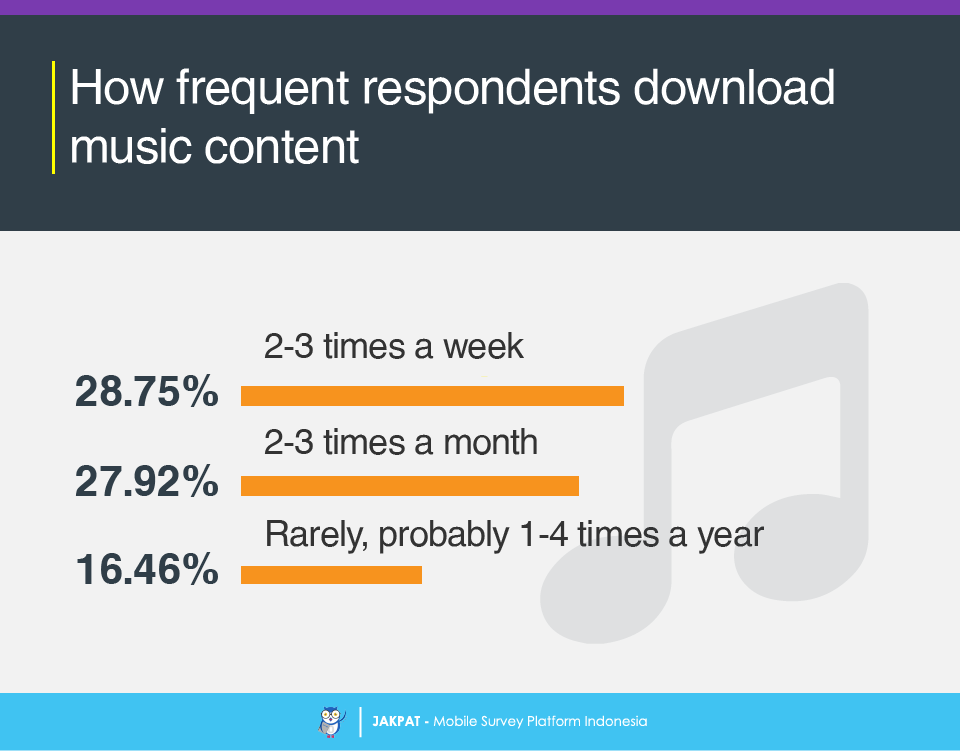
Respondents quite often download the music contents
Even if we did not get the highly significant percentage in the result, we knew that overall most respondents download the media 2-3 times a week (28.75%). Some of respondents download the media 2-3 times a month (27.92%). And some other (16.46%) said that they rarely download the media (probably 1-4 times a year). When seeing the XLS file, we found that male and female respondents have a slight different habit in downloading music contents. Male respondents tend to download music in 2-3 times a week (34.27%), while female respondents tend to download music in 2-3 times a month (28.87%).
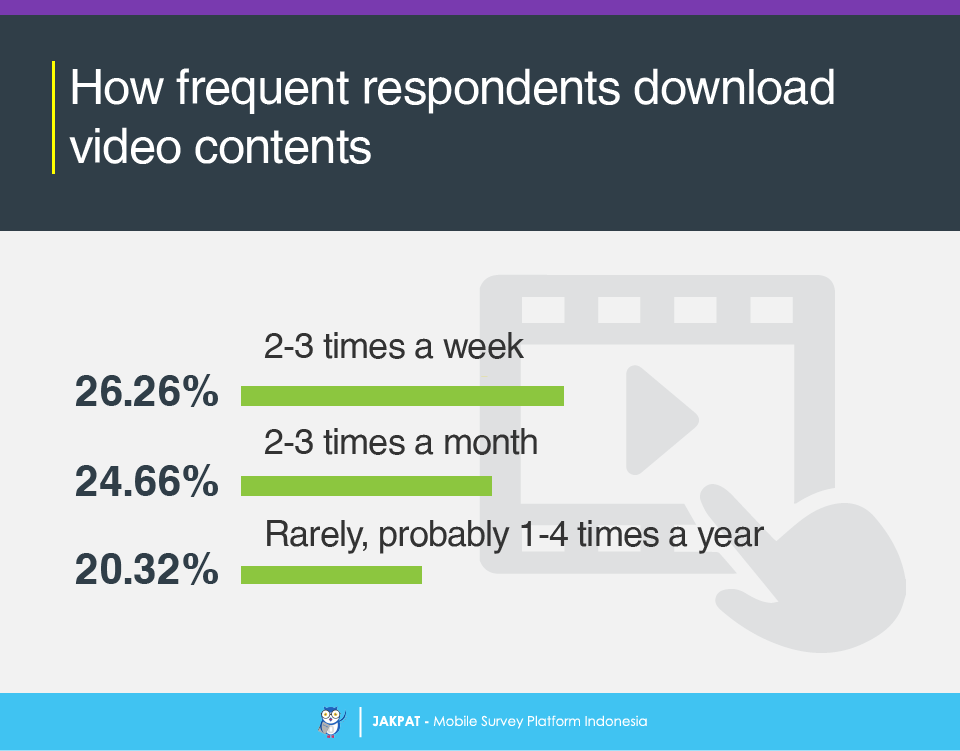
Our respondents quite often download the video contents
Similar to downloading music contents, when it comes to video our respondents have similar answer. Generally, most of our respondents download the video contents in 2-3 times a week. And 20.32% of respondents rarely download video contents. Female and male respondents here also have a different habit in downloading video contents. As to music, male respondents tend to download video in 2-3 times a week. Nevertheless, here, female respondents said that they rarely download the video contents.
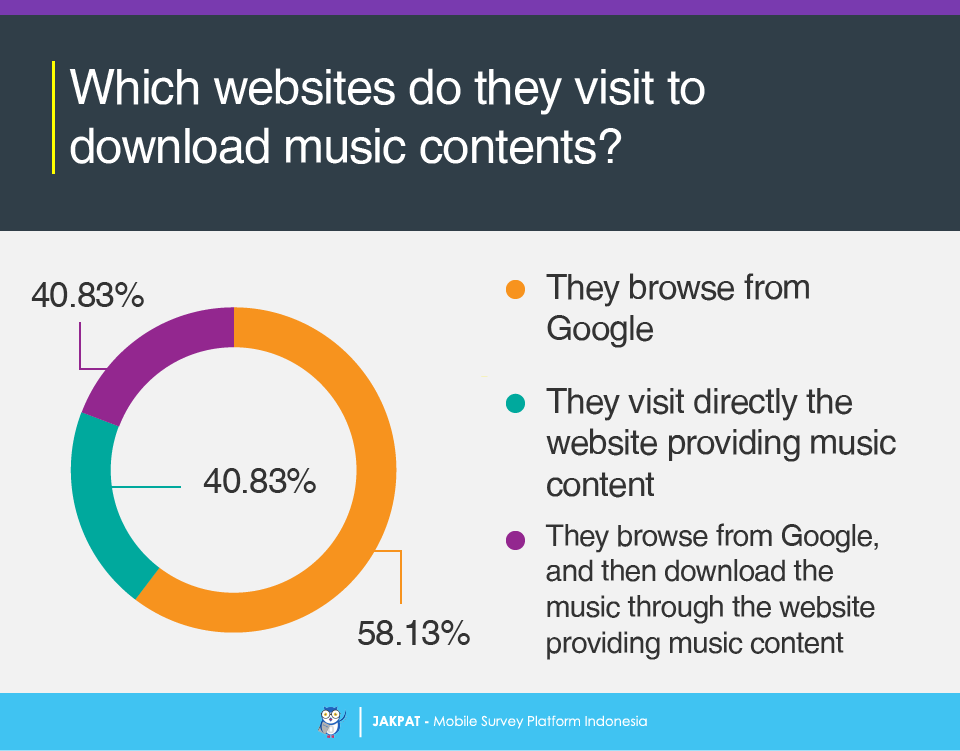
Browsing on Google is how most respondents get the music contents
We were curious in the way our respondents download the music, thus we asked them how they download the music contents. Then, it showed that before downloading the music, most of our respondents browse on Google first, and then download it later. Some of them prefer visiting the website directly and the others browse it first on Google then open the website found on Google and download the music.
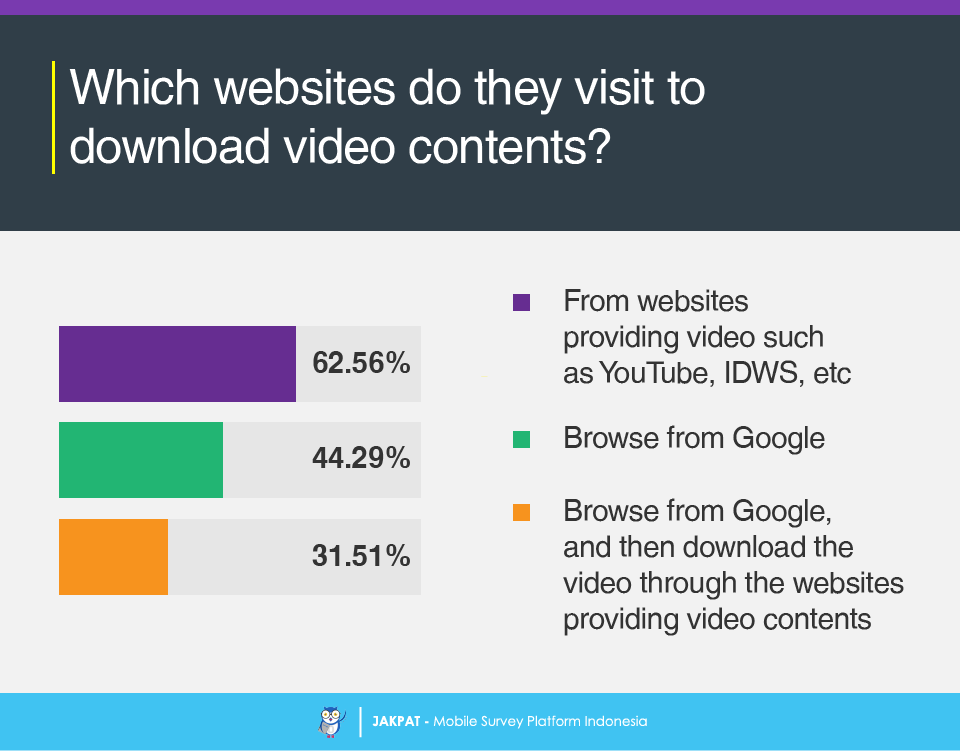
+60% of respondents visit the website directly to download videos
Conversely with the way our respondents download the music, when they download the video they prefer visiting the website directly to download the contents (62.56%). Some of them still prefer browsing on Google (44.29%) and the others browse on Google then open the website found on Google and download the contents (31.51%).
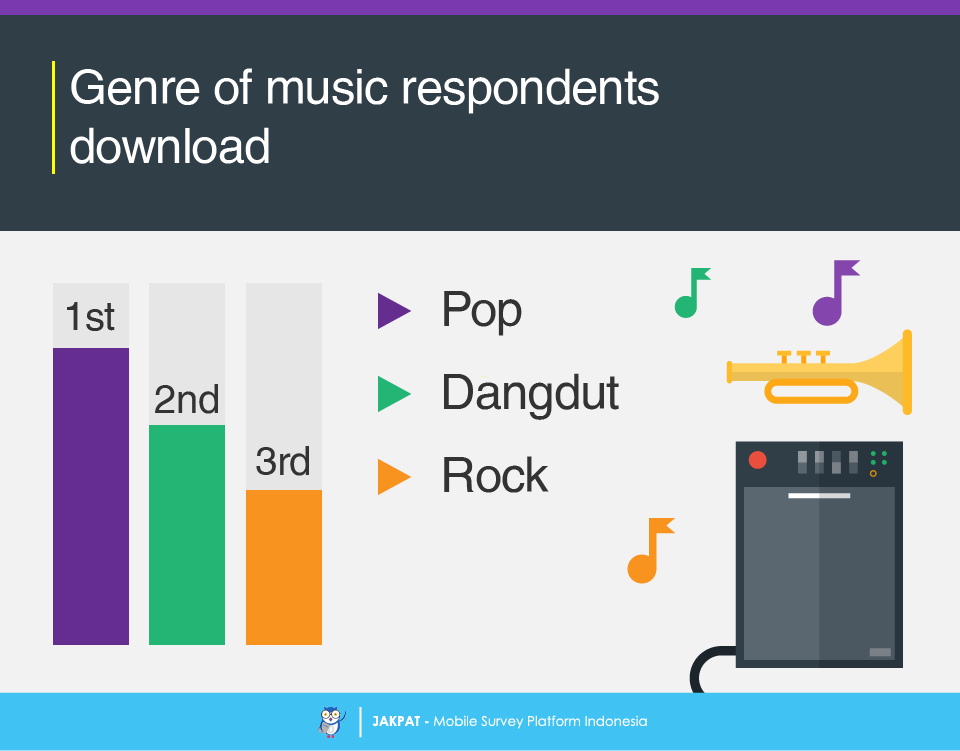
Pop is the music genre most respondents download
What kind of music do our respondents download most? Here, we asked the respondents what genre of music that they download by giving an open ended question. The result showed that Pop is the most favorite music that our respondents download. And on the second place is Dangdut and the third place is Rock.
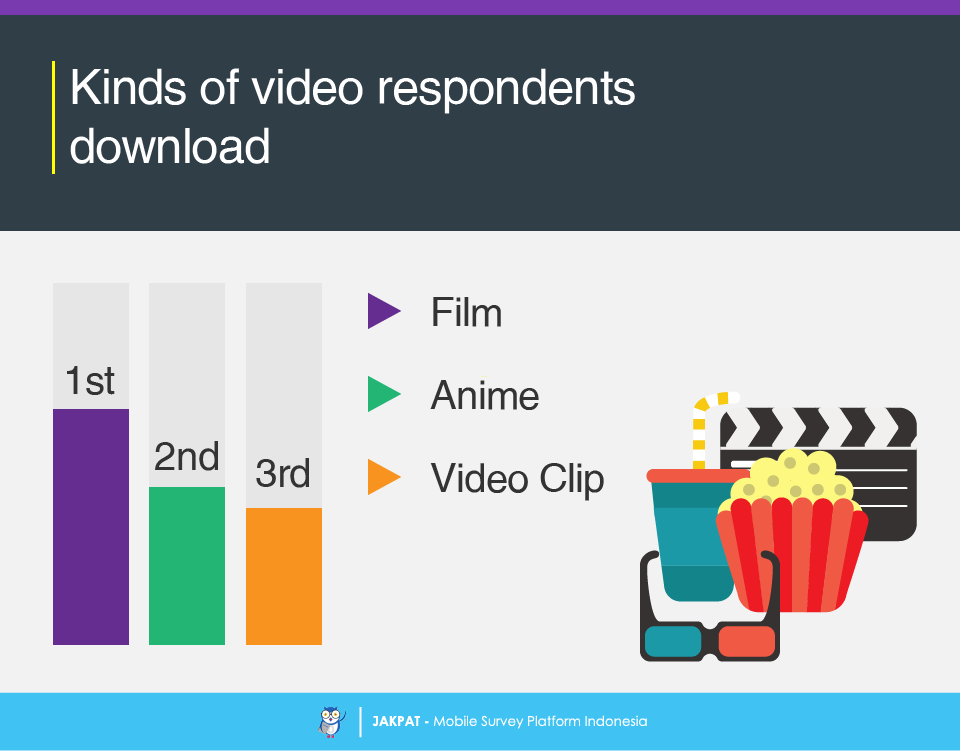
Film is the most download video
For video, most of our respondents download film or movie video. Other kinds of videos that our respondents download are Anime video and music video clip.
For more detail you can download XLS report at the button below (bahasa). JAKPAT report consists of 3 parts which are 1) Respondent Profile, 2) Crosstabulation for each question and 3) Raw Data. Respondent profile shows you demographic profiles ( gender,age range, location by province, and monthly spending). Cross tabulation enables you to define different demographic segment preference on each answer.
![]()
You can also download PDF here:
![]()

or Get A Sales Quote by filling this form or Call to +622745015293
