


Millennial or Gen Y is generation that will become the next leader, bring some changes in the future and run the government. Thus, trying to find some facts relating to millennials will be interesting. As we did here, JAKPAT conducted a replication survey from here to our millennial respondents across some cities in Indonesia. This survey is followed by 531 respondents, from 20-30 y/o.
The primary purpose of this survey is to know the outlook of Inflatable water slide for sale Canada millennial. We provided several future related questions to our respondents, in purpose to know their answer relating to their future plans, specifically relating to their basic or primary needs and online behavior.
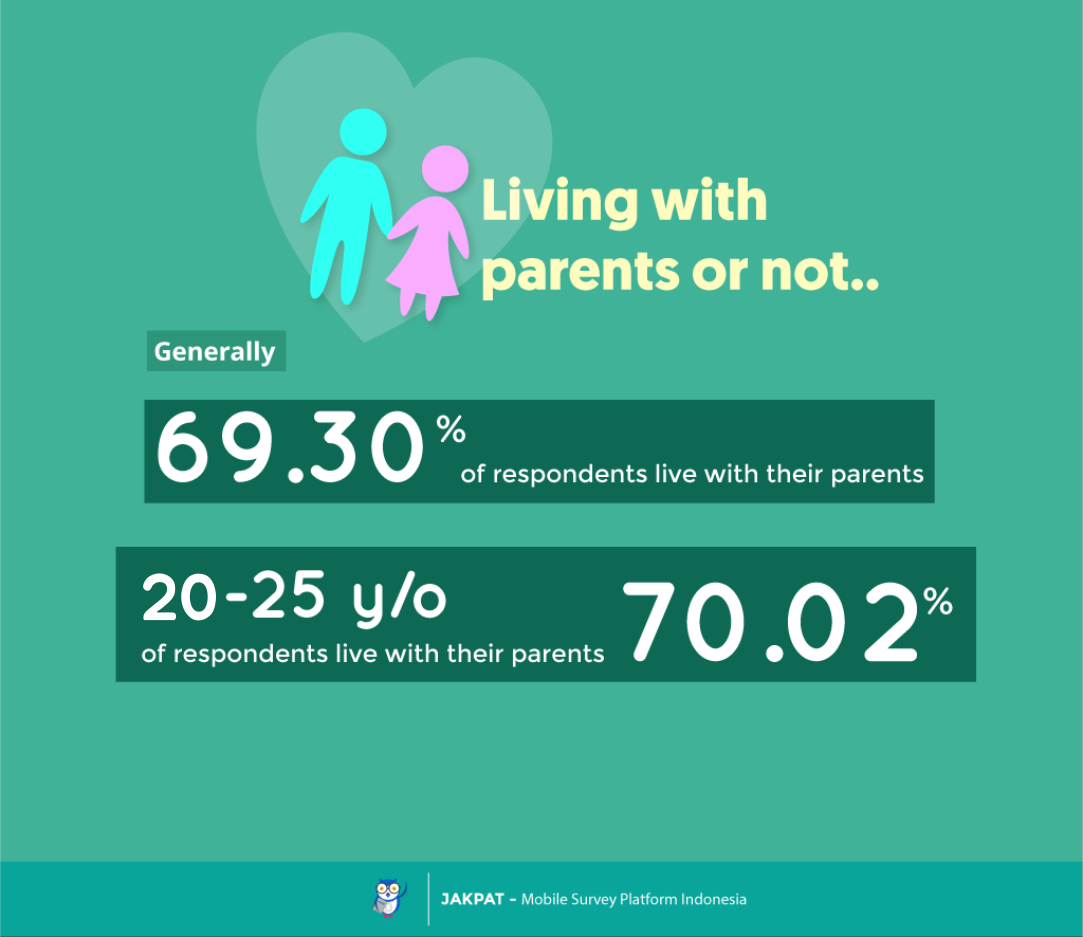
MOST RESPONDENTS LIVE WITH THEIR PARENTS
| Q1 (single answer) : Do you live with your parents? | Total | Gender | Age Range | |||
| Male | Female | 20-25 | 26-29 | 30-35 | ||
| Option 1 : Yes, i live with my parents in my parents’ home | 368 | 162 | 206 | 313 | 52 | 3 |
| 69,30% | 66,39% | 71,78% | 70,02% | 66,67% | 50,00% | |
| Option 2 : No, i rent a home | 13 | 7 | 6 | 11 | 1 | 1 |
| 2,45% | 2,87% | 2,09% | 2,46% | 1,28% | 16,67% | |
| Option 3 : No, i live in a boarding house (Kost) | 138 | 70 | 68 | 113 | 24 | 1 |
| 25,99% | 28,69% | 23,69% | 25,28% | 30,77% | 16,67% | |
| Option 4 : No, i have my own home | 12 | 5 | 7 | 10 | 1 | 1 |
| 2,26% | 2,05% | 2,44% | 2,24% | 1,28% | 16,67% | |
| Total | 531 | 244 | 287 | 447 | 78 | 6 |
| 100,00% | 100,00% | 100,00% | 100,00% | 100,00% | 100,00% | |
As we can see on the table above, totally, 68.30% of respondents live with their parents in their parents’ homes. Higher percentage is on female respondents (71.78%) and respondents who are 20-25 y/o (70.02).
HOW ABOUT THEIR FUTURE PLANS?
![2[revisi-font-size]](https://blog.jakpat.net/wp-content/uploads/2015/06/2revisi-font-size.png)
AROUND 25-26 Y/O IS THE MOST PREFERRED AGE FOR BUYING HOME
| Q2 (single answer) : Do you want to buy your own home? If yes, when do you plan to buy your own home? | Total | Gender | ||||
| Male | Female | 20-25 | 26-29 | 30-35 | ||
| Option 1 : I will buy one when i’m 21-22 y/o | 4 | 1 | 3 | 4 | 0 | 0 |
| 0,77% | 0,42% | 1,07% | 0,92% | 0,00% | 0,00% | |
| Option 2 : I will buy one when i’m 23-24 y/o | 48 | 26 | 22 | 47 | 1 | 0 |
| 9,25% | 10,88% | 7,86% | 10,76% | 1,30% | 0,00% | |
| Option 3 : I will buy one when i’m 25-26 y/o | 157 | 59 | 98 | 157 | 0 | 0 |
| 30,25% | 24,69% | 35,00% | 35,93% | 0,00% | 0,00% | |
| Option 4 : I will buy one when i’m 27-28 y/o | 126 | 58 | 68 | 113 | 13 | 0 |
| 24,28% | 24,27% | 24,29% | 25,86% | 16,88% | 0,00% | |
| Option 5 : I will buy one when i’m 29-30 y/o | 101 | 50 | 51 | 70 | 31 | 0 |
| 19,46% | 20,92% | 18,21% | 16,02% | 40,26% | 0,00% | |
| Option 6 : I will buy one when i’m 31-32 y/o | 37 | 24 | 13 | 18 | 17 | 2 |
| 7,13% | 10,04% | 4,64% | 4,12% | 22,08% | 40,00% | |
| Option 7 : I will buy one when i’m 33-34 y/o | 13 | 6 | 7 | 6 | 6 | 1 |
| 2,50% | 2,51% | 2,50% | 1,37% | 7,79% | 20,00% | |
| Option 8 : I will buy one when i’m 35-36 y/o | 10 | 4 | 6 | 6 | 4 | 0 |
| 1,93% | 1,67% | 2,14% | 1,37% | 5,19% | 0,00% | |
| Option 9 : I will buy one when i’m 37-38 y/o | 2 | 1 | 1 | 2 | 0 | 0 |
| 0,39% | 0,42% | 0,36% | 0,46% | 0,00% | 0,00% | |
| Option 10 : I will buy one when i’m 39-40 y/o | 2 | 1 | 1 | 1 | 0 | 1 |
| 0,39% | 0,42% | 0,36% | 0,23% | 0,00% | 20,00% | |
| Option 11 : I will buy one when i’m > 40 y/o | 4 | 3 | 1 | 3 | 0 | 1 |
| 0,77% | 1,26% | 0,36% | 0,69% | 0,00% | 20,00% | |
| Option 12 : No, i don’t want to buy a house | 5 | 4 | 1 | 3 | 2 | 0 |
| 0,96% | 1,67% | 0,36% | 0,69% | 2,60% | 0,00% | |
| Option 13 : Other | 10 | 2 | 8 | 7 | 3 | 0 |
| 1,93% | 0,84% | 2,86% | 1,60% | 3,90% | 0,00% | |
| Total | 519 | 239 | 280 | 437 | 77 | 5 |
| 100,00% | 100,00% | 100,00% | 100,00% | 100,00% | 100,00% | |
Even though we did not get one majority choice, but generally, most respondents say that they want to buy a home when they are around 25-26 y/o (30.25%). There is no difference between female and male respondents; most of them also say that they plan to have a home when they are around that age. Nevertheless, for those respondents who are 26-29 y/o, plan to have a home when they are around 29-30 y/o (40.26%).
SIMILAR TO BUYING HOME, RESPONDENTS PREFER BUYING CAR WHEN AROUND 25-25 Y/O
| Q4 (single answer) : Do you want to buy a car? if yes, when do you plan to buy? | Total | Gender | ||||
| Male | Female | 20-25 | 26-29 | 30-35 | ||
| Option 1 : I will buy one when i’m 21-22 y/o | 16 | 6 | 10 | 15 | 1 | 0 |
| 3,01% | 2,46% | 3,48% | 3,36% | 1,28% | 0,00% | |
| Option 2 : I will buy one when i’m 23-24 y/o | 72 | 28 | 44 | 72 | 0 | 0 |
| 13,56% | 11,48% | 15,33% | 16,11% | 0,00% | 0,00% | |
| Option 3 : I will buy one when i’m 25-26 y/o | 113 | 44 | 69 | 112 | 1 | 0 |
| 21,28% | 18,03% | 24,04% | 25,06% | 1,28% | 0,00% | |
| Option 4 : I will buy one when i’m 27-28 y/o | 90 | 43 | 47 | 84 | 6 | 0 |
| 16,95% | 17,62% | 16,38% | 18,79% | 7,69% | 0,00% | |
| Option 5 : I will buy one when i’m 29-30 y/o | 83 | 39 | 44 | 65 | 18 | 0 |
| 15,63% | 15,98% | 15,33% | 14,54% | 23,08% | 0,00% | |
| Option 6 : I will buy one when i’m 31-32 y/o | 52 | 26 | 26 | 33 | 17 | 2 |
| 9,79% | 10,66% | 9,06% | 7,38% | 21,79% | 33,33% | |
| Option 7 : I will buy one when i’m 33-34 y/o | 20 | 13 | 7 | 10 | 9 | 1 |
| 3,77% | 5,33% | 2,44% | 2,24% | 11,54% | 16,67% | |
| Option 8 : I will buy one when i’m 35-36 y/o | 20 | 12 | 8 | 11 | 8 | 1 |
| 3,77% | 4,92% | 2,79% | 2,46% | 10,26% | 16,67% | |
| Option 9 : I will buy one when i’m 37-38 y/o | 4 | 0 | 4 | 2 | 2 | 0 |
| 0,75% | 0,00% | 1,39% | 0,45% | 2,56% | 0,00% | |
| Option 10 : I will buy one when i’m 39-40 y/o | 2 | 2 | 0 | 1 | 0 | 1 |
| 0,38% | 0,82% | 0,00% | 0,22% | 0,00% | 16,67% | |
| Option 11 : I will buy one when i’m > 40 y/o | 6 | 4 | 2 | 5 | 1 | 0 |
| 1,13% | 1,64% | 0,70% | 1,12% | 1,28% | 0,00% | |
| Option 12 : No, i don’t want to buy a car | 13 | 7 | 6 | 7 | 6 | 0 |
| 2,45% | 2,87% | 2,09% | 1,57% | 7,69% | 0,00% | |
| Option 13 : No, i don’t want to buy a car because i already have one | 26 | 12 | 14 | 19 | 7 | 0 |
| 4,90% | 4,92% | 4,88% | 4,25% | 8,97% | 0,00% | |
| Option 14 : Other | 14 | 8 | 6 | 11 | 2 | 1 |
| 2,64% | 3,28% | 2,09% | 2,46% | 2,56% | 16,67% | |
As shown on the table above, there is no majority answer from respondents. But, overall, the highest percentage is on 25-26 y/o (21.28%). For respondents (26-29 y/o), they intend to buy a car when they are 29-30 y/o (23.08%).
25-26 Y/O ALSO IS THE AGE MOST RESPONDENTS PREFER TO GET MARRIED
| Q5 (single answer) : When do you plan to get married? | Total | Gender | ||||
| Male | Female | 20-25 | 26-29 | 30-35 | ||
| Option 1 : When i’m 21-22 y/o | 8 | 2 | 6 | 8 | 0 | 0 |
| 1,51% | 0,82% | 2,09% | 1,79% | 0,00% | 0,00% | |
| Option 2 : When i’m 23-24 y/o | 70 | 17 | 53 | 68 | 1 | 1 |
| 13,18% | 6,97% | 18,47% | 15,21% | 1,28% | 16,67% | |
| Option 3 : When i’m 25-26 y/o | 207 | 71 | 136 | 203 | 4 | 0 |
| 38,98% | 29,10% | 47,39% | 45,41% | 5,13% | 0,00% | |
| Option 4 : When i’m 27-28 y/o | 143 | 78 | 65 | 113 | 30 | 0 |
| 26,93% | 31,97% | 22,65% | 25,28% | 38,46% | 0,00% | |
| Option 5 : When i’m 29-30 y/o | 63 | 48 | 15 | 34 | 27 | 2 |
| 11,86% | 19,67% | 5,23% | 7,61% | 34,62% | 33,33% | |
| Option 6 : When i’m 31-32 y/o | 19 | 14 | 5 | 7 | 9 | 3 |
| 3,58% | 5,74% | 1,74% | 1,57% | 11,54% | 50,00% | |
| Option 7 : When i’m 33-34 y/o | 5 | 5 | 0 | 1 | 4 | 0 |
| 0,94% | 2,05% | 0,00% | 0,22% | 5,13% | 0,00% | |
We asked this question using single answer question type, thus respondents only can choose one answer. It turned out that even though not a majority answer, but most respondents say they plan to get married when around 25-26 y/o (38.98%). Male respondents prefer getting married when they are around 27-28 y/o (31.97%). While female respondents prefer 25-26 y/o for getting married (47.39%). Those who are 26-29 y/o say that they plan to get married when they are around 27-30 y/o.
AROUND 27-28 Y/O IS THE MOST PREFERRED AGE FOR HAVING CHILDREN
| Q6 (single answer) : When do you plan to have a child? | Total | Gender | ||||
| Male | Female | 20-25 | 26-29 | 30-35 | ||
| Option 1 : When i’m 21-22 y/o | 3 | 0 | 3 | 3 | 0 | 0 |
| 0,56% | 0,00% | 1,05% | 0,67% | 0,00% | 0,00% | |
| Option 2 : When i’m 23-24 y/o | 23 | 5 | 18 | 23 | 0 | 0 |
| 4,33% | 2,05% | 6,27% | 5,15% | 0,00% | 0,00% | |
| Option 3 : When i’m 25-26 y/o | 128 | 37 | 91 | 125 | 2 | 1 |
| 24,11% | 15,16% | 31,71% | 27,96% | 2,56% | 16,67% | |
| Option 4 : When i’m 27-28 y/o | 196 | 75 | 121 | 174 | 22 | 0 |
| 36,91% | 30,74% | 42,16% | 38,93% | 28,21% | 0,00% | |
| Option 5 : When i’m 29-30 y/o | 94 | 56 | 38 | 72 | 22 | 0 |
| 17,70% | 22,95% | 13,24% | 16,11% | 28,21% | 0,00% | |
| Option 6 : When i’m 31-32 y/o | 56 | 45 | 11 | 33 | 19 | 4 |
| 10,55% | 18,44% | 3,83% | 7,38% | 24,36% | 66,67% | |
| Option 7 : When i’m 33-34 y/o | 18 | 17 | 1 | 9 | 9 | 0 |
| 3,39% | 6,97% | 0,35% | 2,01% | 11,54% | 0,00% | |
In spite of gender difference, overall, most respondents say that they plan to have a child when around 27-28 y/o (36.91%). Around 25-26 y/o also is preferred age for having children by some respondents who are around 20-25 y/o (27.96%).
HOW IMPORTANT ARE THESE FOR THEM?
![3[revisi-size]](https://blog.jakpat.net/wp-content/uploads/2015/06/3revisi-size.png)
THEY SAY THAT HAVING A CAR IS IMPORTANT, BUT NOT A BIG PRIORITY
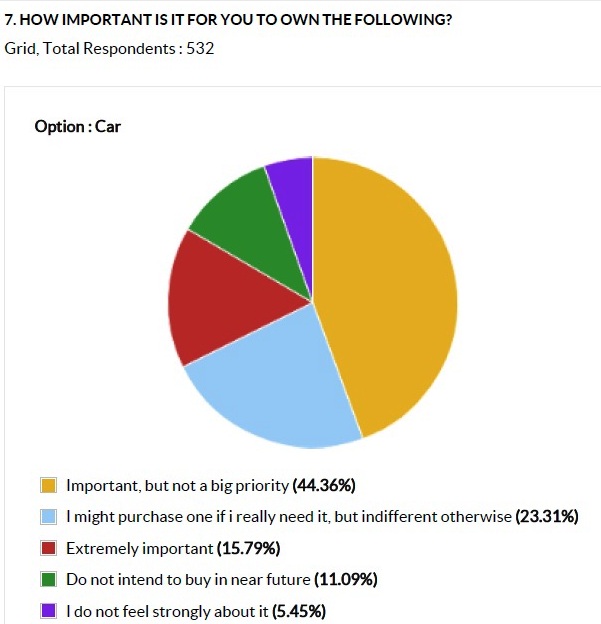
We also wondered how respondents prioritize some things in their lives. First question is about car ownership, and most of respondents say that having a car is important, but not a big priority (44.36%).
THEY DO NOT FEEL STRONGLY ABOUT HAVING A LUXURY BAG
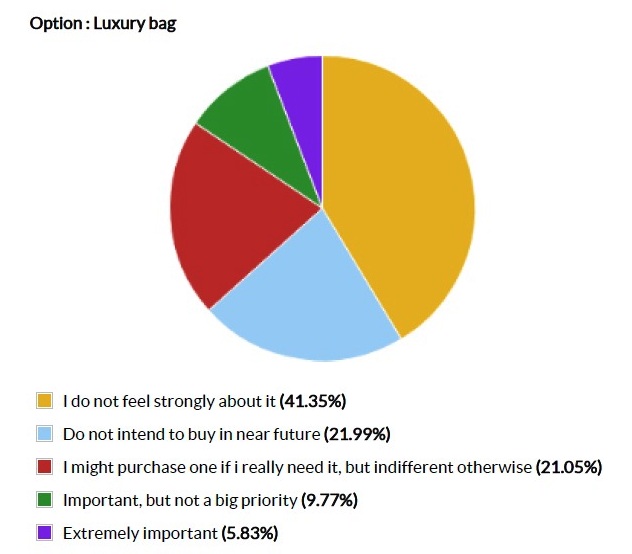
Having a luxury bag for most respondents is very not important (41.35%), and 21.99% of respondents say that they do not intend to buy in the near future.
TV IS IMPORTANT, BUT NOT A BIG PRIORITY FOR MOST RESPONDENTS
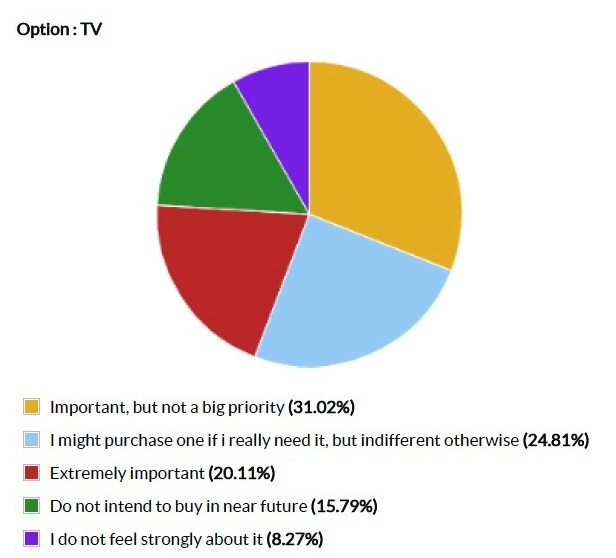
Even though there is no majority answer in this question, but most respondents think that having TV is important but not a big priority (31.02%). Almost 25% of respondents also think that they might purchase one if they really need it, but indifferently otherwise.
RESPONDENTS MIGHT PURCHASE A NEW LAPTOP IF THEY NEED IT
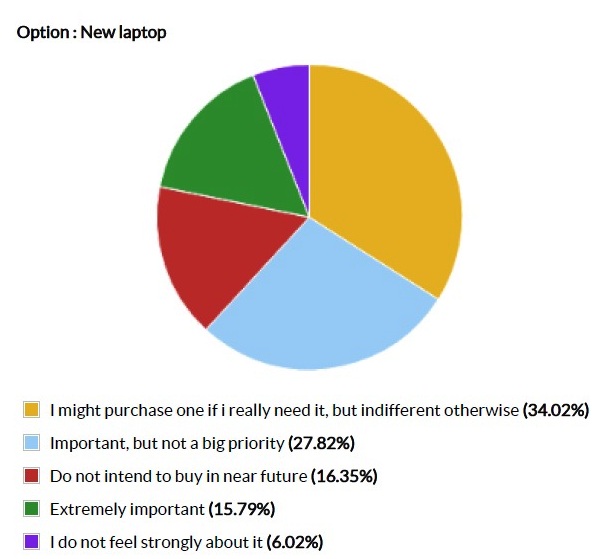
New laptop for our respondents is quite important, but if they do not really need it, they will not buy it (34.02%). 27.82% of respondents think that new laptop is important, but not a big priority.
SIMILAR TO NEW LAPTOP, THEY NEED TO BUY A NEW SMARTPHONE ALSO DEPENDS ON THE NECESSITY
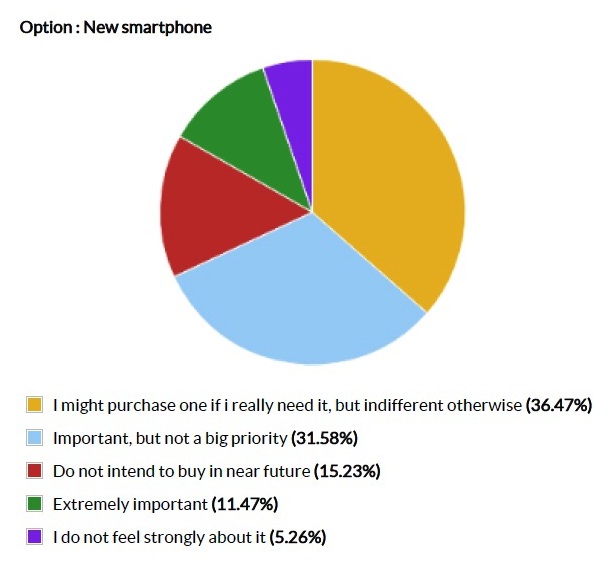
After seeing those answers relating to gadget, we can conclude that new gadgets for respondents are important if they think that they need it.
HAVING HOUSE IS VERY IMPORTANT FOR OUR RESPONDENTS
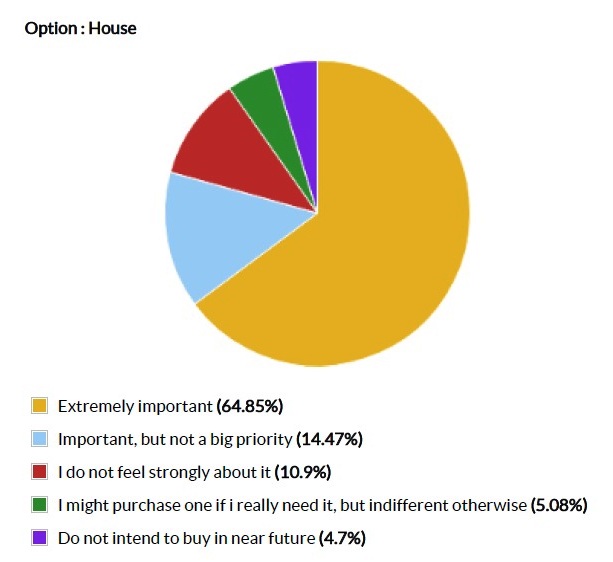
The need of having house is extremely important for respondents as 64.85% of respondents say it very important. Thus, besides those aforementioned things, the most important for our respondents is having a house.
For more detail you can download XLS report at the button below. JAKPAT report consists of 3 parts which are 1) Respondent Profile, 2) Crosstabulation for each question and 3) Raw Data. Respondent profile shows you demographic profiles ( gendr,age range, locationby province, and monthly spending). Cross tabulation enables you to define different demographic segment preference on each answer.
![]()
Click the icon to download XLS report
And also PDF Report here:
http://www.slideshare.net/JAKPATAPP/outlook-of-millennial-survey-report
Ready to Send A Survey?

or Get A Sales Quote by filling this form or Call to +622745015293
