


Previously, we explained about millennials’ plans relating to their future basic needs. Now, we will explore more their online shopping behavior, opinion towards brands and smartphone Inflatable water slide for sale Canada usage. Firstly, we asked them whether they usually do a research before purchasing or not.
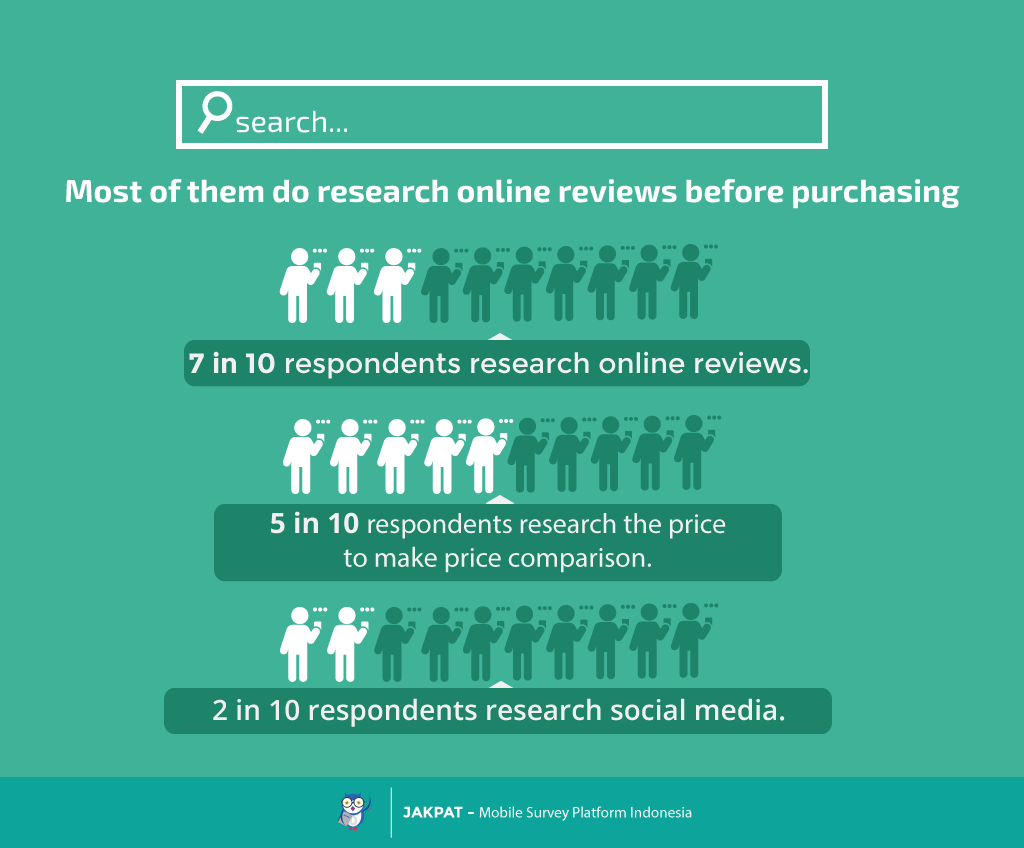
1. MAJORITY OF RESPONDENTS DO RESEARCH SOME ONLINE REVIEWS BEFORE PURCHASING
| Q8 (multiple answer) : Do you usually research the product/service before purchasing? if no, choose “no” option | Total | Gender | Age Range | |||
| Male | Female | 20-25 | 26-29 | 30-35 | ||
| Option 1 : Yes, i research some online reviews before purchasing | 393 | 193 | 200 | 324 | 65 | 4 |
| 74,01% | 79,10% | 69,69% | 72,48% | 83,33% | 66,67% | |
| Option 2 : Yes, i research some social media before purchasing | 150 | 75 | 75 | 129 | 20 | 1 |
| 28,25% | 30,74% | 26,13% | 28,86% | 25,64% | 16,67% | |
| Option 3 : Yes, i research the price to make price comparison before purchasing | 274 | 123 | 151 | 231 | 42 | 1 |
| 51,60% | 50,41% | 52,61% | 51,68% | 53,85% | 16,67% | |
| Option 4 : No, i don’t research before purchasing | 20 | 10 | 10 | 15 | 3 | 2 |
| 3,77% | 4,10% | 3,48% | 3,36% | 3,85% | 33,33% | |
| Option 5 : Other | 1 | 1 | 0 | 0 | 1 | 0 |
| 0,19% | 0,41% | 0,00% | 0,00% | 1,28% | 0,00% | |
| Total | 838 | 402 | 436 | 699 | 131 | 8 |
| 157,82% | 164,75% | 151,92% | 156,38% | 167,95% | 133,33% | |
As shown on table above, generally, 74.01% of respondents research some online reviews and around a quarter of respondents also research some social media (28.25%). The highest percentage is on 26-29 y/o age range (83.33%), in which those respondents need information on online reviews most. Besides online reviews, research on price comparison is often conducted by respondents (51.60%).
2. FEMALE NEEDS MORE TIME FOR MAKING A PURCHASE
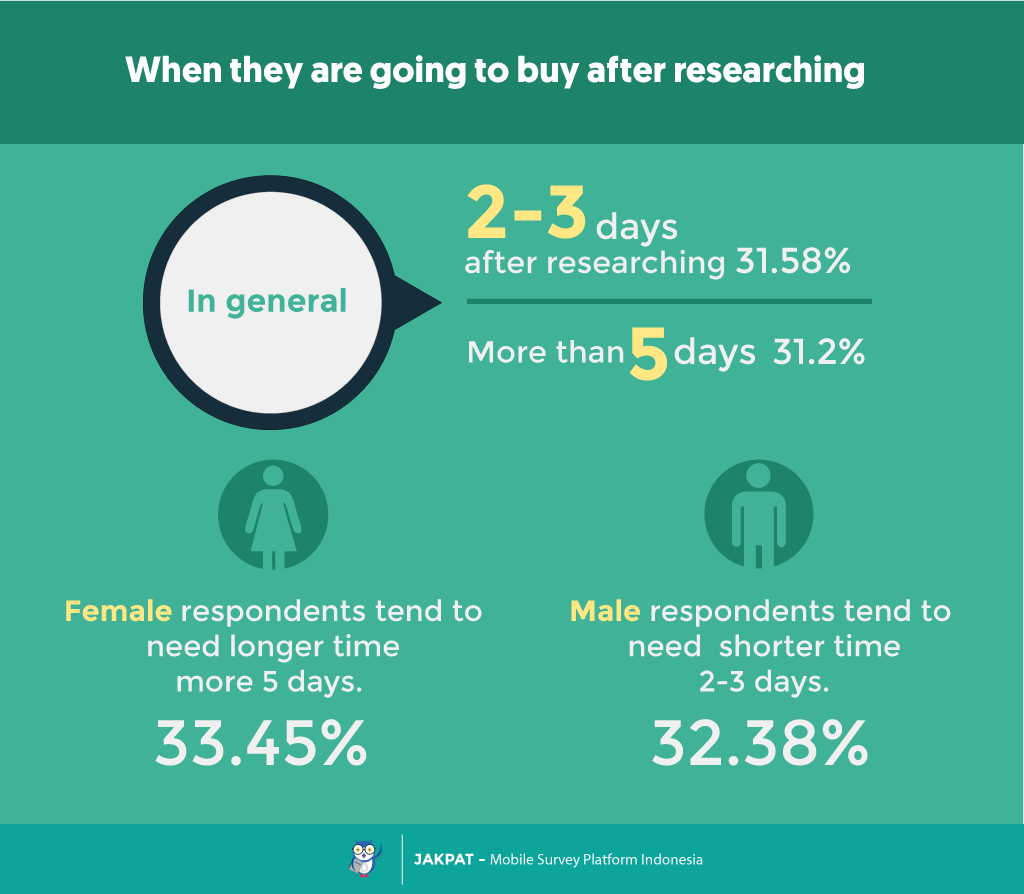 Even though there is no majority choice for making a purchase after researching, but more than 30% of respondents purchase after 2-3 days and around more than 5 days. The interesting fact we found here are female tends to need more time before purchasing (> 5 days), while male tends to need a couple of days for making a purchase (2-3 days).
3. RESPONDENTS TEND TO BUY BRANDED PRODUCT WHEN SHOPPING
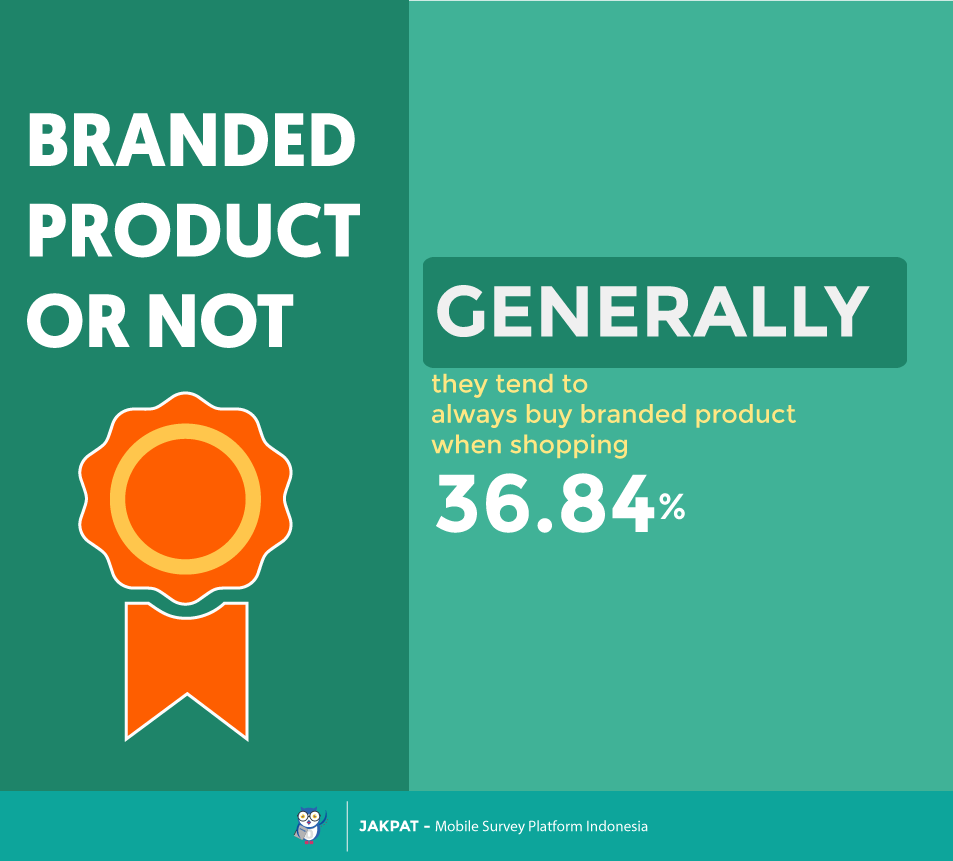 We also were curious about their preference towards branded product, thus we gave a scale question to know how important branded product for them is. As shown on the table above, no majority answer that we obtained. Nevertheless, around 35% of respondents tend to agree to buy branded products. Moreover, most respondents (30-35 y/o) tend to buy branded product (83.33%), and almost 50% of respondents (26-29 y/o) also do too.4. DO THEY LIKE BRANDS USING SOCIAL MEDIA?
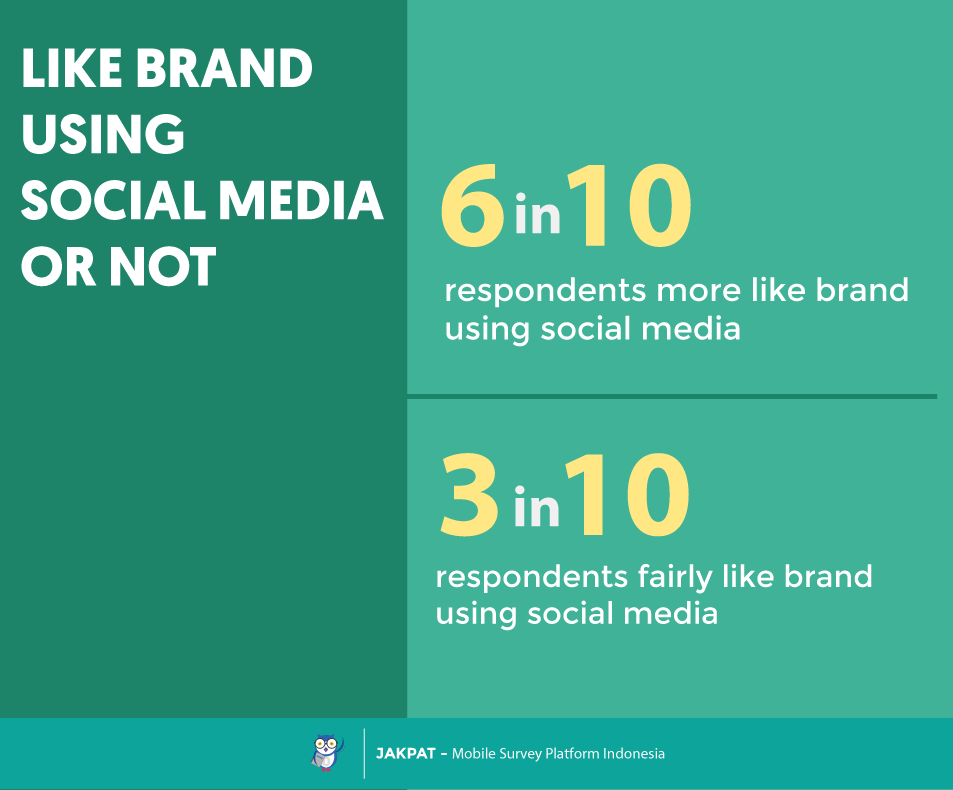 How do they respond to brands using social media? When asked this question, 6 in 10 respondents tend to like the brands using social media. And only 3 in 10 respondents tend to not like brands using social media.
5. WHAT MAKES THEM MORE LOYAL TO A BRAND?
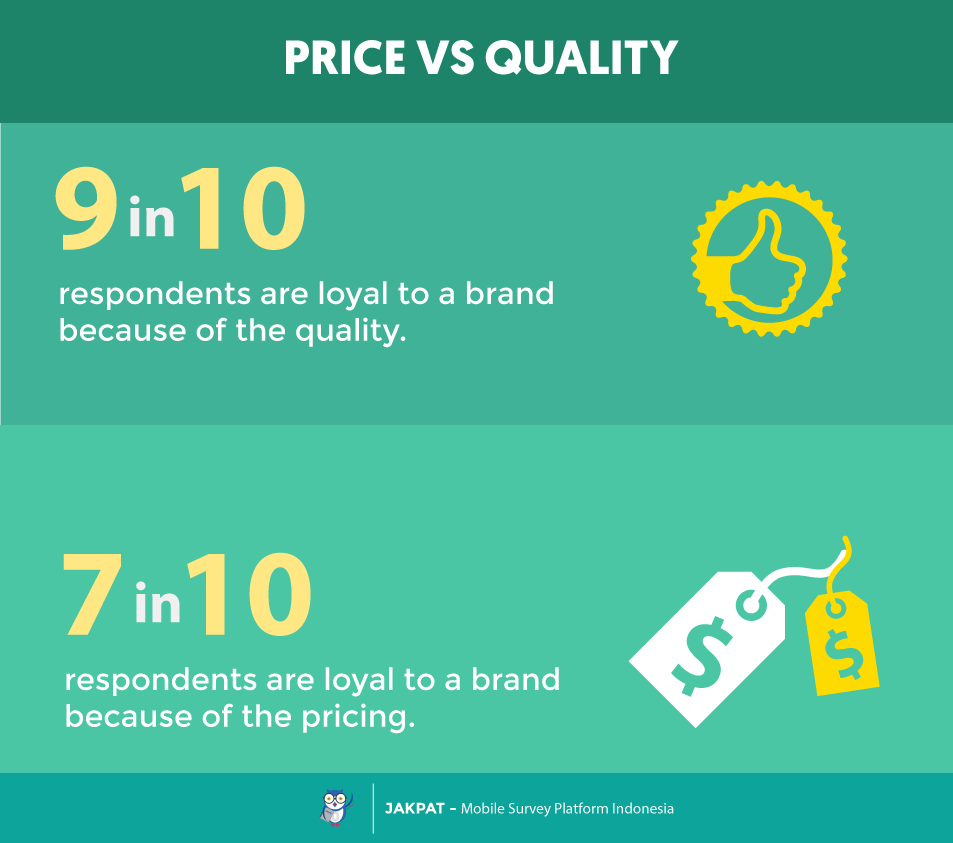 We wanted to know between price and quality which one makes them more loyal. Thus, we asked them using grid question. We found that most respondents become loyal to a brand because of quality of brand.
6. THE EFFECT OF PEER RECOMMENDATION
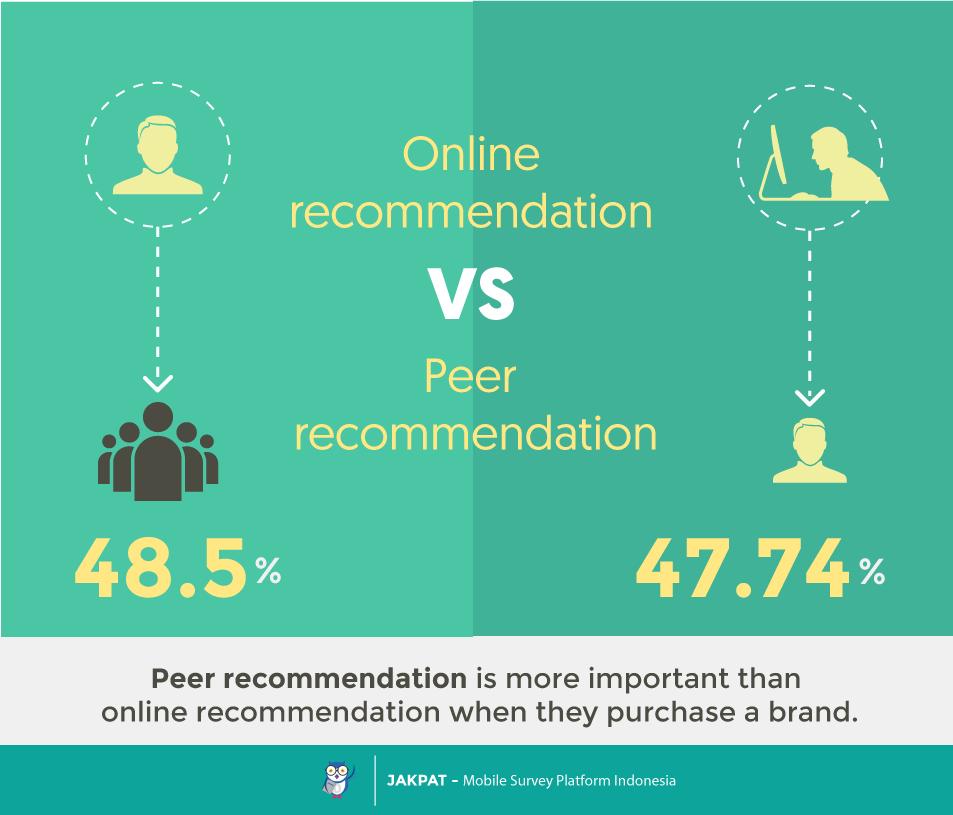 Respondents say that peer recommendation is more important than online recommendation/review. It shows that, even though majority of respondents research some online reviews, they will be more influenced by peer recommendation.
7. WILL RESPONDENTS PROMOTE OR WRITE ONLINE RECOMMENDATION AFTER PURCHASING?
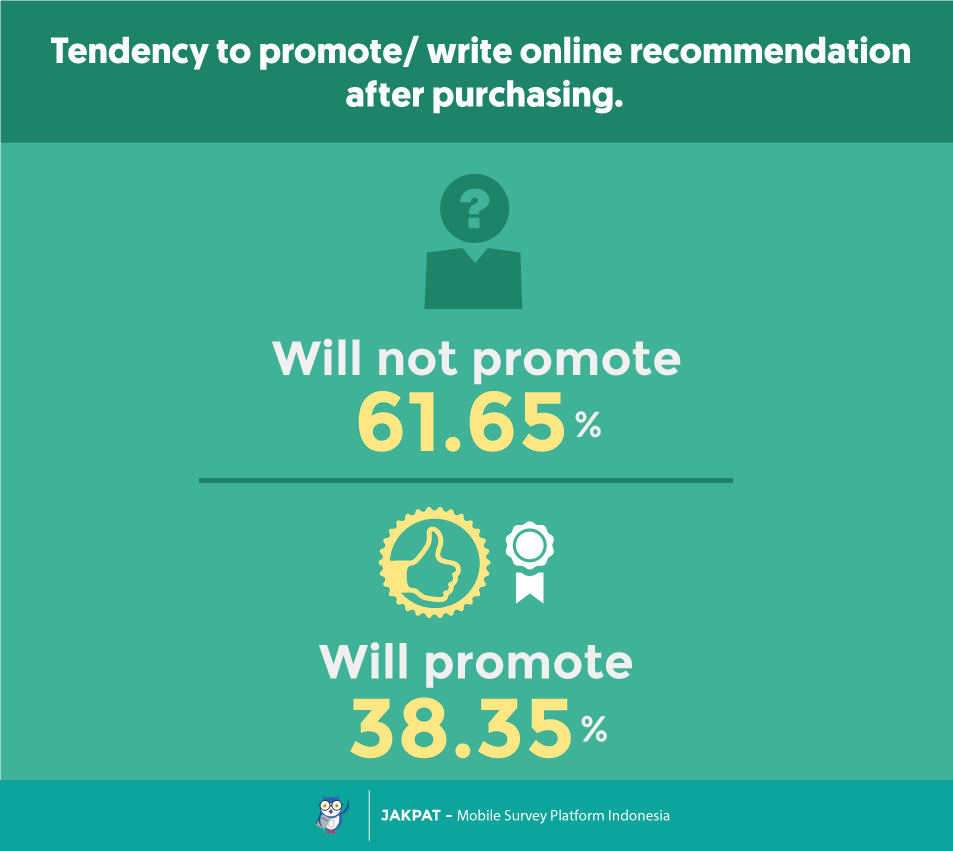 When asked this question, majority of respondents say they will not promote/ write online recommendation after purchasing (60.65%). And only 38.35% of respondents will promote/ write online recommendation.
8. HOW THE INTERACTIONS BETWEEN RESPONDENTS AND BRAND USING SOCIAL MEDIA ARE
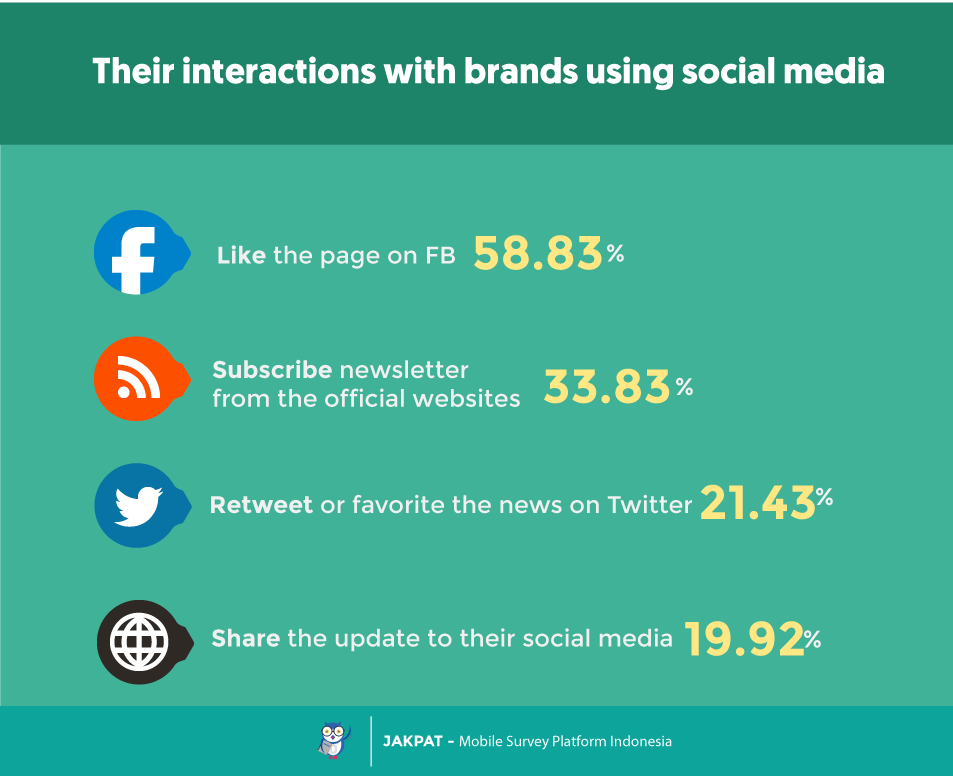 We also were curious in knowing their interaction with brand using social media. Thus, we asked this question regarding the matter. It shows that majority of respondents like the page of brand on FB (58.83%). Other activities done by respondents are: (1) subscribe newsletter from the official websites; (2) retweet or favorite the news on Twitter; and (3) share the update on their social media.
9. HOW RESPONDENTS DEFINE “HEALTHY”
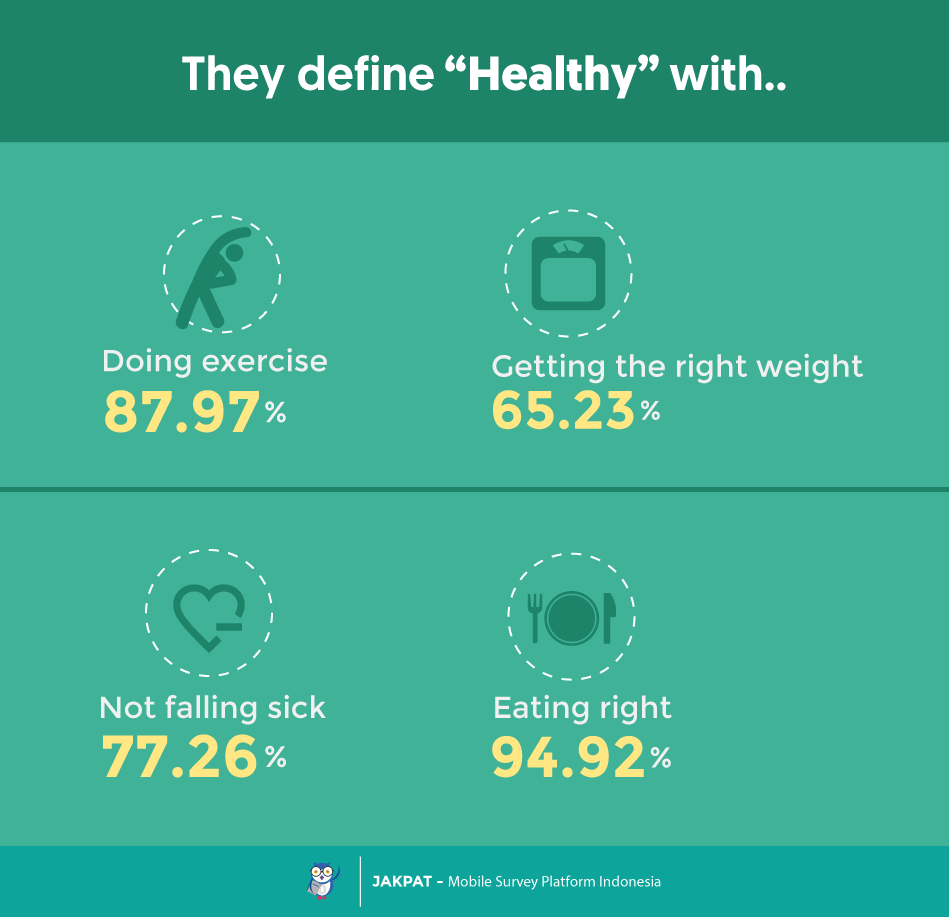
People may have different definition for “healthy”. Thus, we also wondered how they define “healthy”. We found that majority of respondents define “healthy” by eating right (94.92%). And getting the right weight is the least option they choose to define healthy.
10. EATING HEALTHY FOOD IS VERY IMPORTANT FOR RESPONDENTS
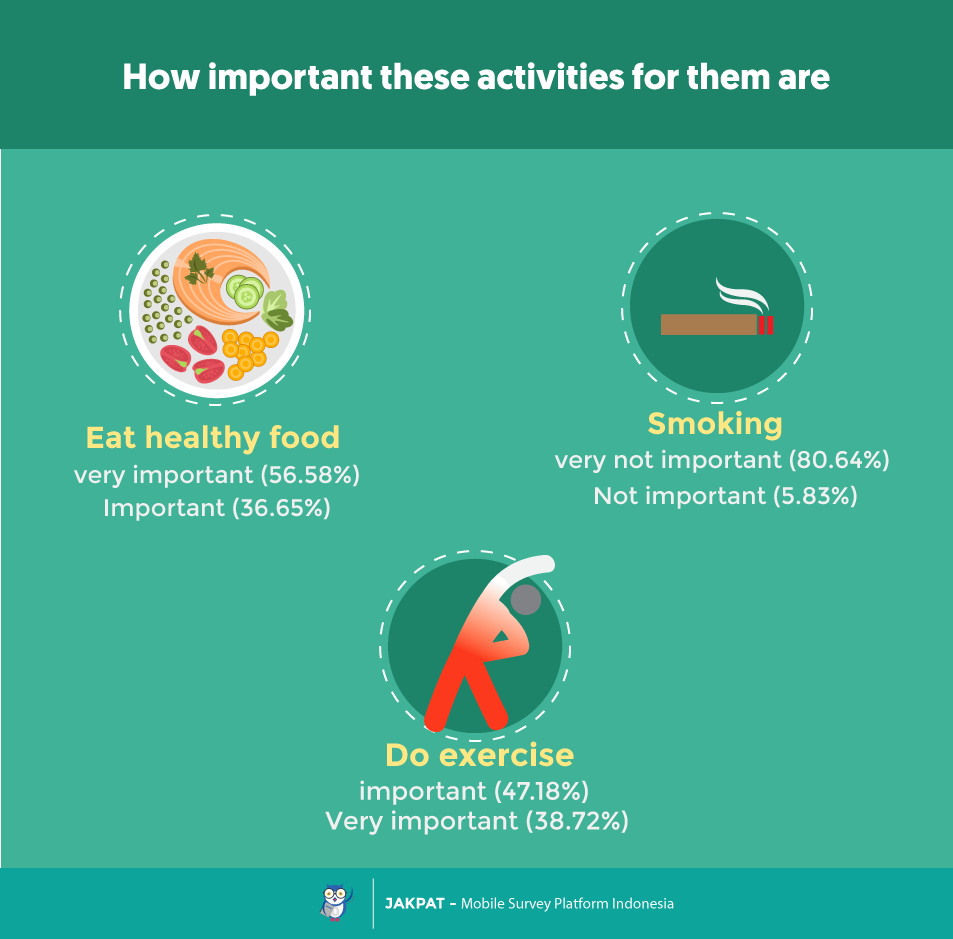 We provided some activities on the question, and then the respondents can choose which one the most important for them is. It turned out that eating healthy food is very important for them (56.58%). Besides eating healthy food, doing exercise also is important for them (47.18%).
11. WHAT RESPONDENTS DO WITH THEIR DEVICES
 By using grid question type, we asked the respondents the activities they often do with their devices. For most of all activities, they do with their smartphones, even if they have other devices besides smartphone. You can see the detail on the infograophic above.
12. SMARTPHONE IS USED LONGEST IN A DAY
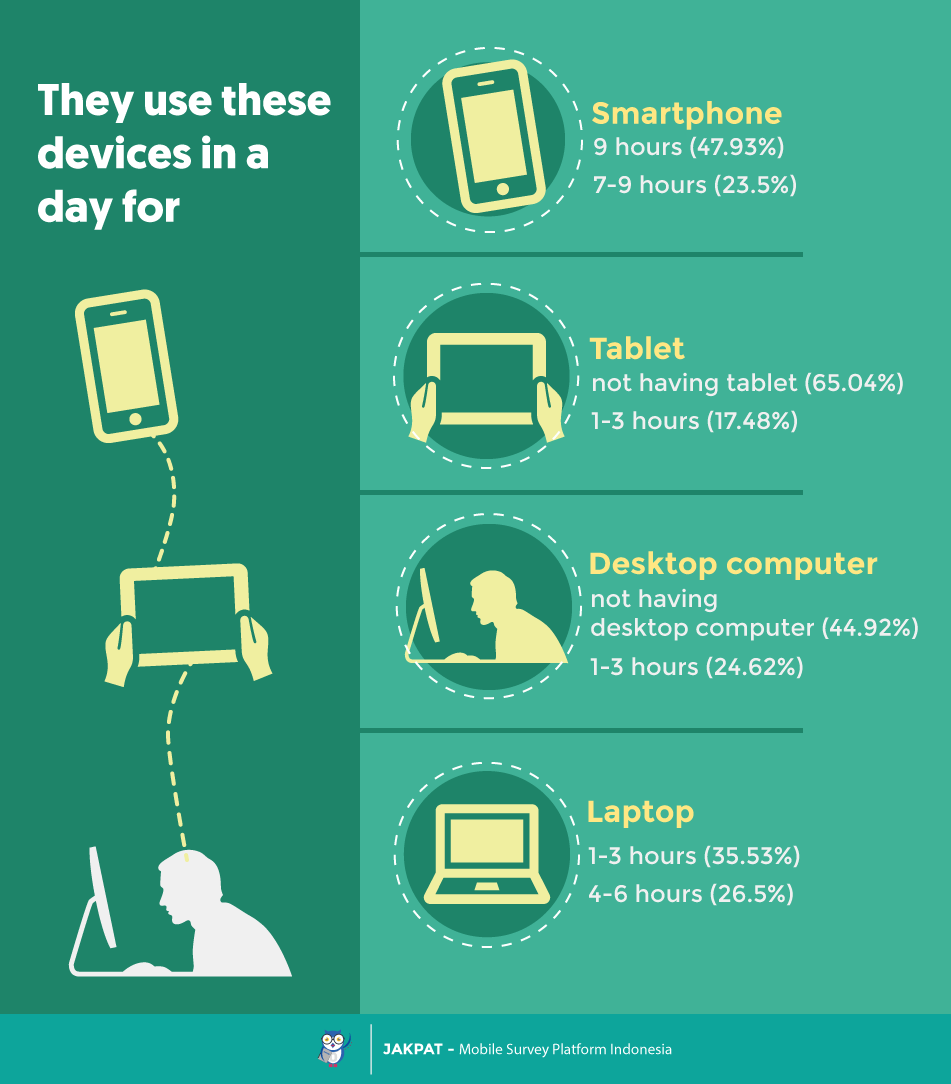 In spite of having some devices, respondents still use their smartphone most in a day: more than 9 hours (47.93%). They still use other devices in a day, but not as often as smartphone.
13. THEIR ACTIVITIES FREQUENCY
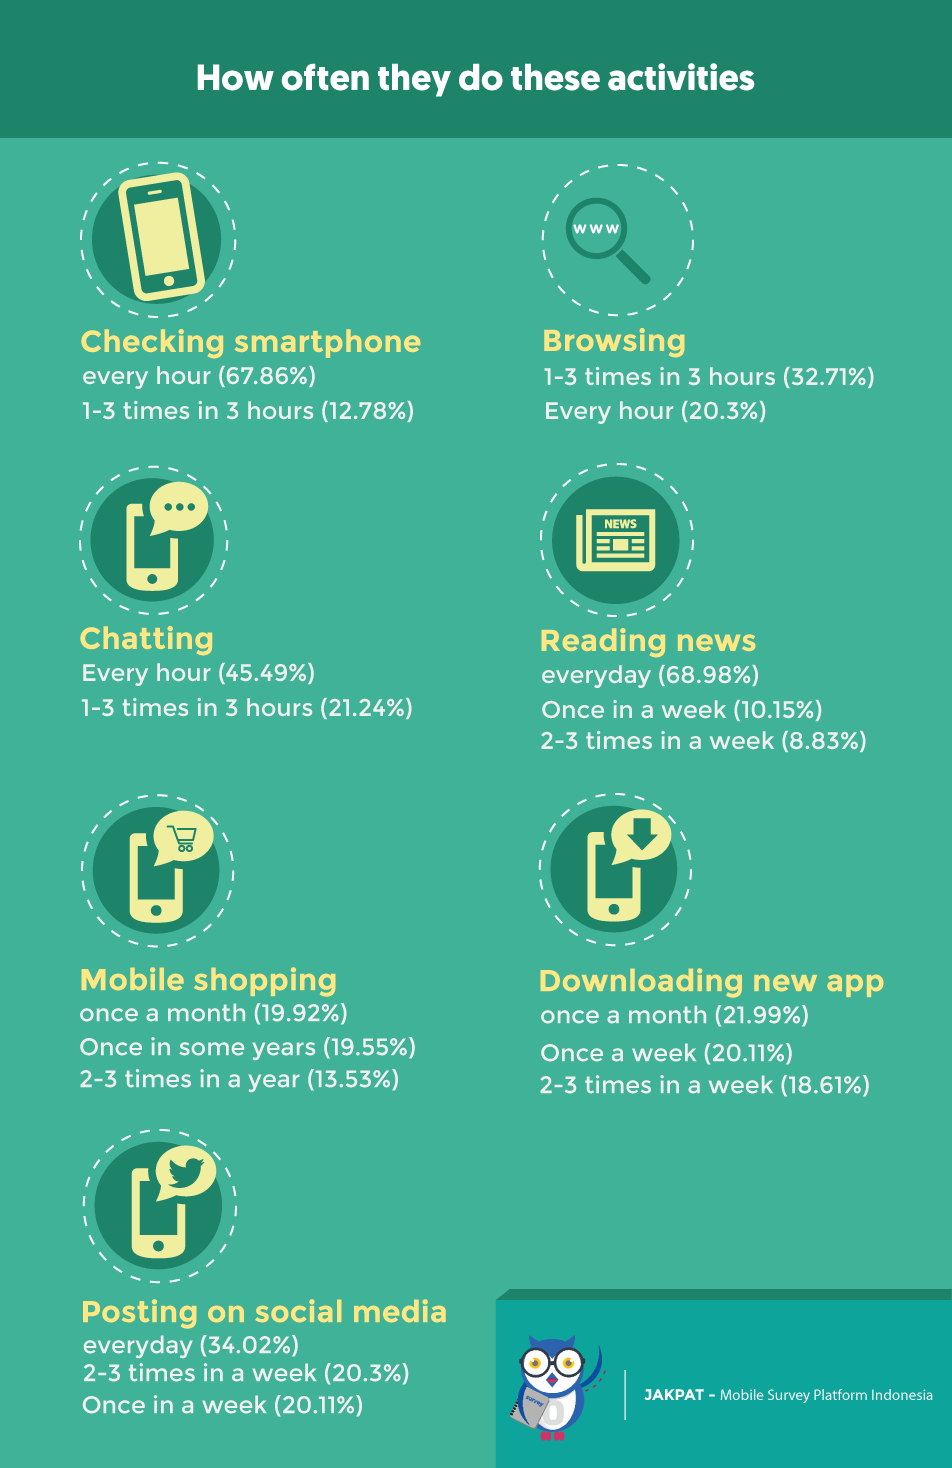 We asked several activities to our respondents. And it turned out that checking smartphone and chatting are done every hour by most respondents. Other activities such as reading news and posting on social media are done every day by most respondents. Mobile shopping and downloading new app are done once a month by most respondents. Browsing also is done by respondents, at least once a day.
For more detail you can download XLS report at the button below. JAKPAT report consists of 3 parts which are 1) Respondent Profile, 2) Crosstabulation for each question and 3) Raw Data. Respondent profile shows you demographic profiles ( gendr,age range, locationby province, and monthly spending). Cross tabulation enables you to define different demographic segment preference on each answer.
![]()
Click the icon to download XLS report
And also PDF Report here:
http://www.slideshare.net/JAKPATAPP/outlook-of-millennial-survey-report
Ready to Send A Survey?

or Get A Sales Quote by filling this form or Call to +622745015293
