

Population of Indonesia is dominated by Moslem citizen, where 87.18% of Indonesian citizens are Moslem (Badan Pusat Statistik, 2011). In spite of high population of Moslem citizen, Indonesia also has other religions: Christian, Catholic, Hinduism, Buddhism and Konghucu. Because Moslem is the largest followed religion in Indonesia, there is an institution, called MUI, having right for giving Halal certification on consumption products. Thus every consumption product traded in Indonesia should have Halal label to protect Moslem citizen from consuming non-Halal products.
Here, we, Jakpat conducted survey for Moslem millennial (20-30 y/o), questioning their concern over products/ services having Halal label. This survey is followed by 498 respondents: Inflatable water slide for sale Canada 257 male Moslem and 241 female Moslem respondents. First, we asked them whether they always consume products/ services having Halal label or not.
- +90% OF RESPONDENTS ALWAYS CONSUME PRODUCTS/ SERVICES HAVING HALAL LABEL
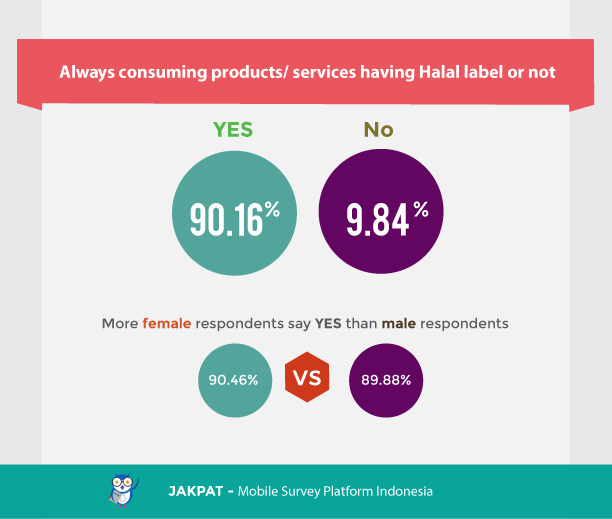
Generally 90.16% of respondents always consume Halal products/ services. Nevertheless, there are some differences on gender and age range columns. Based on gender, more female respondents consume Halal products/ services than male respondents (90.46%). And respondents (30-35 y/o) are the most respondents consuming Halal products/ services (94.74%).
- DIFFICULTY IN FINDING HALAL PRODUCTS/ SERVICES NOT ONLY FITTING THEIR TASTE BUT ALSO THEIR NEED IS THE MAIN PROBLEM
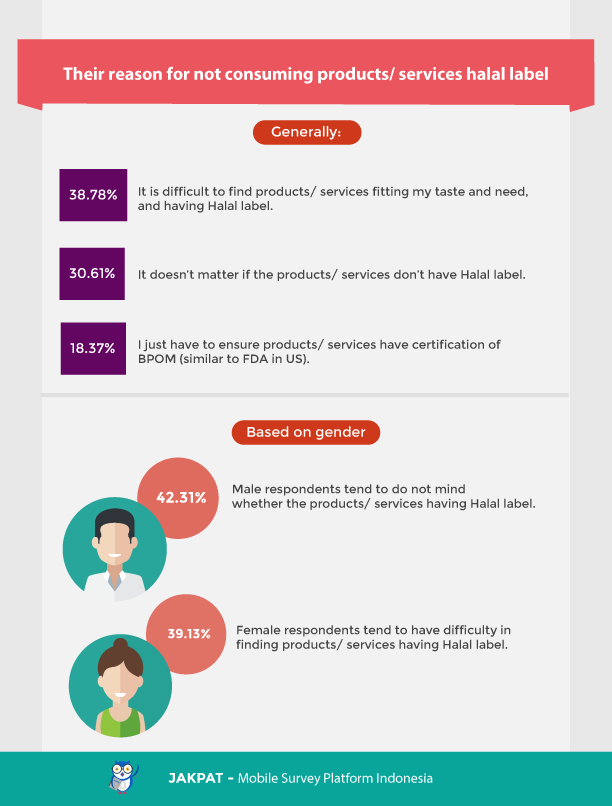
We were curious in knowing their reason for not always consuming Halal products/ services, thus we gave another question for them choosing “NO” on the previous question (Q1). Overall respondents say that they have difficulty in finding Halal products/ services fitting their taste and need (38.78%). Nevertheless, based on their gender, male and female respondents have different opinion. Male respondents tend to think that products/ services not having Halal label are don’t bother them (42.31%), while female respondents tend to prioritize their taste and need before buying the products/ services (39.13%).
- +80% OF RESPONDENTS ARE WILLING TO CHANGE THEIR PRODUCTS/ SERVICES IF THE THEY HAVE HALAL LABEL
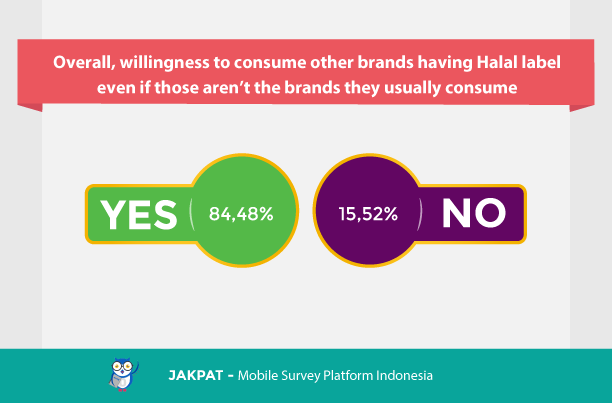
What will they do if there is another brand from the similar product/ service having Halal label? In general, they say that they will change their previously consumed brand into another brand having Halal Label (80.54%). It shows that Moslem respondents give good response to products having Halal label and fitting their need.
- HOW IMPORTANT ARE THESE PRODUCTS AND SERVICES FOR THEM?
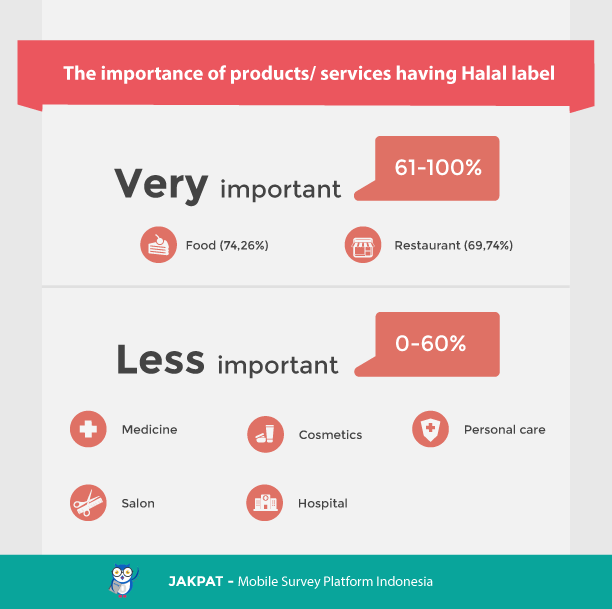
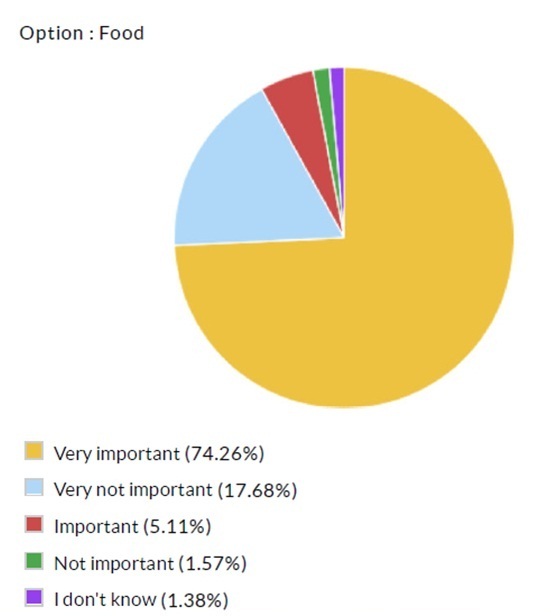
FOOD
They classify food as a very important product that must have Halal label.
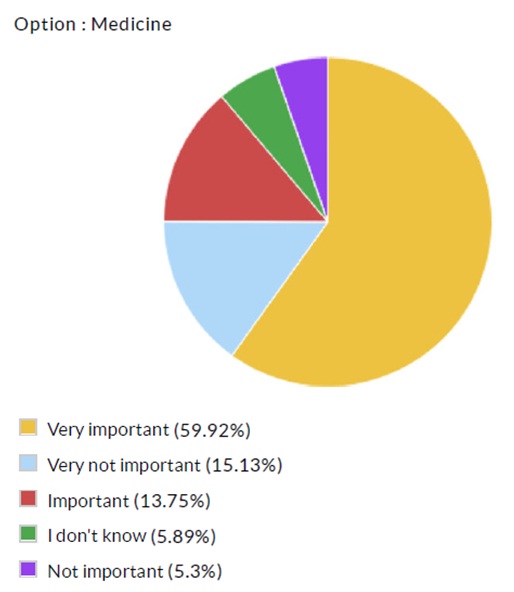
MEDICINE
We conclude that for our respondents, medicine is less important to have Halal label.
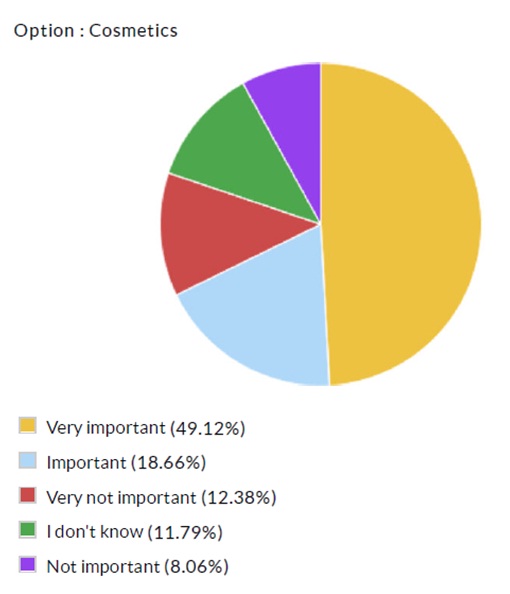
COSMETICS
They think that cosmetics are less important to have Halal label.
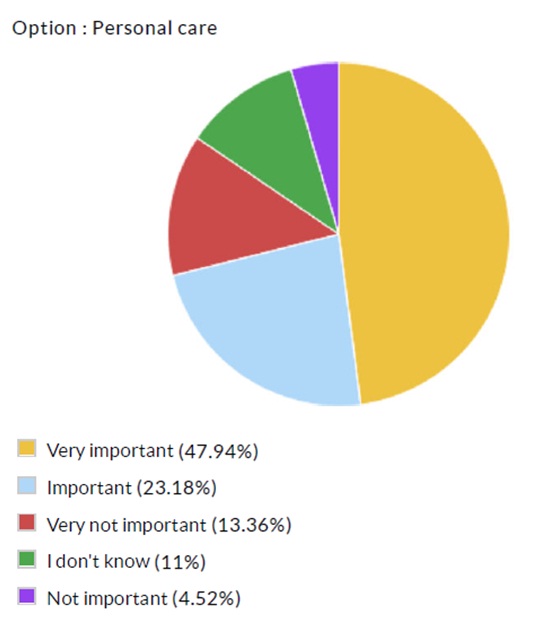
PERSONAL CARE
Personal care also is less important for them to have Halal label.
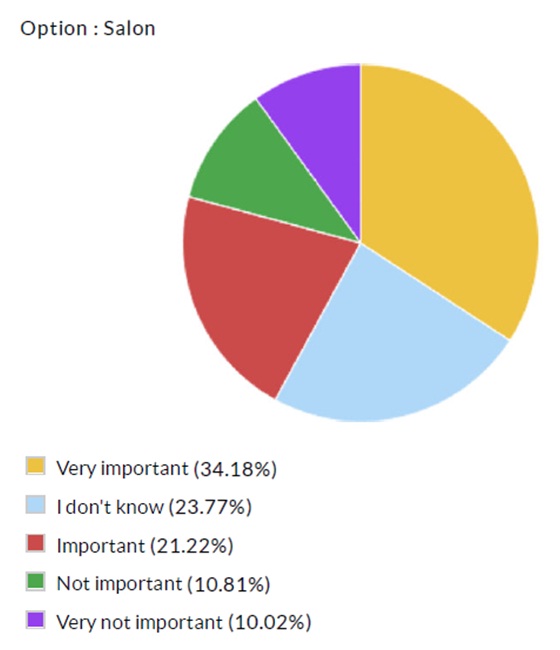
SALON
For our respondents, service such as salon is less important to have Halal label.
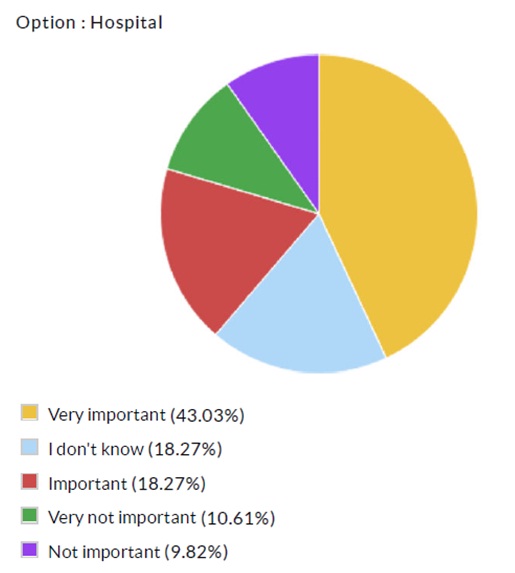
HOSPITAL
Another kind of services, hospital also is less important to have Halal label, according to our respondents’ answer.
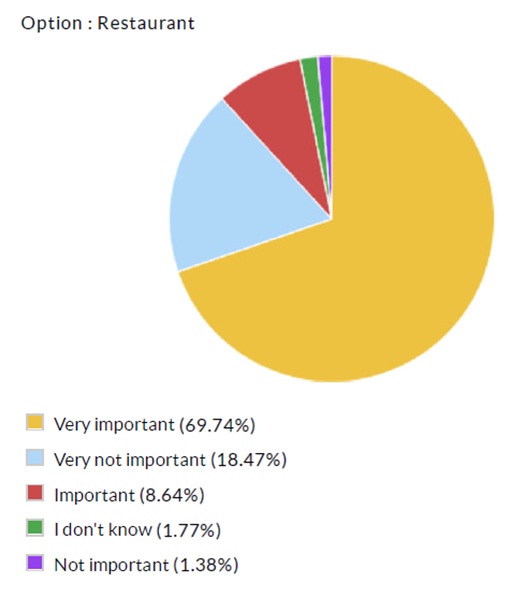
RESTAURANT
For our respondents, service such as restaurant must have Halal label
- What are other products/ services should have Halal label?

We asked our respondents using open ended question about what other products/ services should have Halal label are. And, here we found that beverages and perfume are the 1st and 2nd must have Halal label products.
Reference:
Badan Pusat Statistik. (2011). KEWARGANEGARAAN, SUKU BANGSA, AGAMA, DAN BAHASA SEHARI-HARI PENDUDUK INDONESIA: Hasil Sensus Penduduk 2010. Jakarta: Badan Pusat Statistik.
For more detail you can download XLS report at the button below. JAKPAT report consists of 3 parts which are 1) Respondent Profile, 2) Crosstabulation for each question and 3) Raw Data. Respondent profile shows you demographic profiles ( gendr,age range, locationby province, and monthly spending). Cross tabulation enables you to define different demographic segment preference on each answer.
![]()
Click the icon to download XLS report
And also PDF Report here:
http://www.slideshare.net/JAKPATAPP/survey-result-by-jak-pat-leading-mobile-market-research-in-indonesia-48929728
And if you’d wish to send a survey to JAKPAT’s respondent, let’s request a Sales Quote here!

If you’re interested to do survey on retail and consumer goods field toward our respondents, we have over 31,000 mobile respondents ranged from age 17-50 years old, smartphone active users, and located in all regions of Indonesia that has installed our app and readily answering your survey. Those 31,000 respondents has been verified, profiled, and continuously tracked to make sure you get the updated profiles of them. Our respondents has been profiled based on their demographic (age,gender,location, spending level, profession,religion), lifestyle habit (smoking/non, gamers/non, wearing glasses/non, frequent flyer/non, online shopper/non), and also brand consumption level ( brand A users, brand B users in FMCG, Retail, E-commerce,etc).
If you want to do research toward our respondent, please signup here and directly create your survey there. Or directly contact our Bizdev - partner@jajakpendapat.net.
To non-Indonesian client, we offer free translation from foreign languages includes English, Chinese,Hindi,etc.