

Indonesia may be quite famous with citizen level of private vehicle ownership compared to other ASEAN countries. Since public transportation service is considered as still facing several challenges to meet the public satisfaction, private vehicle become the ultimate choice for most Indonesian. However, although private vehicle become everyone’s favourite, it doesn’t mean that public transportation modes will be left behind. There is still a promising future for our public transportation modes as parts of our society still regularly use it to support their daily activities.
Among all province in Indonesia, Jakarta could be the most traffic city. Old proverb even says that people just grow old while waiting for the traffic in Jakarta. As the traffic level in Jakarta remains terrifying, Jakarta and the regions around it (Jabodetabek – Jakarta, Bogor, Depok, Tangerang, Bekasi) becomes ultra-crowd in certain hours. Although most people would still jump into the traffic by using their own vehicle, some others are more likely to ride public transportation with various reasons. Understanding this phenomenon, we conduct a survey about Jabodetabek citizen preference among public transportation modes around them. The survey was conducted in Jakarta, Bogor, Depok, Tangerang, and Bekasi by involving 430 respondents. As Jabodetabek total population in 2016 is about 24 million people, by using Krejcie and Morgan sampling table, 430 respondents is considered as the acceptable number to conduct a survey with 95% confidence level.
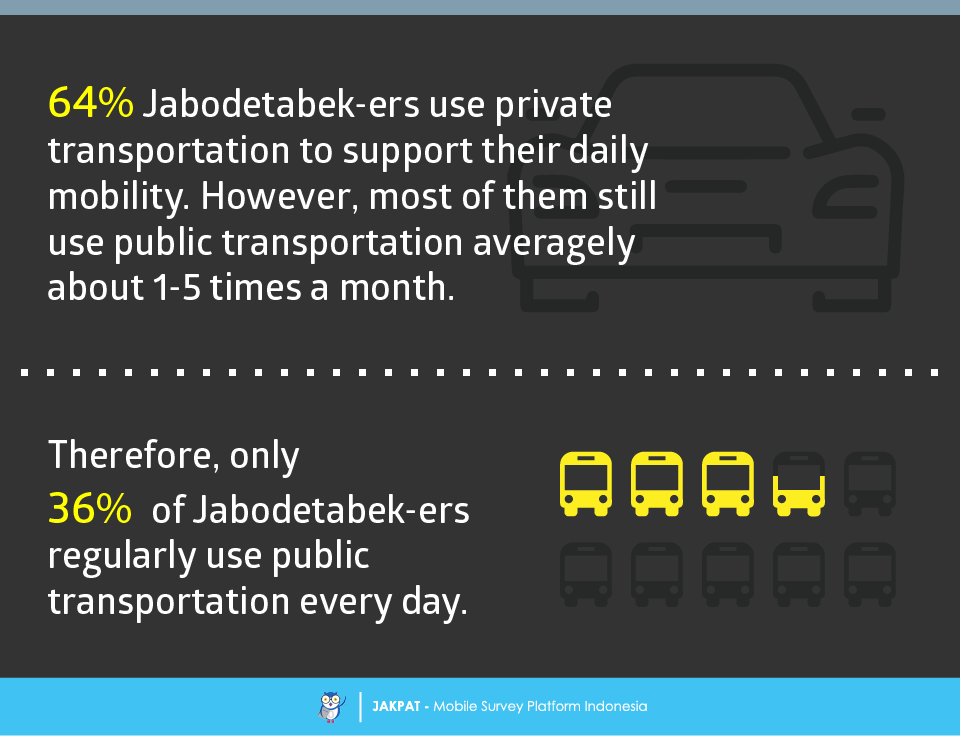
First of all, we would like to examine Jabodetabek citizen preference of their daily transportation mode. As we said earlier, most Indonesian as well as Jabodetabek citizen are more likely to ride their own vehicles for daily activities. At least 64% of them use their own vehicles, although most of them still use public transportation service about 1-5 times a month. To summarize this finding, we can simply say that there is 36% of Jabodetabek citizen who regularly use public transportation for daily activities.
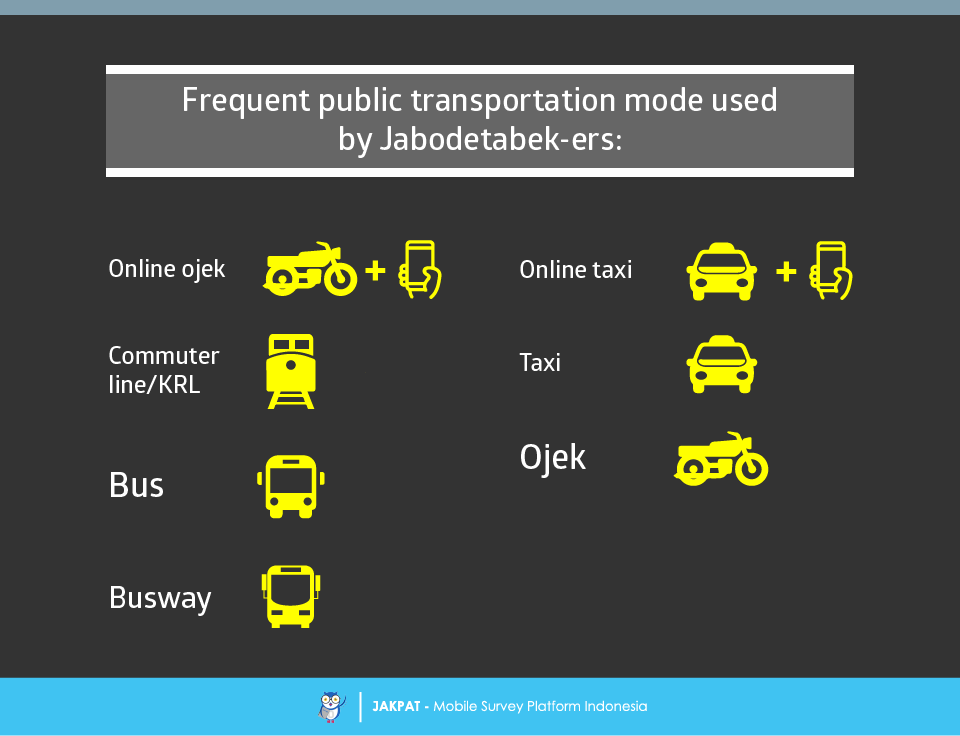
Our research then further expanded by asking Jabodetabek citizen preference of public transportation modes to support their activities. To mention all public transportation modes available in Jabodetabek, we will explain our research finding in order from the most frequent to the least choice of respondents. Apparently, online ojek (motorcycle) become the most frequently used transportation for respondents. 25% of respondents mentioned online ojek as their number one favourite mode of public transportation. Following the finding, Commuter line (KRL) was considered as the second most frequent as voted by 18% respondents. It is the followed by bus (16%), busway (15%), online taxi (11%), conventional taxi (9%), and conventional ojek (6%).
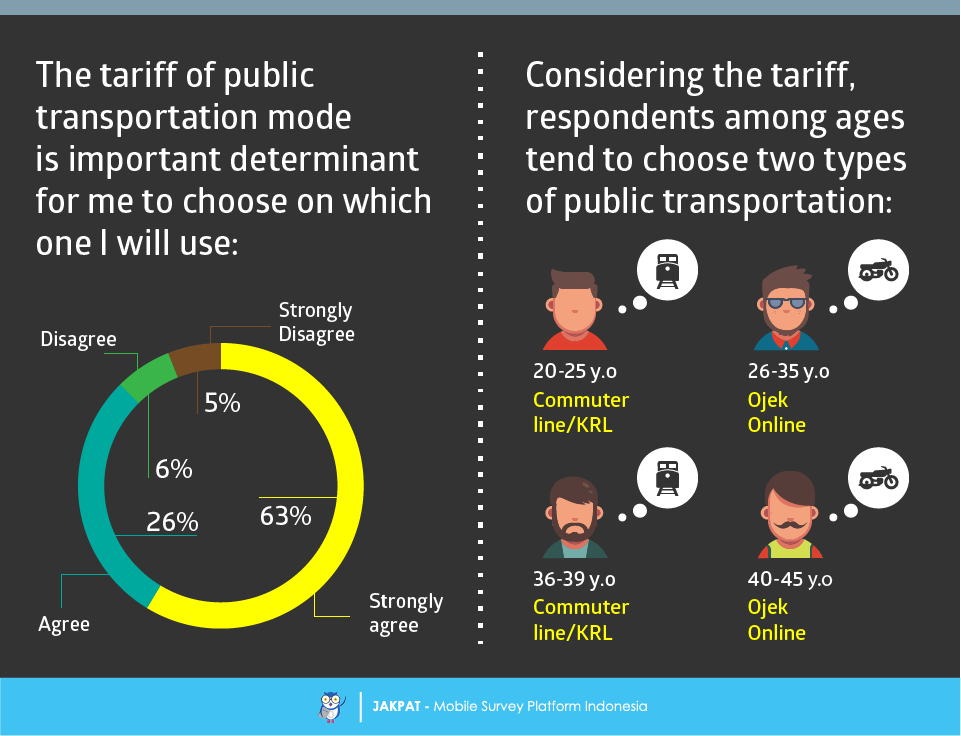
Understanding consumer preference requires us to investigate every factor that causing their decision making. We try to explore every possible determinant that affect respondents’ decision on choosing which type of public transportation mode they would like to ride. First determinant factor we like to explore was tariff. As we all know, financial aspect seems to be an important consideration for consumer of all industries. Apparently, our assumption was true since 63% of our respondents strongly agree that tariff does affecting their choices. However, as tariff was considered as important factor, Commuter line (KRL) and online ojek becomes two most preferable public transportation modes chosen by respondents.
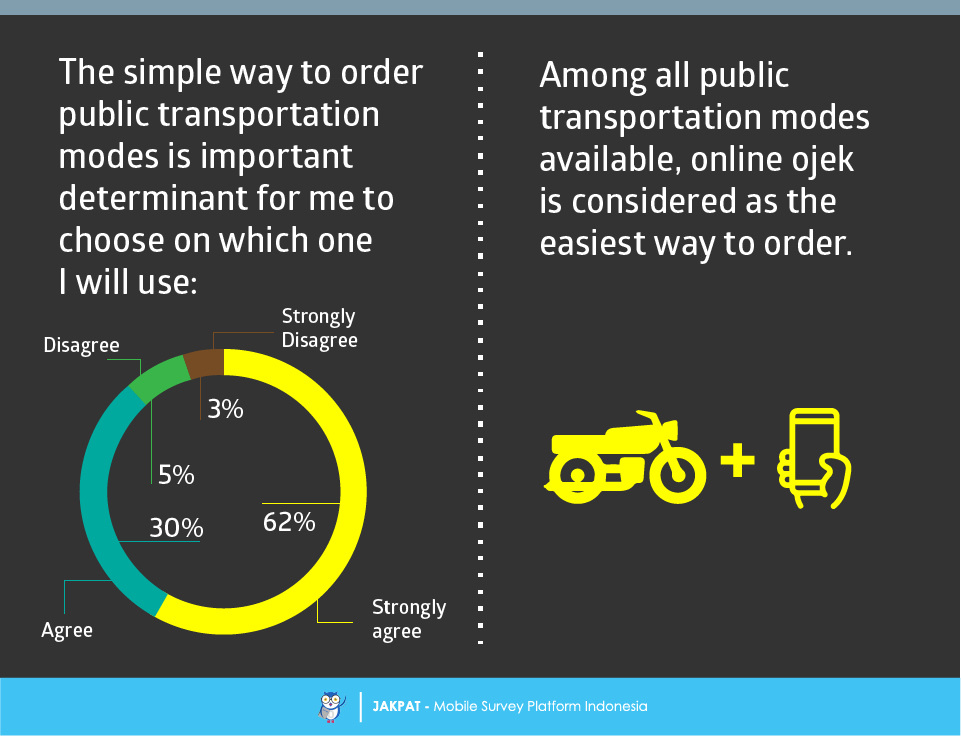
Second determinant factor we like to explore was the way of ordering the public transportation vehicle. Quite similar with our previous finding, 62% of respondents said that they are strongly agree that the simple way of ordering public transportation vehicle affect their decision. Among all public transportation modes available in Jabodetabek, online ojek is once again considered as having the easiest way to order.
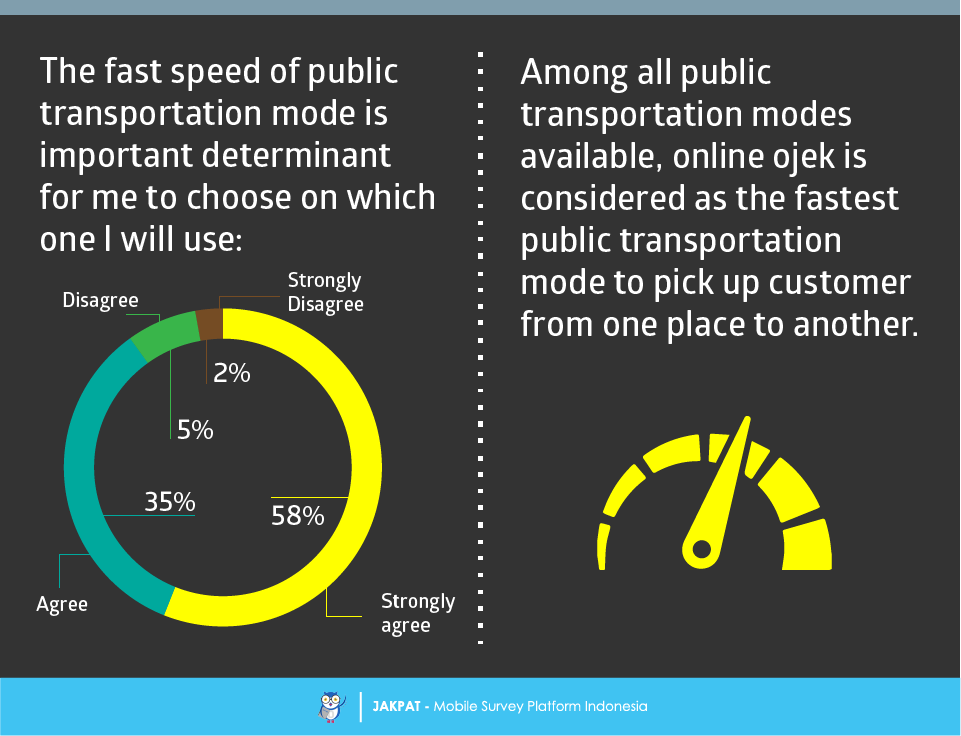
Third determinant factor we like to explore was the speed of public transportation modes. Although it was not as high as the previous factors, but the importance of public transportation speed was strongly agreed by 58% of respondents. Interestingly, similar with the previous finding, among all public transportation modes available, online ojek is considered as the fastest public transportation mode to pick up customer from one place to another.
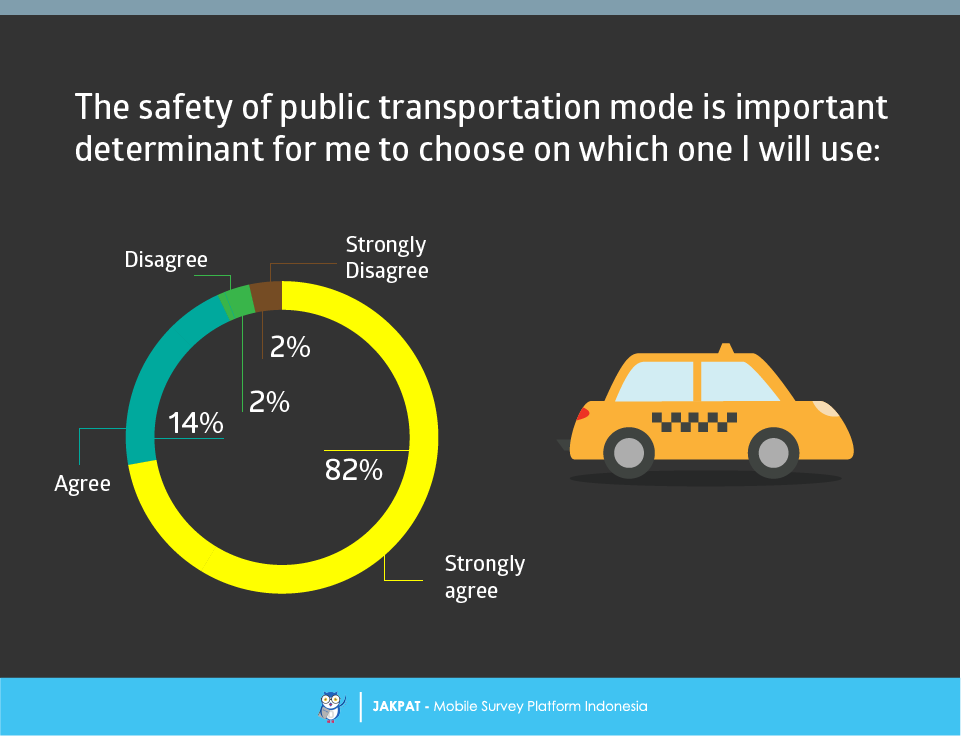
The security of public transportation modes become our fourth determinant factor. Almost all of our respondents consider it as important factor, since 82% of them was strongly agreed the sentence.
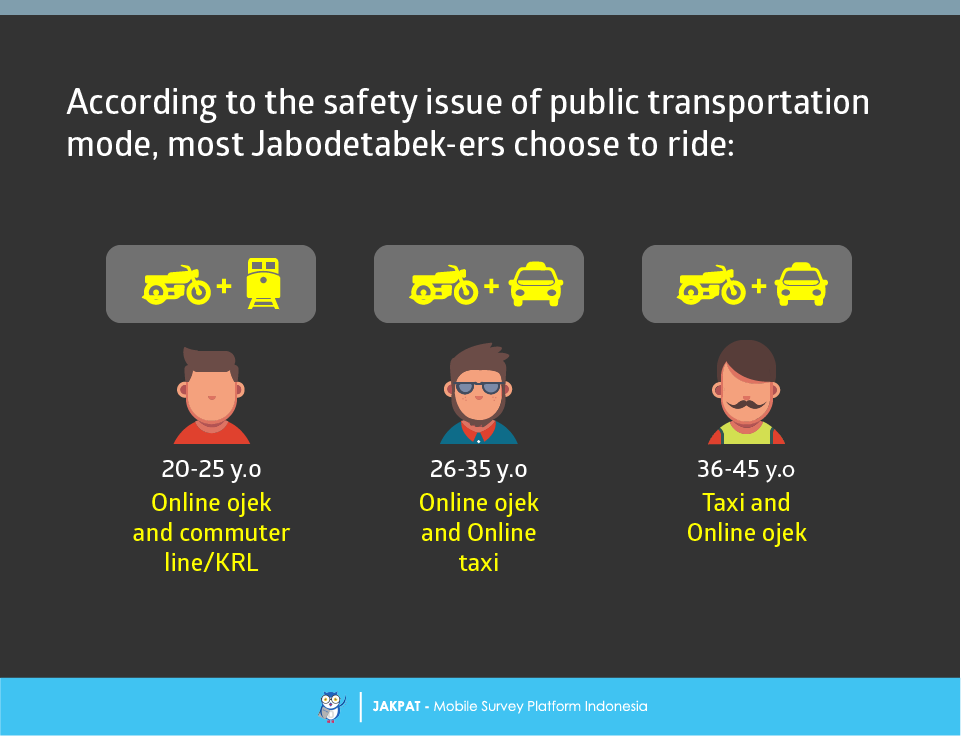
However, when we asked our respondents to mention their preferred public transportation mode by considering its safety, the answer was various. We divide the answers among three age groups of respondents. The 20-25 years old consider online ojek and Commuter line as the most secure public transportation modes. Different answer also be found in the 26-35 years old who consider online ojek and online taxi as the most secure, while the 36-45 years old consider conventional taxi and online ojek.
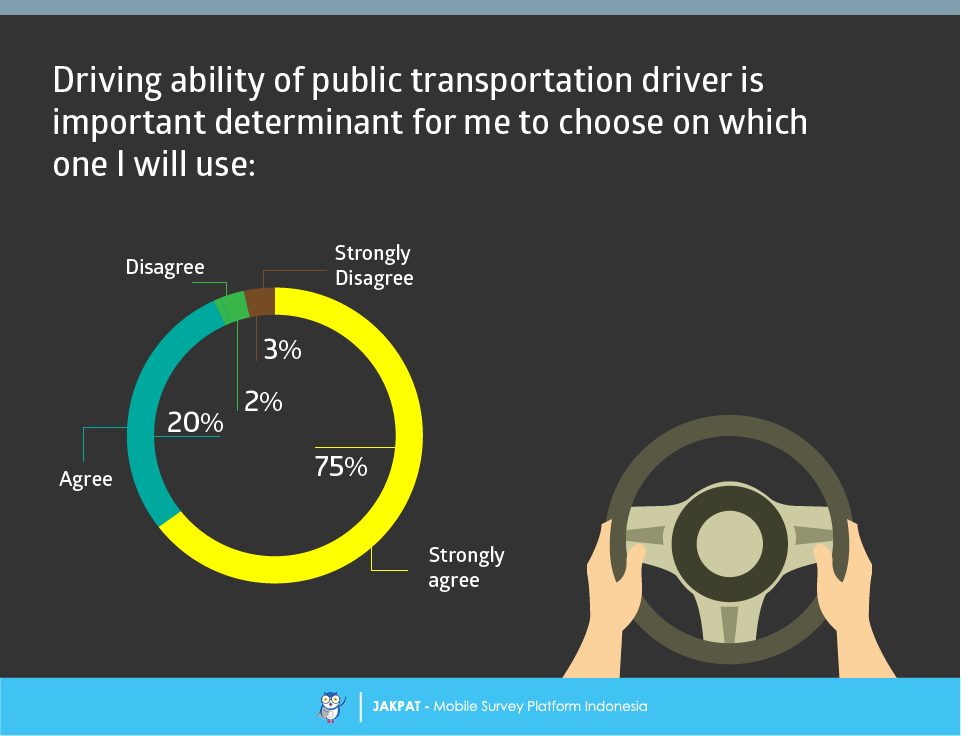
Our fifth determinant factor was driver’s driving ability. We asked our respondents whether the driving ability is an important factor that affects their preference. As we predicted, 75% of respondents was strongly agreed the sentence.
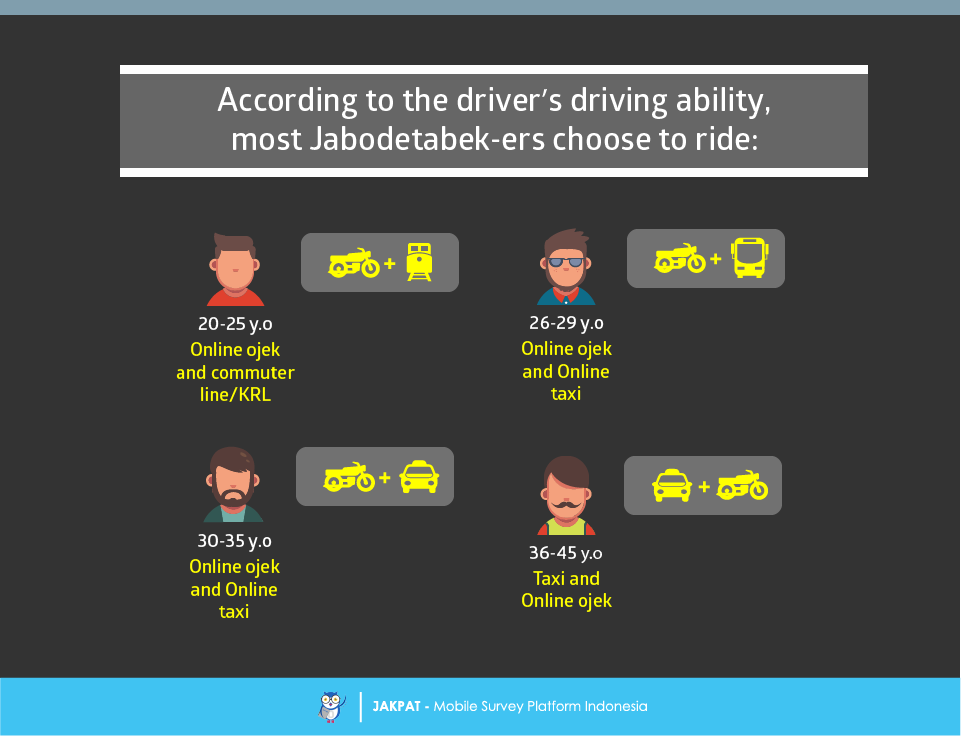
We then asked our respondents to choose their preferred public transportation modes by considering the driver’s driving ability. The 20-25 years old consider online ojek and commuter line (KRL), while the 26-29 years old consider online ojek and busway. Different answers also are found in the 30-35 years old respondents who choose online ojek and online taxi, while the 36-45 years old choose conventional taxi as well as online ojek.
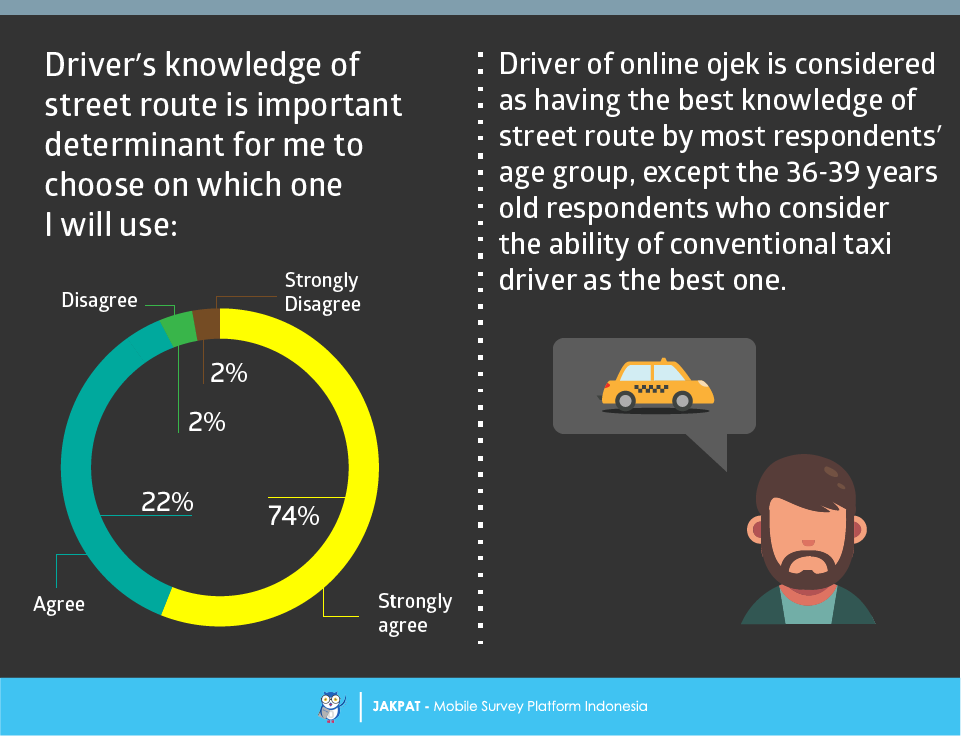
Our last determinant factor asked to respondents was driver’s knowledge about street route. 74% of respondents strongly agree that driver’s knowledge of street route will affect their preference of public transportation mode. Among all the public transportation modes available, online ojek driver is considered as having the best knowledge of street route by almost all respondents, except the 36-39 years old who considered that conventional taxi driver is the best.
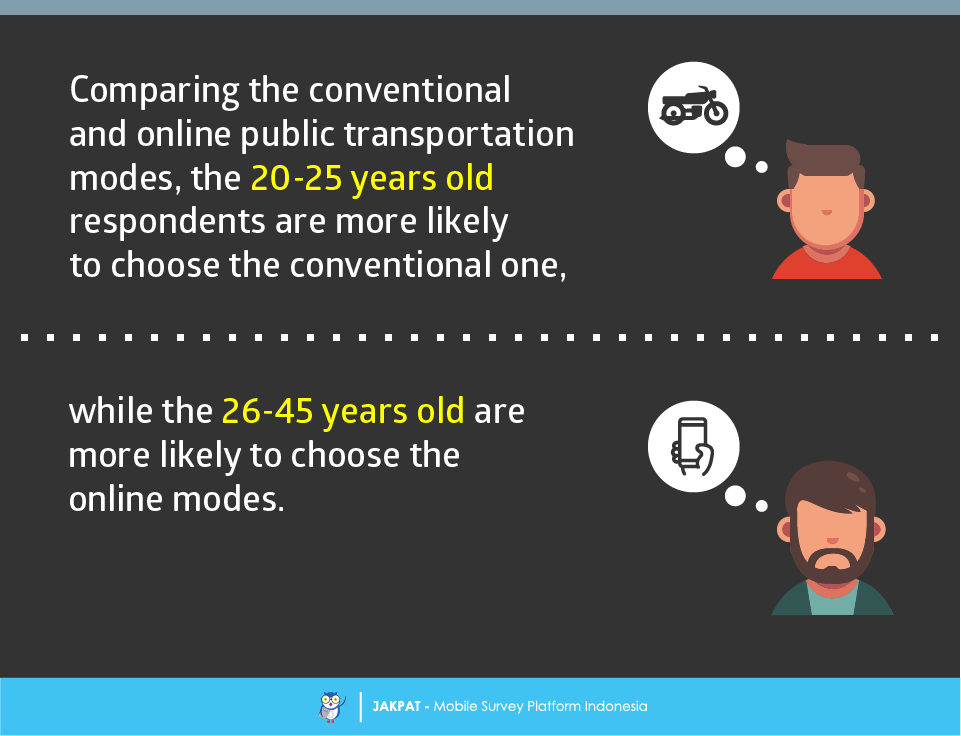
Comparing respondents’ frequency of using conventional and online public transportation modes, we found two different answers. Apparently, the 20-25 years old are more likely to ride the conventional public transportation modes. In other hand, the 26-45 years old are more likely to choose the online modes.
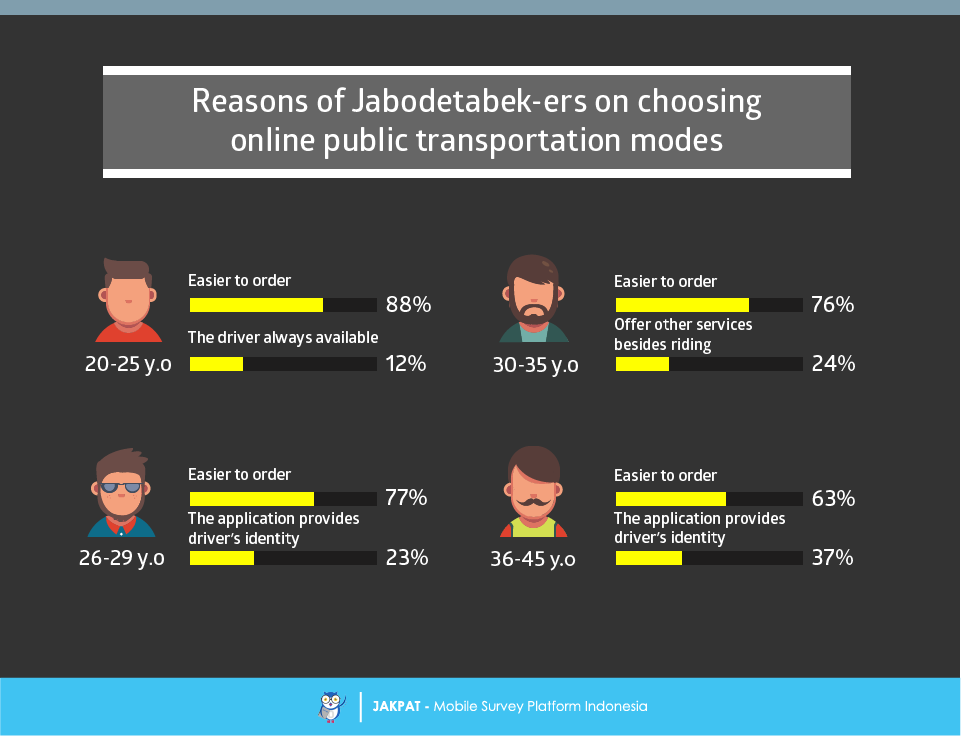
To be able to comprehensively understand Jabodetabek citizen preference on choosing both online and conventional public transportation modes, we asked about their motives of choosing. Interestingly, although the simplicity and its easy way to order become two main factors, there are secondary factors found in each groups. The 20-25 years old motive was the driver always available so that it would be easy for them to order. The 26-29 years old motive was more concerned about the advantage of its application that provides driver’s identity. The 30-35 years old motive was more practical since they like it when the public transportation modes they have chosen were not only offering riding service but also other services. At last, the 36-45 years old motive was quite similar with the 26-29 years old.
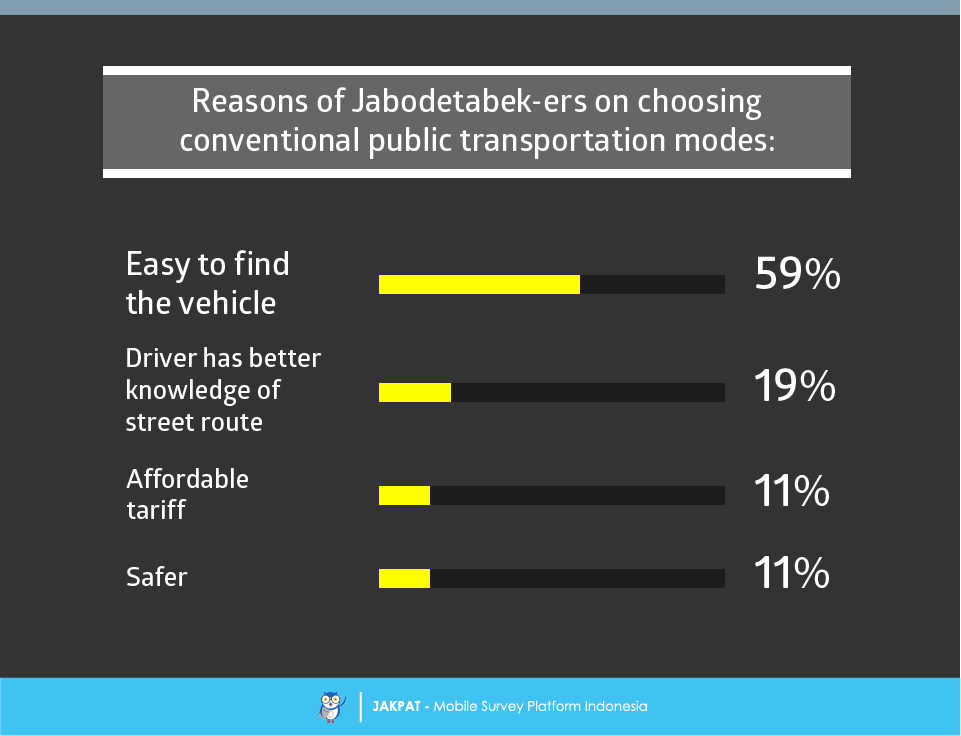
At last, we try to discover about Jabodetabek citizen who choose conventional public transportation modes better than the online. There were four answers gathered from respondents. First, they considered that conventional public transportation is easier to find. Second, they considered the driver is having better knowledge of street route compared to other modes. Third, it offers more affordable tariff, while at the very last position they considered it as safer than others.
For more detail you can download XLS report at the button below (bahasa). JAKPAT report consists of 3 parts which are 1) Respondent Profile, 2) Crosstabulation for each question and 3) Raw Data. Respondent profile shows you demographic profiles ( gender,age range, location by province, and monthly spending). Cross tabulation enables you to define different demographic segment preference on each answer.
![]()
You can also download PDF here:
![]()

or Get A Sales Quote by filling this form or Call to +622745015293
