

What is smart home? Smart home is a residence that has appliances, lighting, heating, air conditioning, TVs, computers, entertainment audio & video systems, security, and camera systems that are capable of communicating with one another and can be controlled remotely by a time schedule from any room in the home, as well as remotely from any location in the world by phone or internet.
Here, JAKPAT tried to know what respondents want from smart home, what can influence them to buy and what the important points of smart home for them are. We replicated a survey from here. Thus, we conducted this survey followed by 1003 married respondents and having home, from 20 to 35 y/o, in all provinces of Indonesia, randomly.
1. HOW MANY RESPONDENTS KNOWING SMART HOME?
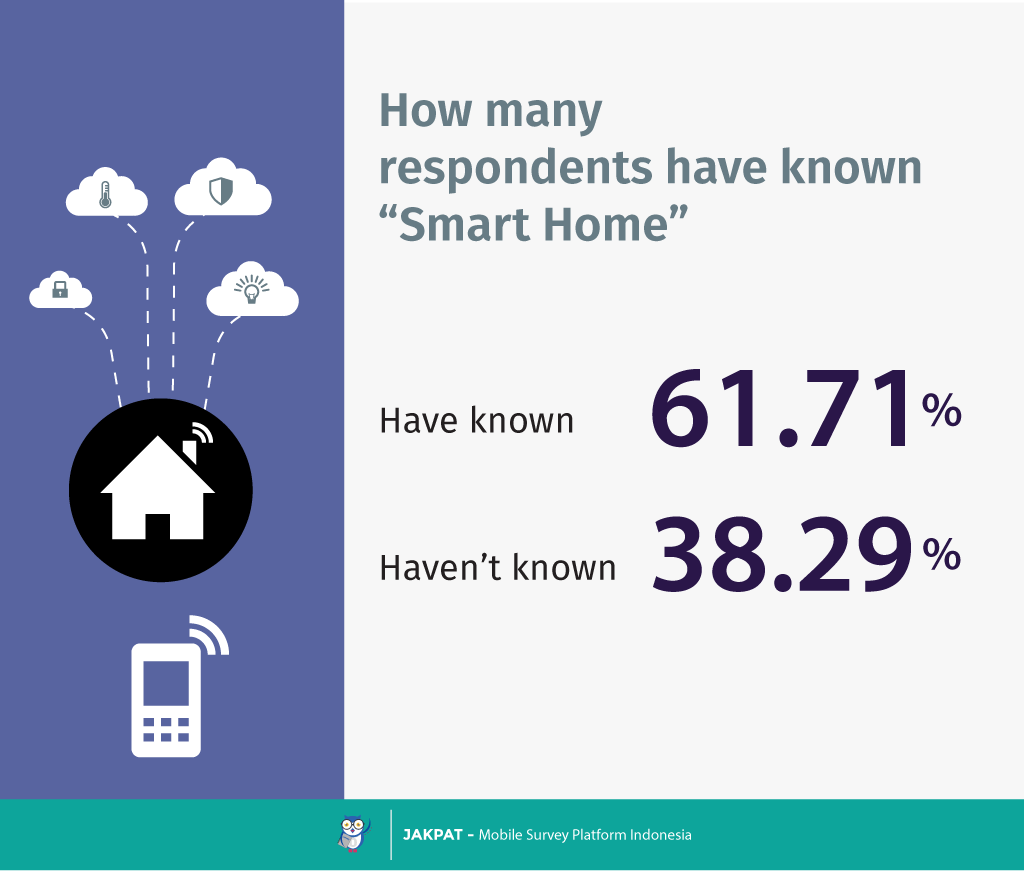
We asked whether they know smart home or not, and it Inflatable water slide for sale Canada turned out that majority of respondents have known smart home (61.71%). And only 38.29% of respondents have not known smart home.
2. HOW IMPORTANT SMART HOME IS
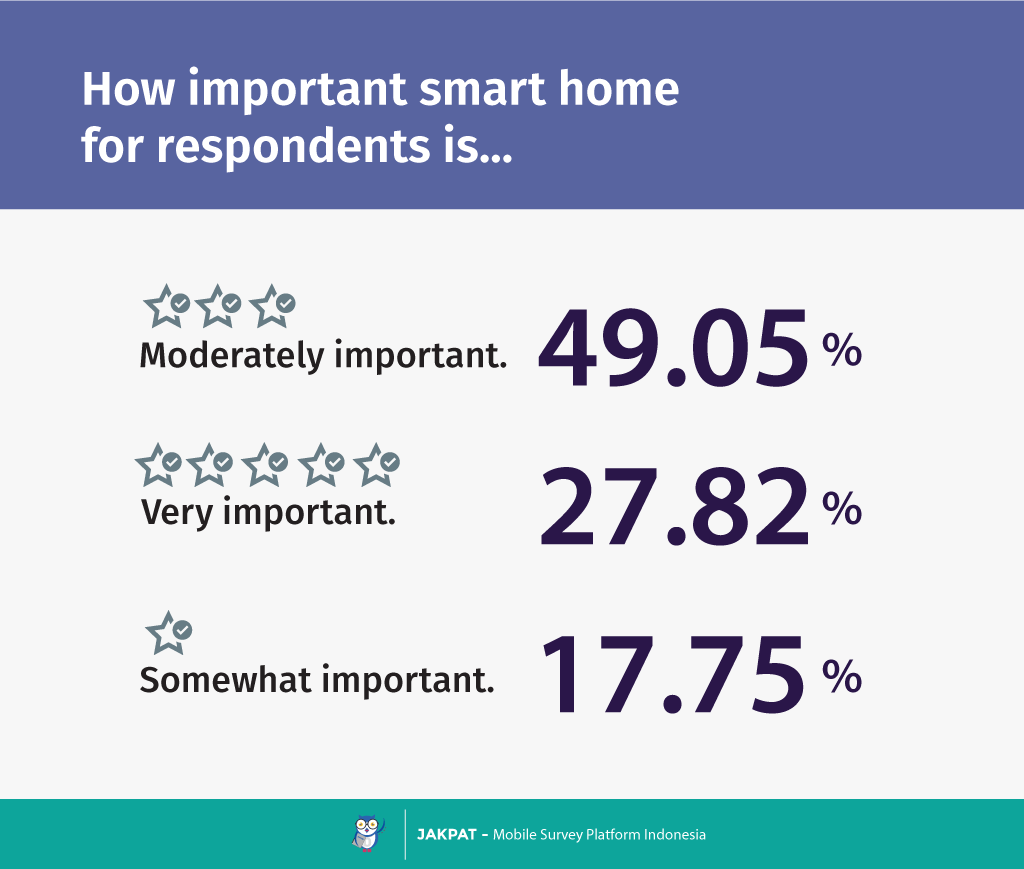
We obtained a non-majority answer concerning the important of smart home. Nevertheless, most respondents think smart home is moderately important (49.05%). As well as it is very important (27.82%) and somewhat important (17.75%). It shows that respondents start to think that they need a smart home.
3. BENEFITS THEY GET FROM SMART HOME
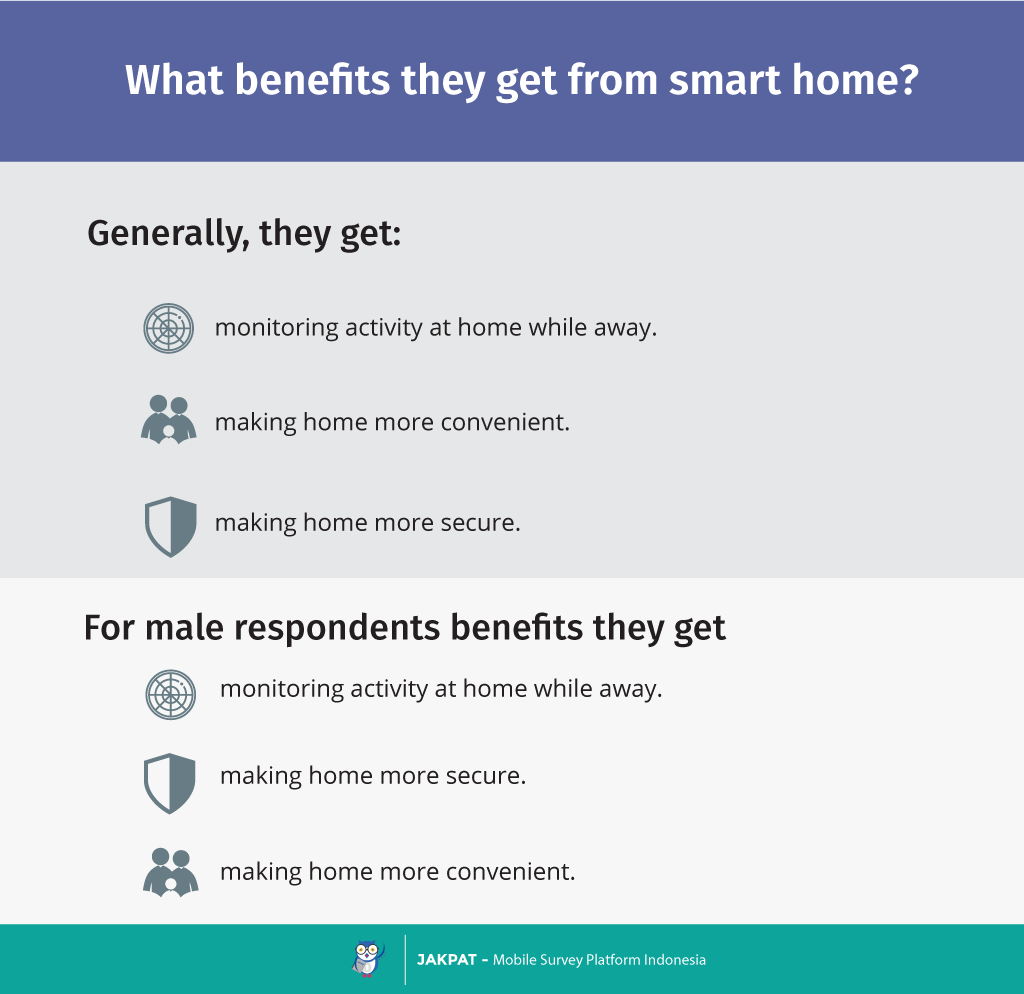
We gave them some options mentioning some benefits they may get from smart home. In general, respondents can: (1) monitor activity at home while away, (2) make home more convenient and (3) make home more secure. Nevertheless, we found some differences on gender and age part. For male respondents, the importance of benefits they obtain differs – security is more important than convenient. So do respondents who are 25-29 y/o. Female and respondents, except those who are 25-29 y/o more prioritize convenience than security.
3. SERVICES WOULD SWEETEN THE DEAL FOR HAVING SMART HOME
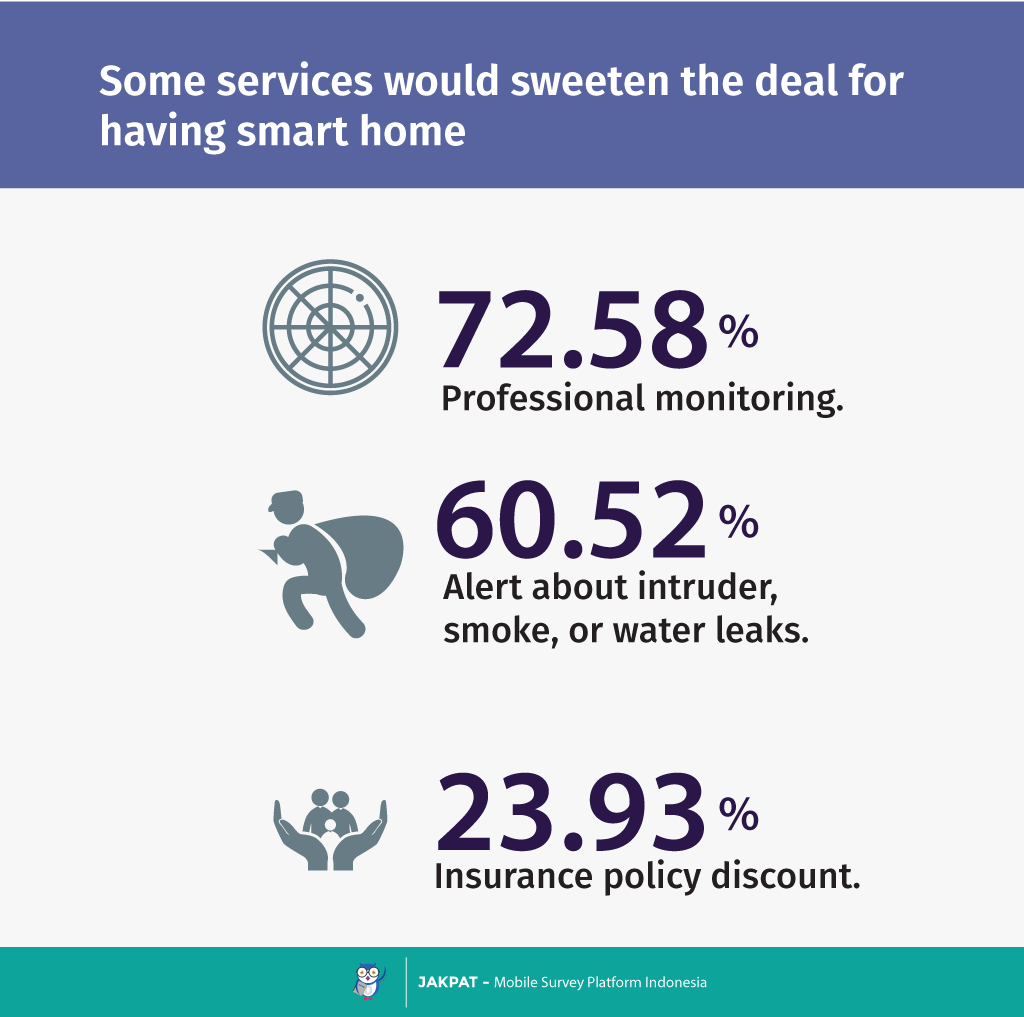
In general, majority of respondents think professional monitoring would sweeten the deal for having smart home (72.58%). Other services they take into consideration are alert about intruder, smoke, or water leaks (60.52%) and insurance policy discount (23.93%).
4. SECURITY VS EASE OF USE IN SMART HOME
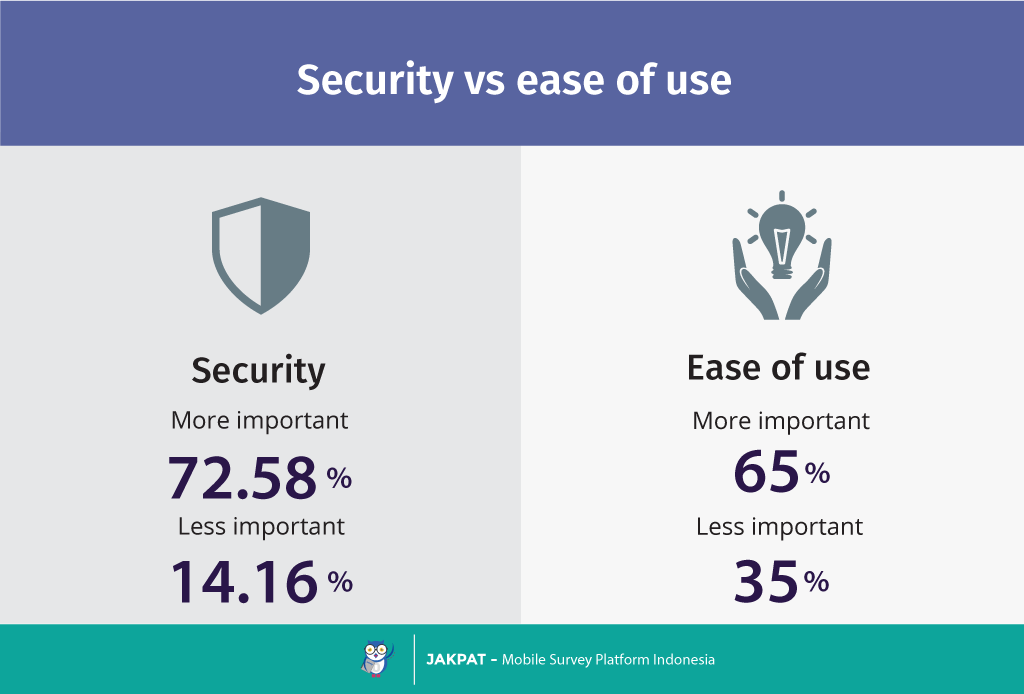
We wanted to know what more important for respondents between security and ease of use of smart home is. It turned out that more respondents more prioritize security over ease of use (8 in 10 respondents). And concerning ease of use, only 6 in 10 respondents more prioritize it over security.
5. FORGOTTEN THINGS TO DO BEFORE LEAVING HOME
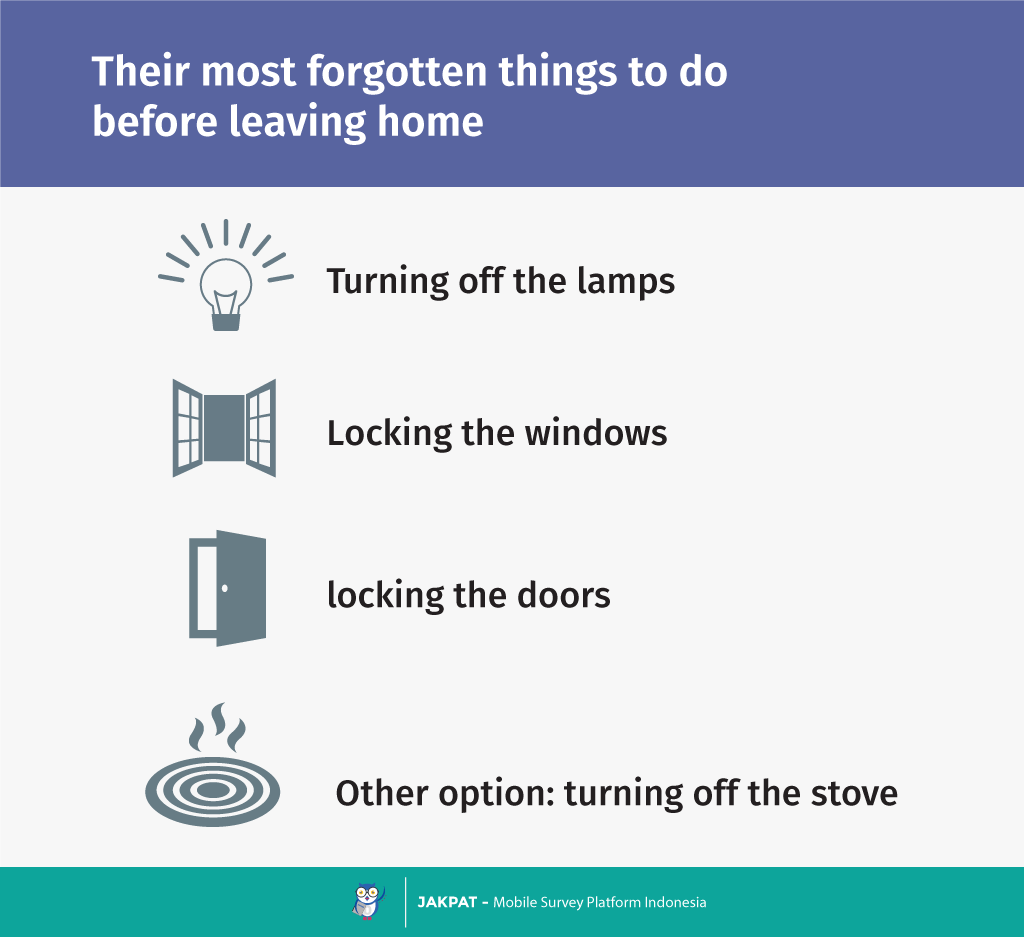
Sometimes, we forget doing an activity before leaving home. So, smart home hopefully can do it for you. Here we asked the respondents things they often forget before leaving home. We found some often forgotten activities that respondents do: (1) turning off the lamps; (2) locking the windows; (3) locking the door; and (4) turning off the stove (from other option).
6. WHAT DO THEY WANT FROM THEIR MOBILE DEVICES TO DO?
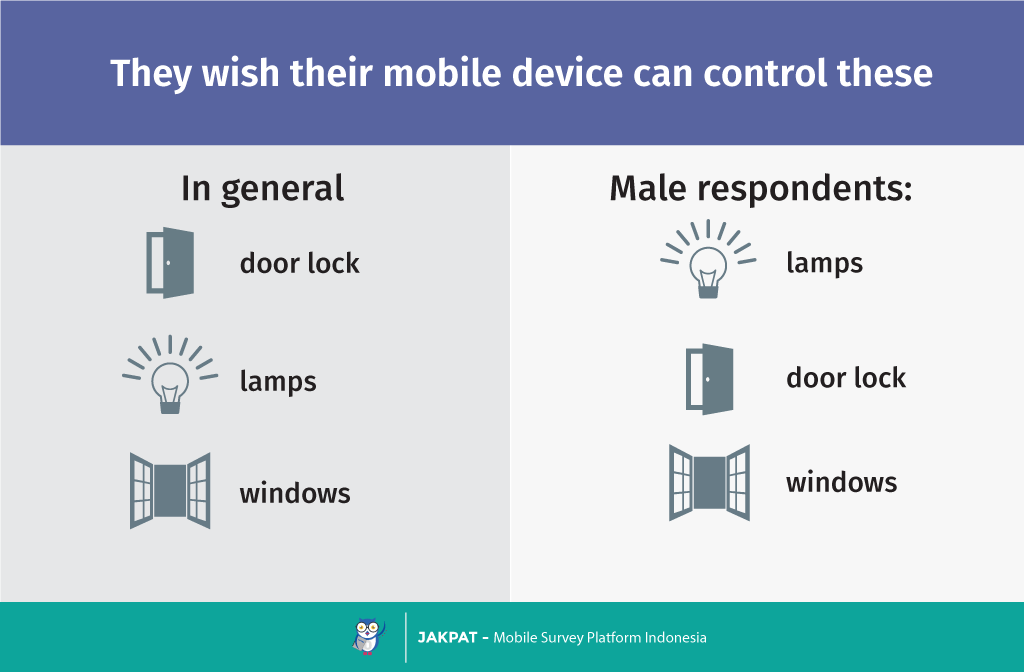
In general, we found some significant answers from this question; they wish their mobile devices can control: (1) the door lock; (2) lamps; and (3) windows. Nevertheless, male respondents have different pattern of answer – more of them wishing their mobile devices can control lamps than door lock.
7. THEIR CHOICE FOR MONTHLY FEE
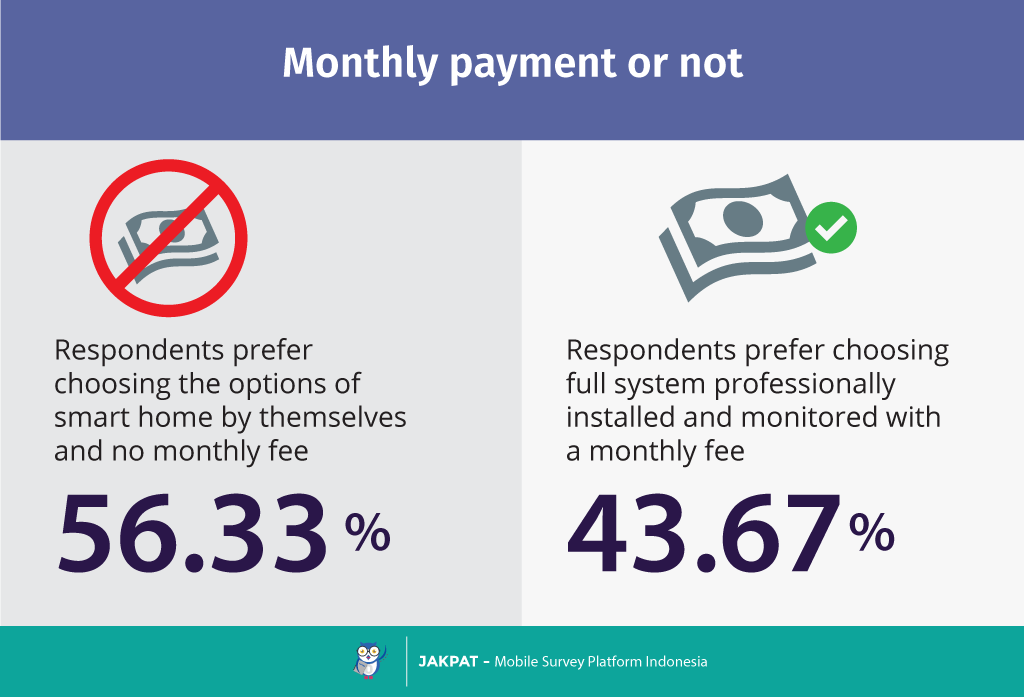
Majority of respondents prefer no monthly fee for their smart home, thus they are willing to choose the options of smart home by themselves (56.33%). Only 43.67% of them want to pay monthly fee for full system of smart home.
8. WHAT MAKE THEM PURCHASING SMART HOME
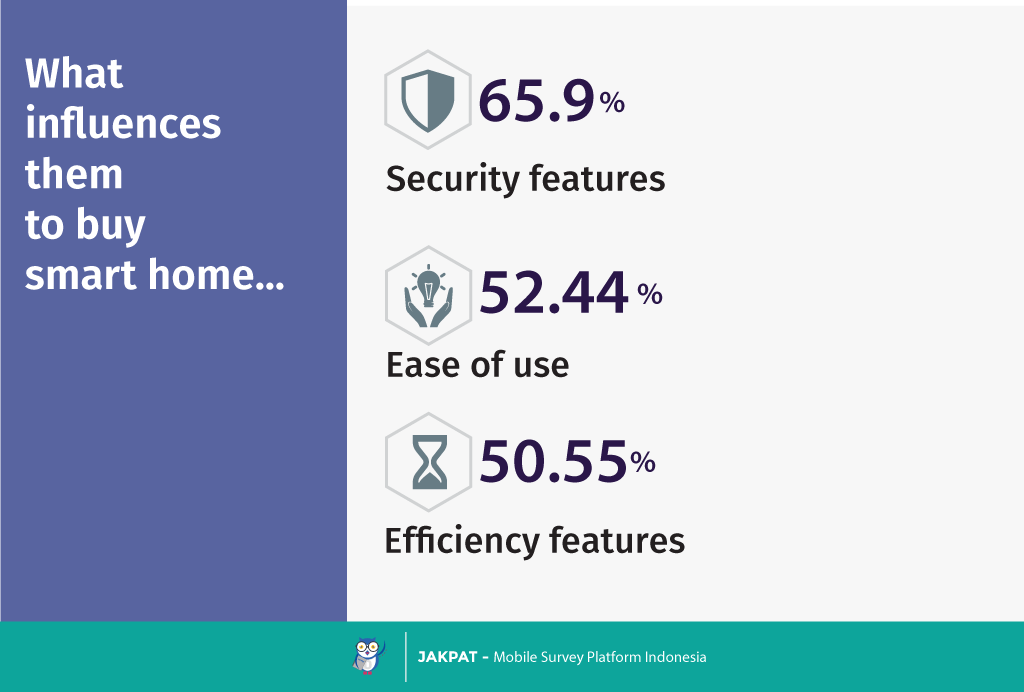
We also wanted to know factors influencing them to purchase smart home, thus we gave a multiple answer question type. We found that in general, security features influence them most for purchasing smart home (65.9%). Other factors are: ease of use and efficiency features.
For more detail you can download XLS report at the button below. JAKPAT report consists of 3 parts which are 1) Respondent Profile, 2) Crosstabulation for each question and 3) Raw Data. Respondent profile shows you demographic profiles ( gendr,age range, locationby province, and monthly spending). Cross tabulation enables you to define different demographic segment preference on each answer.
![]()
Click the icon to download XLS report
And also PDF Report here:
http://www.slideshare.net/JAKPATAPP/survey-result-by-jak-pat-leading-mobile-market-research-in-indonesia-49491946
Ready to Send A Survey?

or Get A Sales Quote by filling this form or Call to +622745015293
