

The needs of being connected in 24/7 with our loved one, family, peers, and the outside world requires us to have a good quality of telecommunication service provider. The service offered by telecommunication provider enables us to be connected through the conventional method such as phone call and text message, as well as through the contemporary one such as instant messenger, social media, and so on. However, the competition of telecommunication service provider industry in Indonesia has been entering the red ocean since it becomes very rough. As telecommunication is a service based industry, ensuring consumer satisfaction always to be fulfilled becomes an important strategy to win the market.
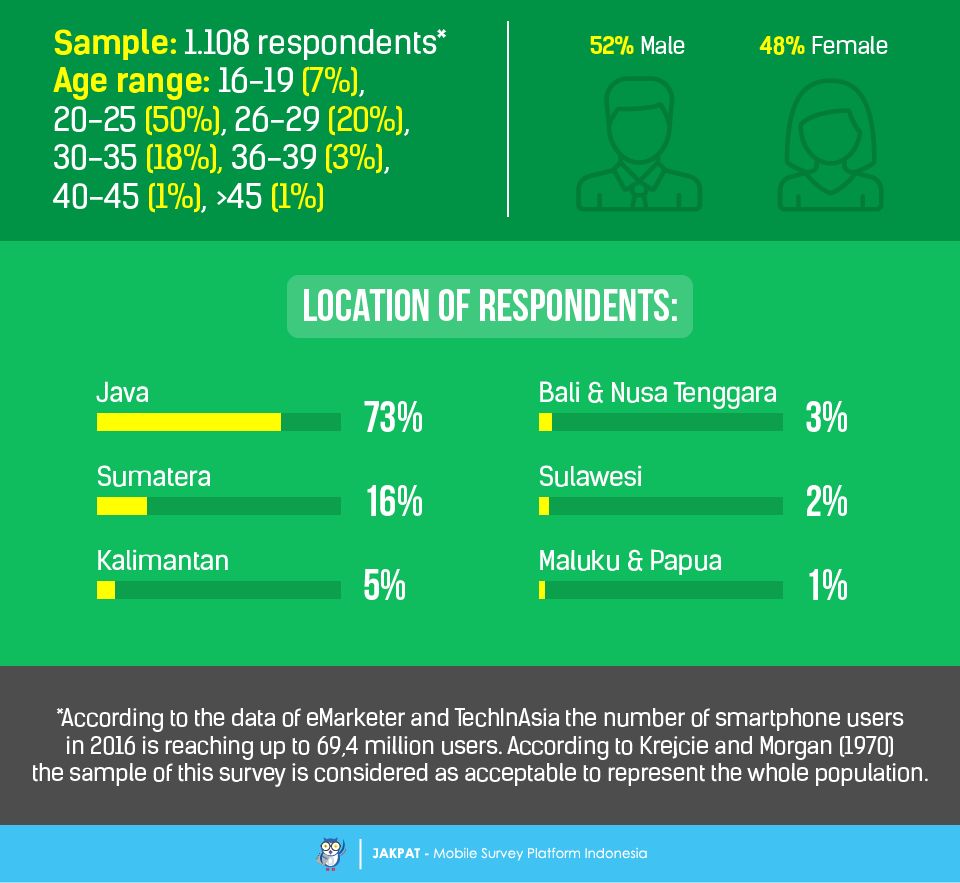
We conducted a survey toward 1.108 respondents in nationwide to understand their satisfaction of their currently used telecommunication service provider. According to the data of eMarketer and TechInAsia, the number of smartphone users in Indonesia is reaching up to 69.4 million users per 2016. This finding shows us that the potential of telecommunication market service will be growing exponentially at least during the upcoming decades.
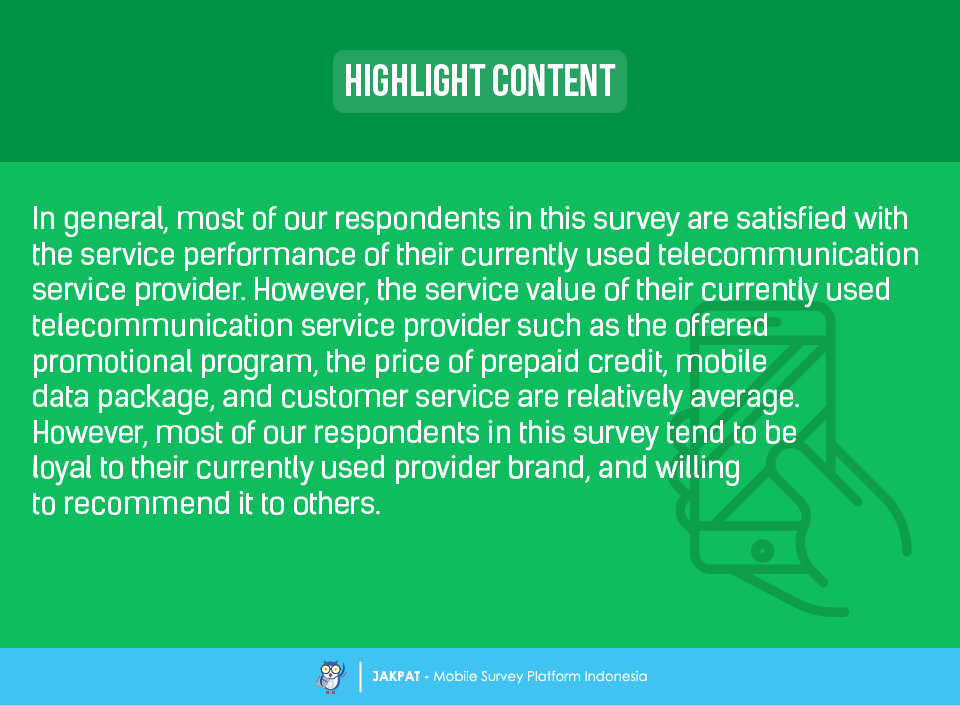
Notable highlight of our survey finding is mostly focused on respondents’ assessment toward two aspects. Customer satisfaction could be measured by examining two aspects such as service provider and service value. Regarding the service performance, most respondents in this survey are already satisfied with everything they get from the provider. In other hand, few things are found as dissatisfied regarding the provider’s service value.
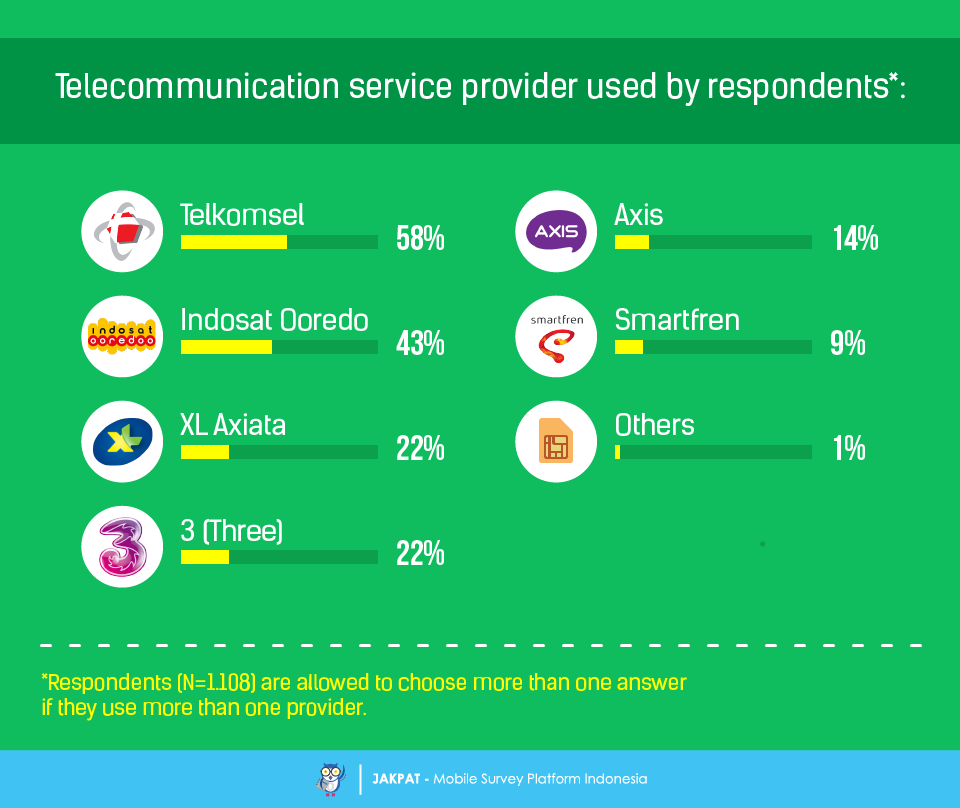
First of all, we would like to map the telecommunication service provider used by our respondents. As shown in the image below, three service providers are dominating the market as they are the top three biggest telecommunication provider companies in Indonesia.
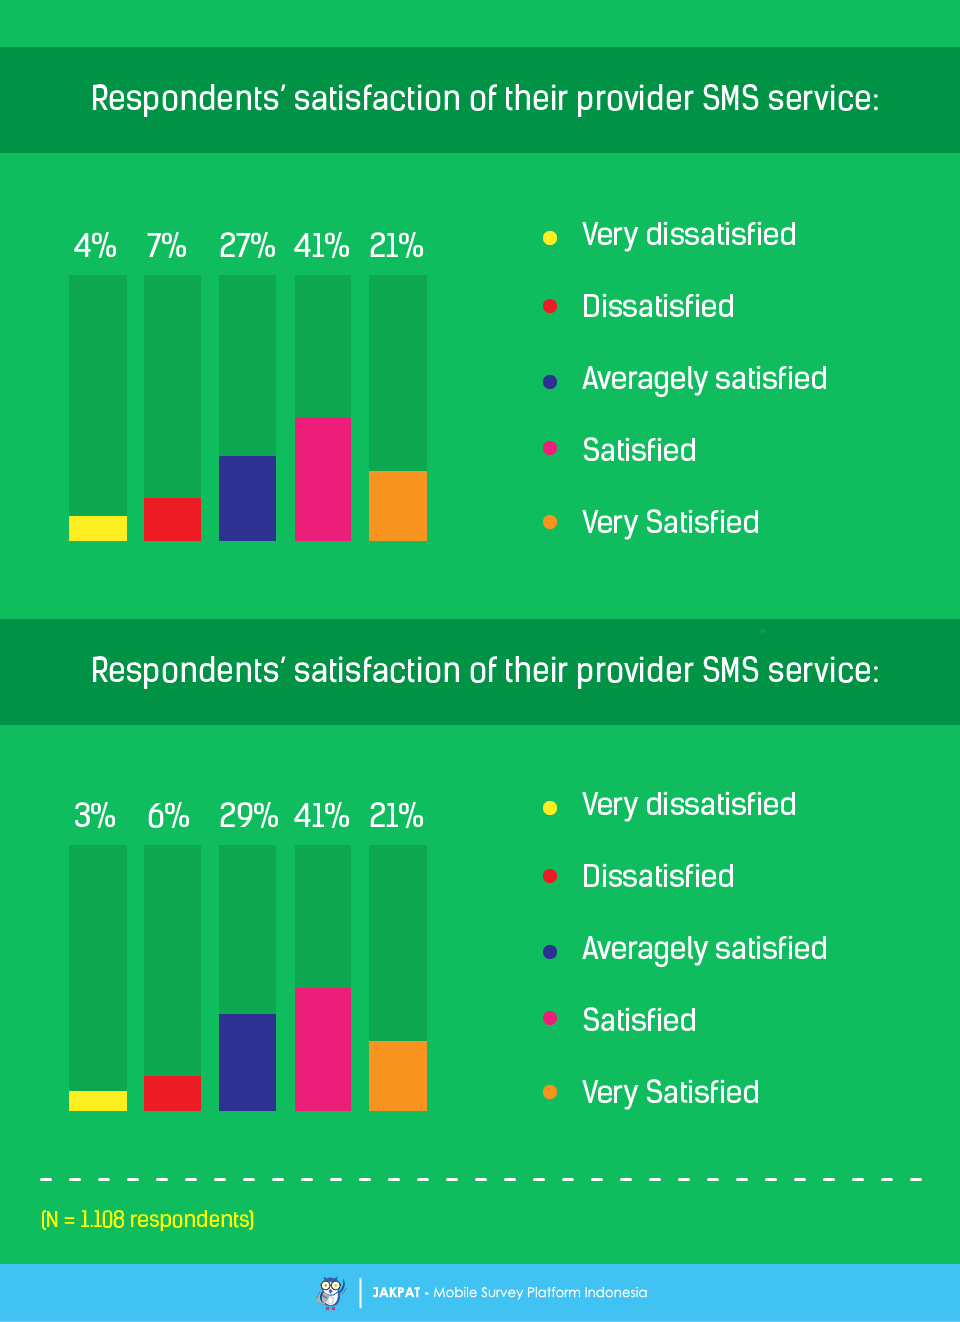
The service performance aspect of telecommunication provider would be examined by asking respondents’ satisfaction of SMS and phone calling service. According to the respondents’ answer we find that both performances are already considered as satisfying.
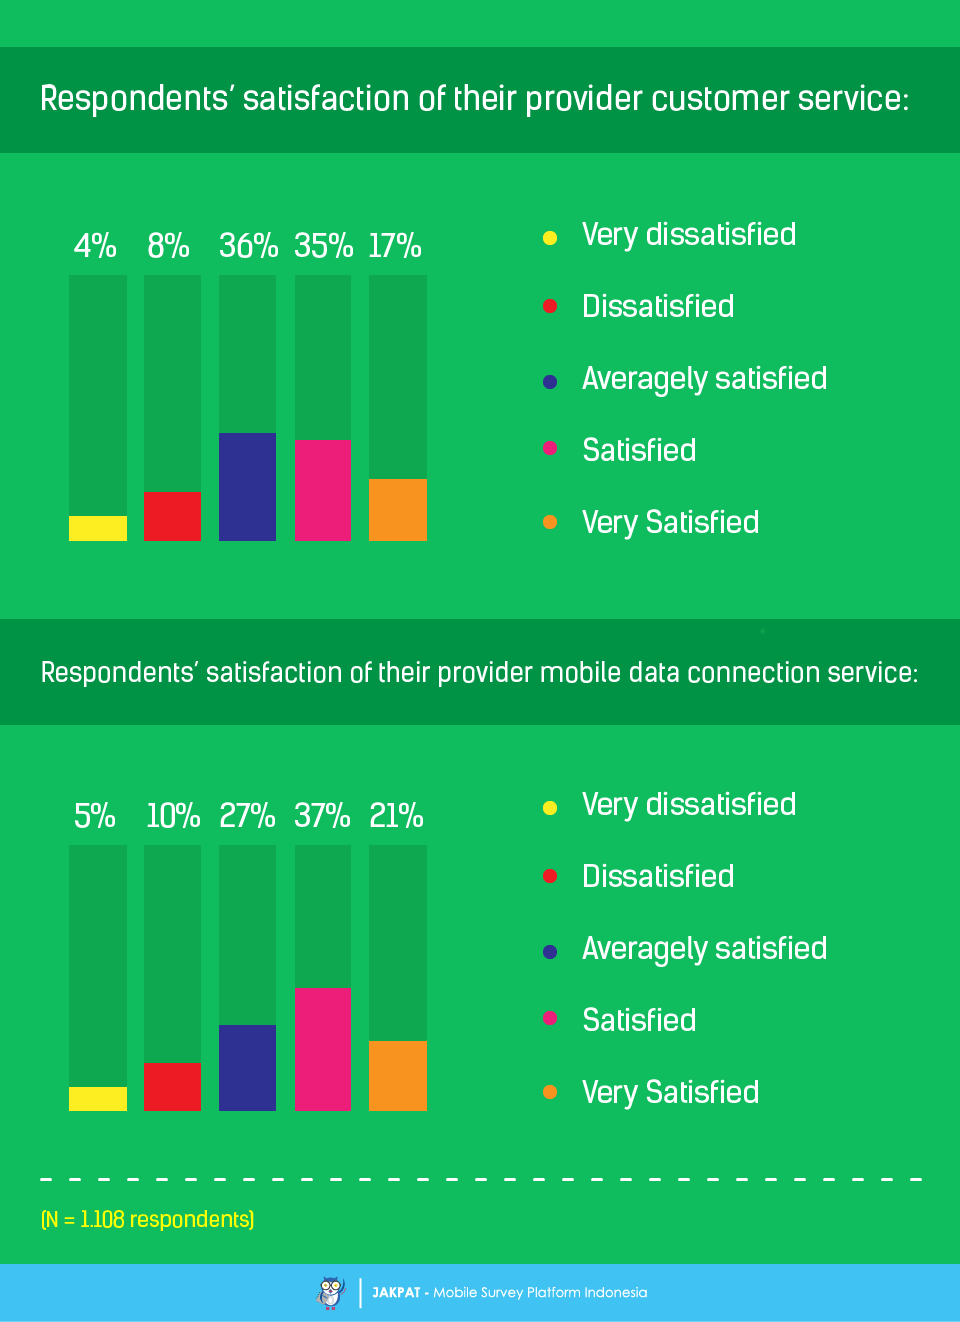
Moreover, the service performance is also examined by asking respondents’ satisfaction of the customer service and mobile data connection service. Apparently, most respondents in this survey are satisfied with mobile data connection service offered by the provider, although most of them are only averagely satisfied with the customer service performance of the provider.
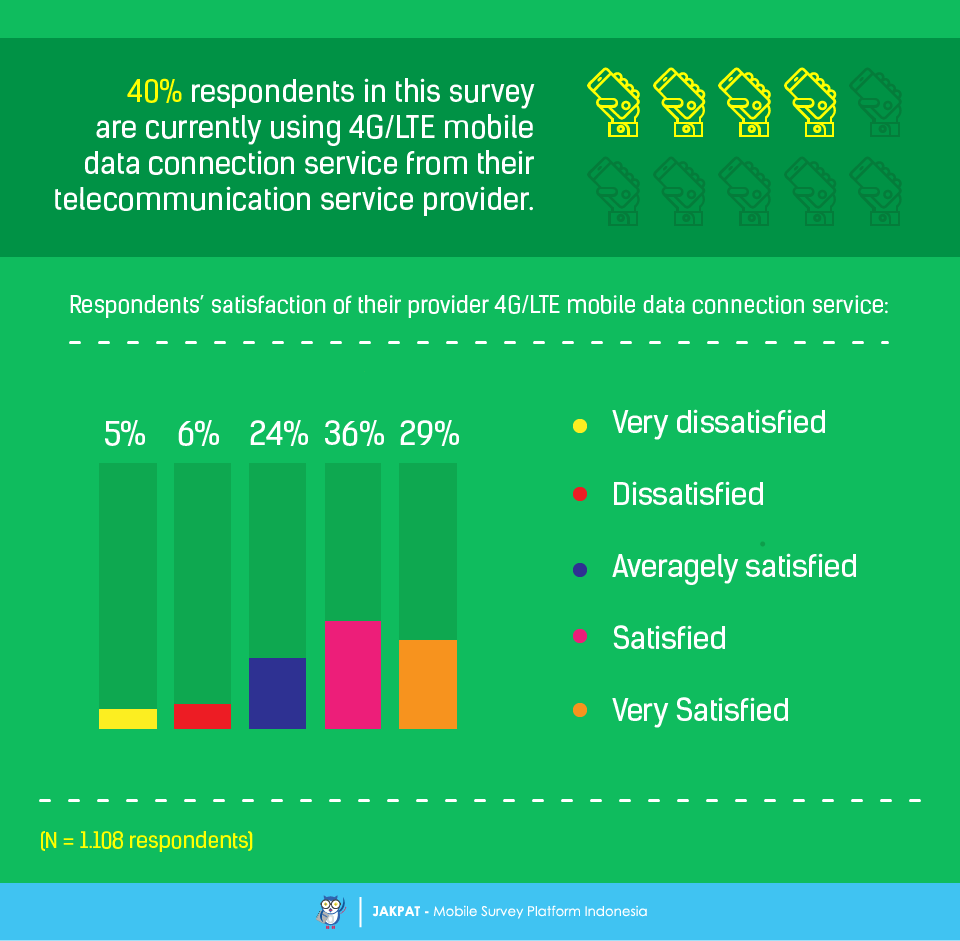
The advancement of 4G/LTE technology in Indonesia has been used by most telecommunication service provider to expand their market target by promising a better, more stable, and faster connection. However, from all respondents who have participated in this survey, only 40% of them are currently using this technology. Moreover, regarding respondents’ satisfaction of their provider 4G/LTE mobile data connection service, 36% respondents are already satisfied and 29% of them are very satisfied with the performance.
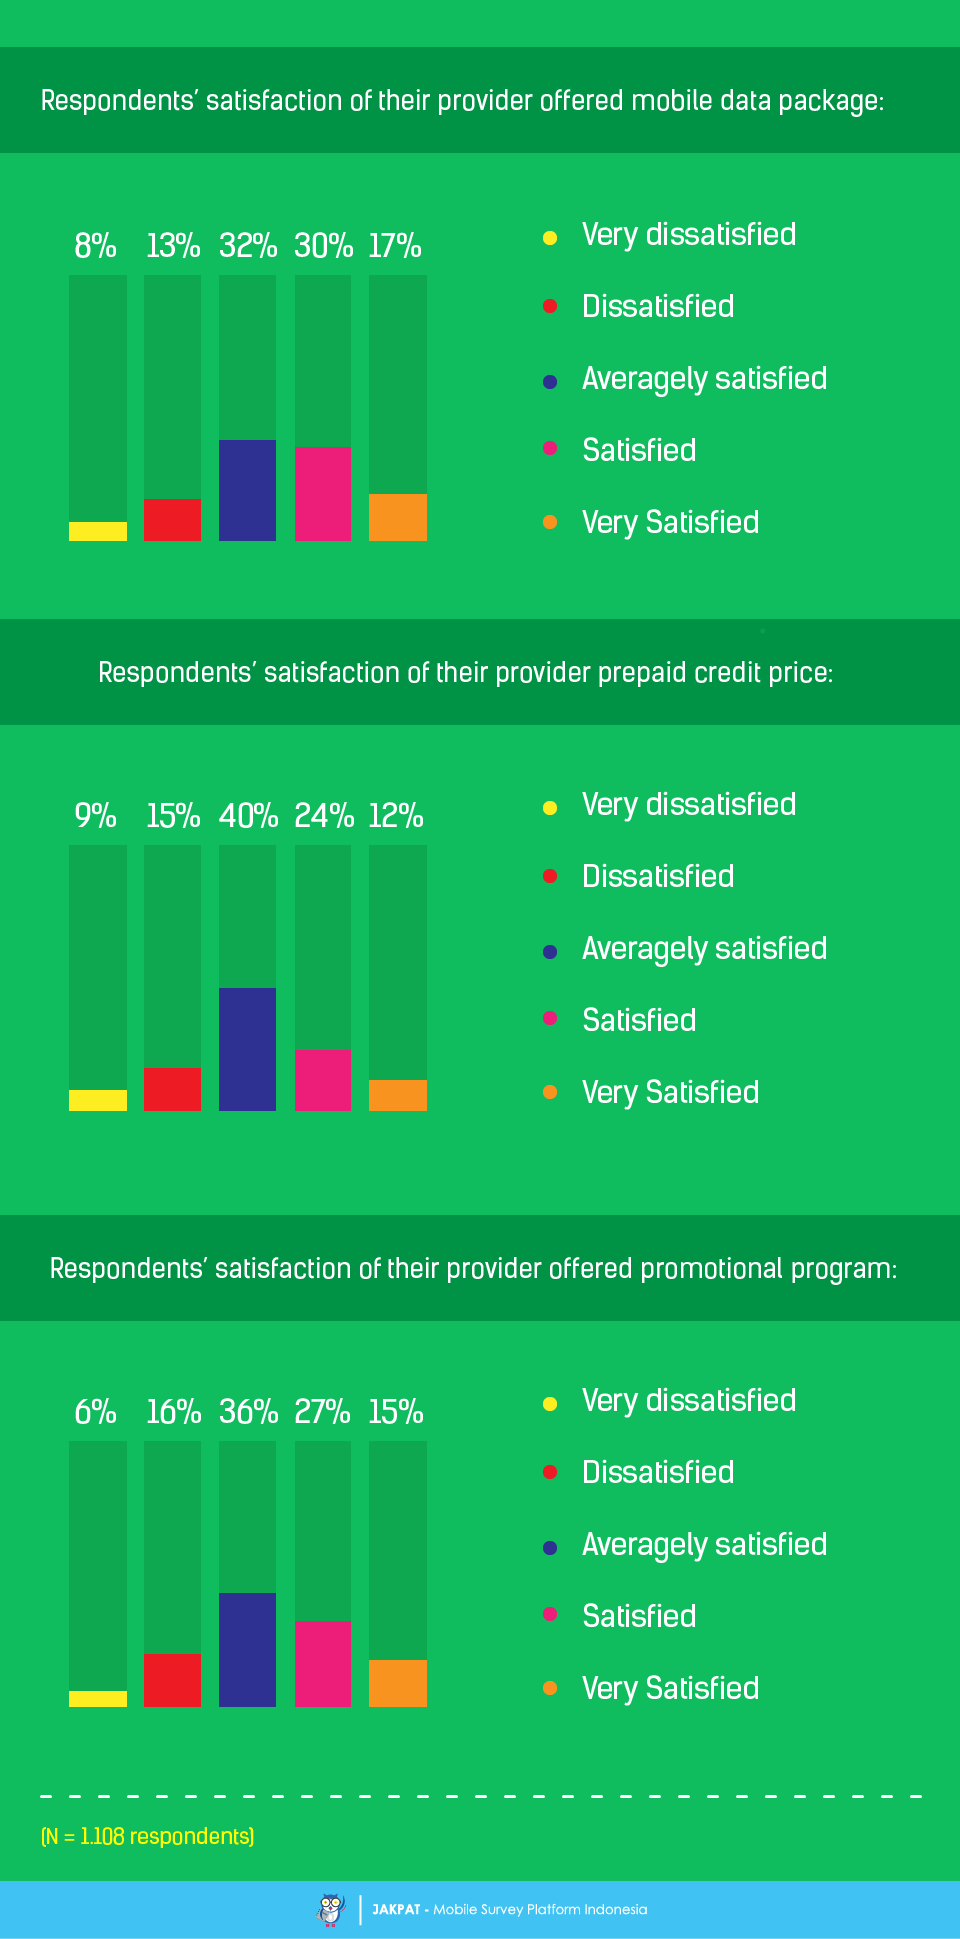
In order to measure respondents’ satisfaction of telecommunication provider service value, we ask several questions such as their satisfaction of their provider mobile data package, prepaid credit price, and offered promotional program. Compared to the aspects of provider’s service performance, the service value is considered as lower satisfying for respondents in this survey. Most respondents in this survey are only averagely satisfied with the offered mobile data package, prepaid credit price, and promotional program.
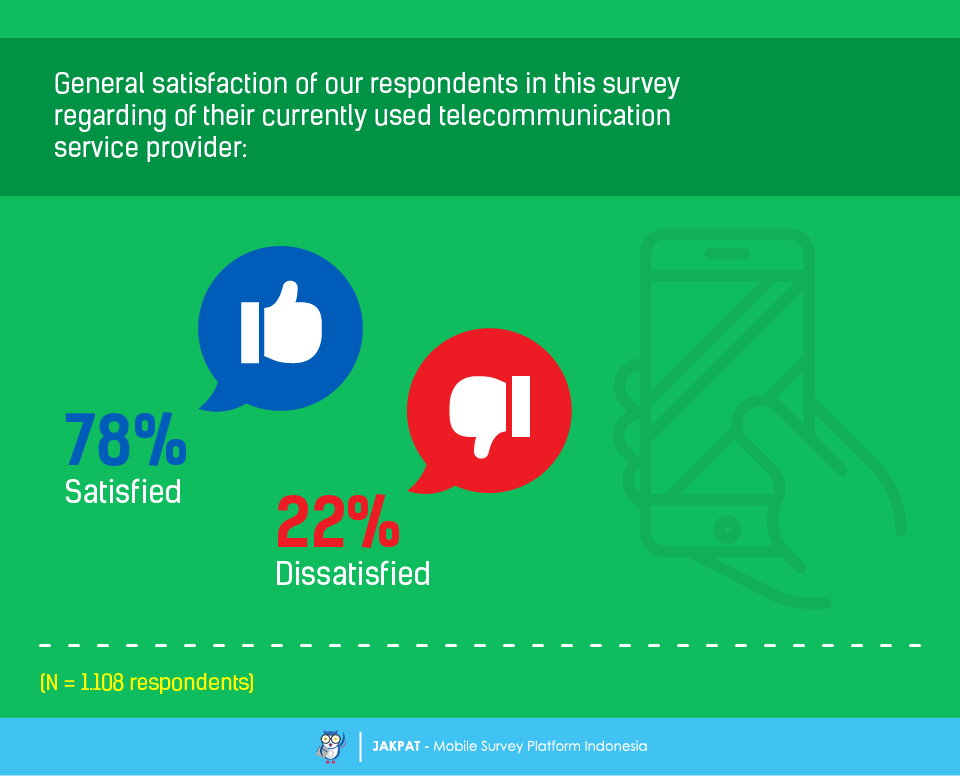
In general, we would like to map the general satisfaction of our respondents regarding their currently used telecommunication service provider. According to our respondents’ answer, we find that 78% of our respondents are satisfied with general performance and value of telecommunication service provider they currently used. Keeping consumer satisfaction then becomes an important step to ensure consumer loyalty for this industry.
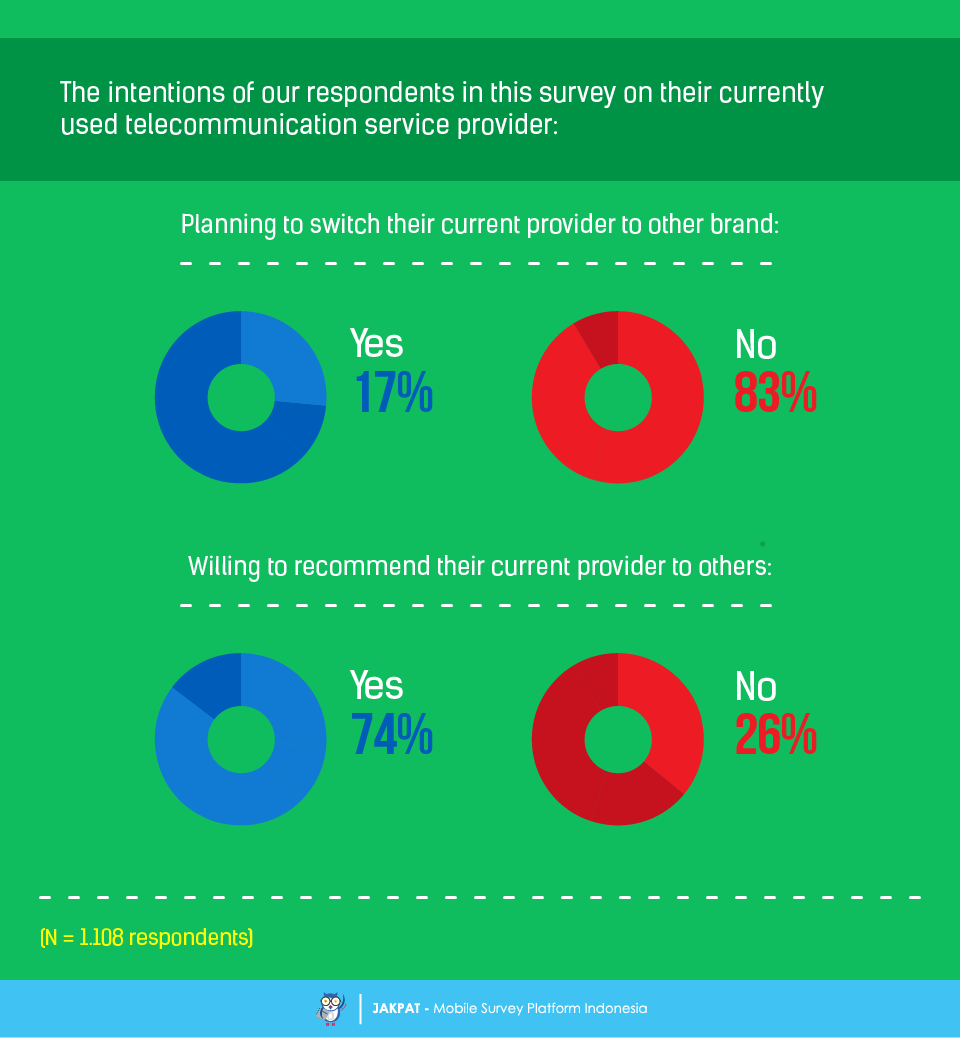
At last, we further as about respondents’ intentions on their currently used telecommunication service provider. Since most respondents in this survey are satisfied with the value and performance of their telecommunication service provider, 83% of them have the potential of being the loyal consumer since they do not want to switch to another brand. Moreover, 74% of them even have the potential of being an influencer since they would like to recommend their currently used provider to others.
 For more detail you can download XLS report at the button below (bahasa). JAKPAT report consists of 3 parts which are 1) Respondent Profile, 2) Crosstabulation for each question and 3) Raw Data. Respondent profile shows you demographic profiles ( gender,age range, location by province, and monthly spending). Cross tabulation enables you to define different demographic segment preference on each answer.
![]()
You can also download PDF here:
![]()

or Get A Sales Quote by filling this form or Call to +622745015293
