

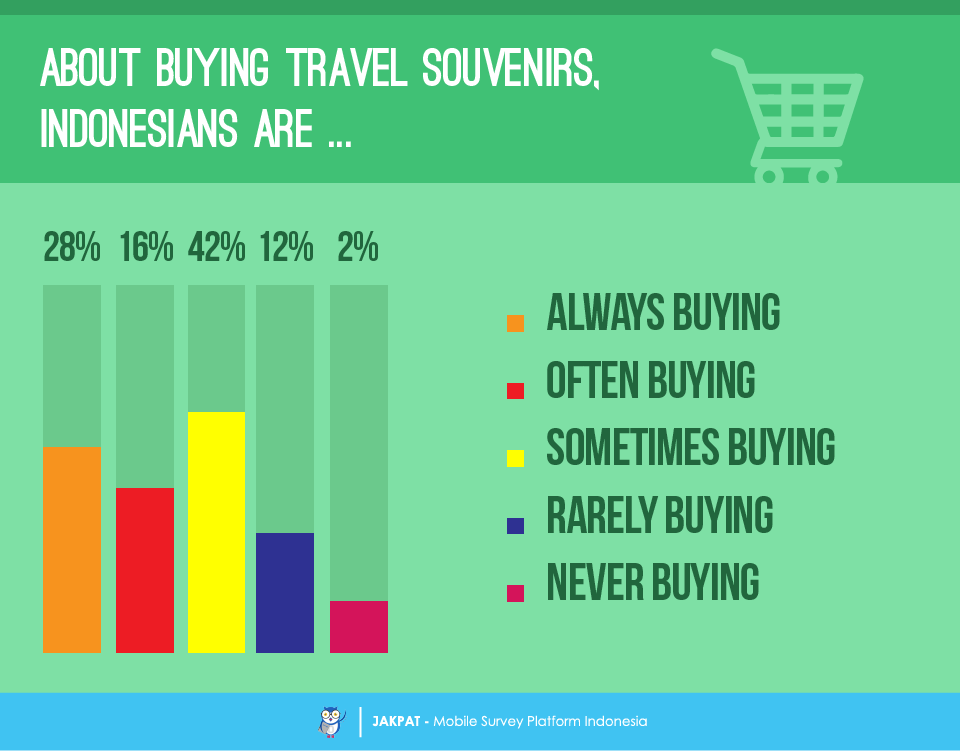
Travel souvenirs are one of the ways to deeply enhance memories of a traveling experience. As a country with communal society embedded in the culture, Indonesian travelers find purchasing travel souvenirs for people at home is important. Therefore, recently Jakpat has conducted a survey in order to see Indonesians’ habit and preferences regarding to purchase travel souvenirs. This survey involved 1125 respondents from across Indonesia. For the further notes, Jakpat’s respondents in this survey are Indonesian smart-phone users, with a range of age from 18 to 45 year-old. Regarding to this survey, first of all, we found that many of our respondents (42%) admit that they sometimes buy travel souvenirs when traveling. Meanwhile, some of them admit that they always buy (28%), often buy (16%), and rarely buy (12%) travel souvenirs. On the other hand, there are only 2% of them who admit that they never buy travel souvenirs when traveling.
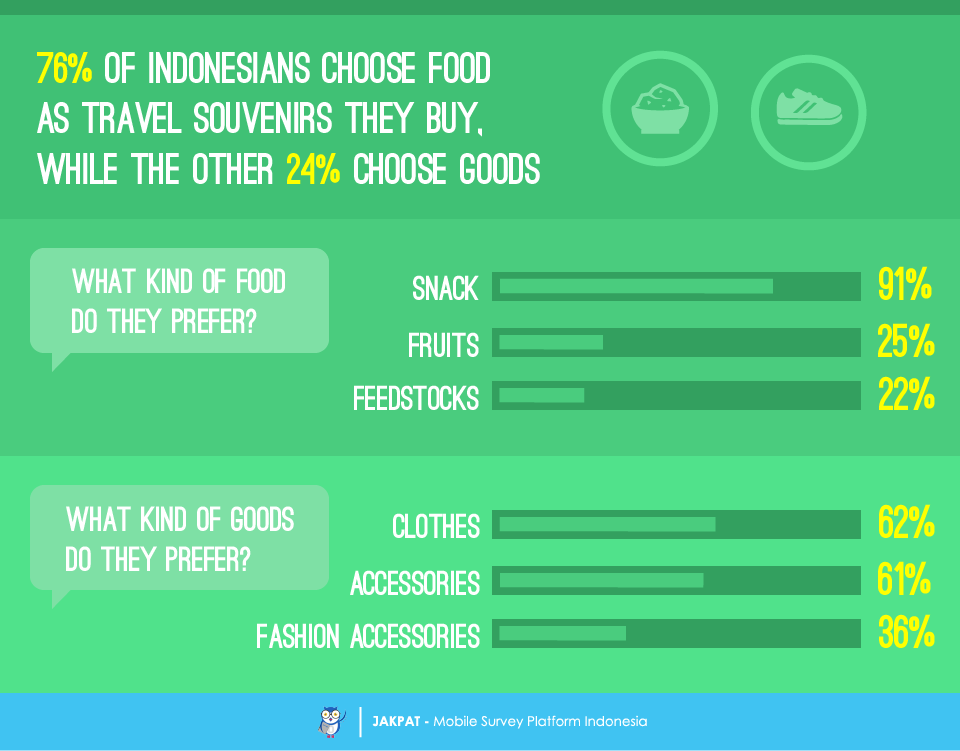
Regarding to which type of travel souvenirs they prefer to buy, apparently most of our respondents (76%) choose food, while the other 24% choose goods. Henceforth, women are more likely than men to choose food (77% VS 74%), while men are more likely than women to choose goods (26% VS 23%). Furthermore, from those who prefer to buy food as travel souvenirs, snack is the most popular item as chosen by 91% of them. Subsequently, the second most popular food item is fruit (25%) and the third one is feedstock (22%). From those who prefer to buy goods as travel souvenirs, clothes are the most popular item as chosen by 62% of them, while accessories such as key chain and perfume are closely behind as chosen by 61% of them. The third most popular goods item is fashion accessories such as hats and eye-glasses as chosen by 36% of them.
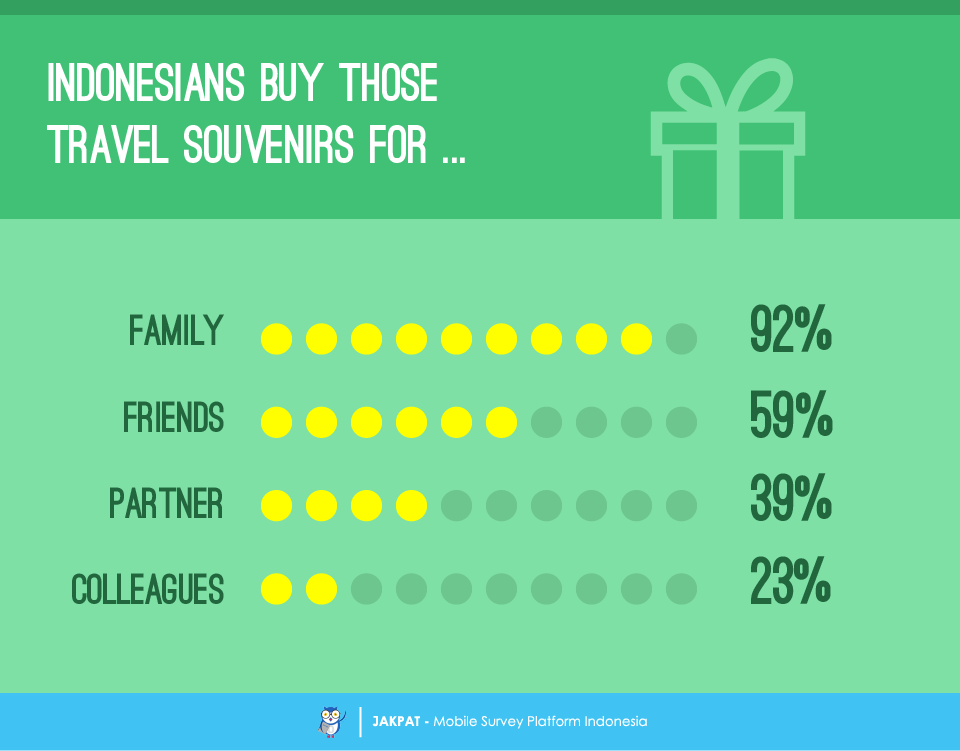
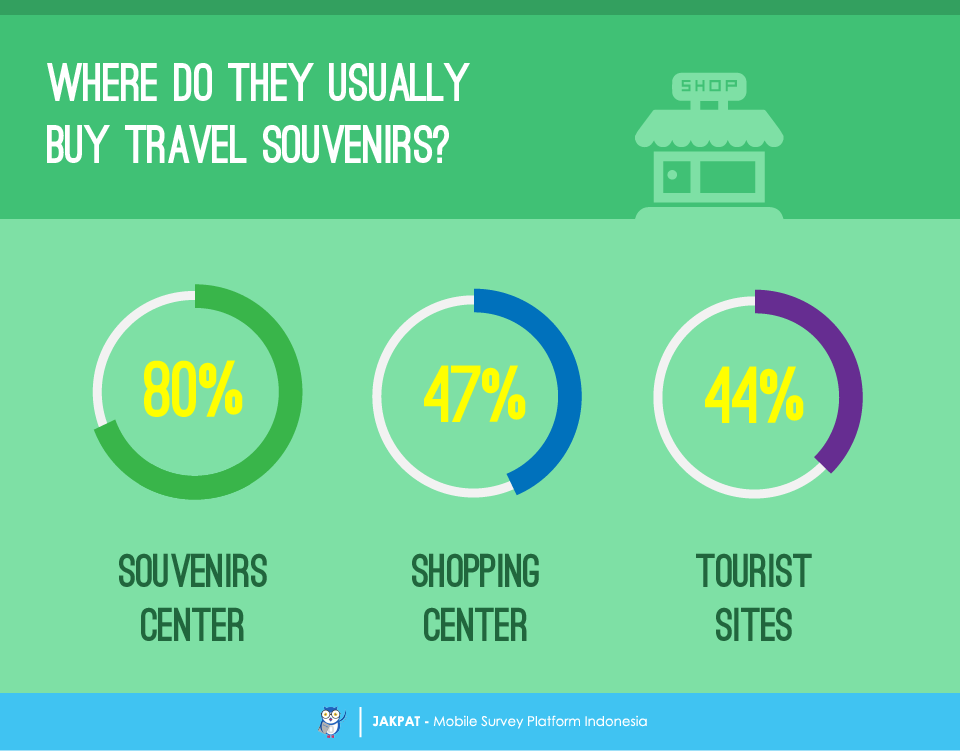
When asked about whom they buy travel souvenirs for, almost all of our respondents (92%) state that they buy it for their family, while more than half of them (59%) buy it for their friends. There are also 39% of them who admit that they buy travel souvenirs for their partner, and 23% of them who buy for their colleagues. Concurrently, when asked about the place where they usually buy travel souvenirs, most of our respondents (80%) say that they buy it at souvenirs center. There are also 47% of them who buy travel souvenirs at shopping center, while there are 44% of them who buy it at tourist sites they visit during traveling.
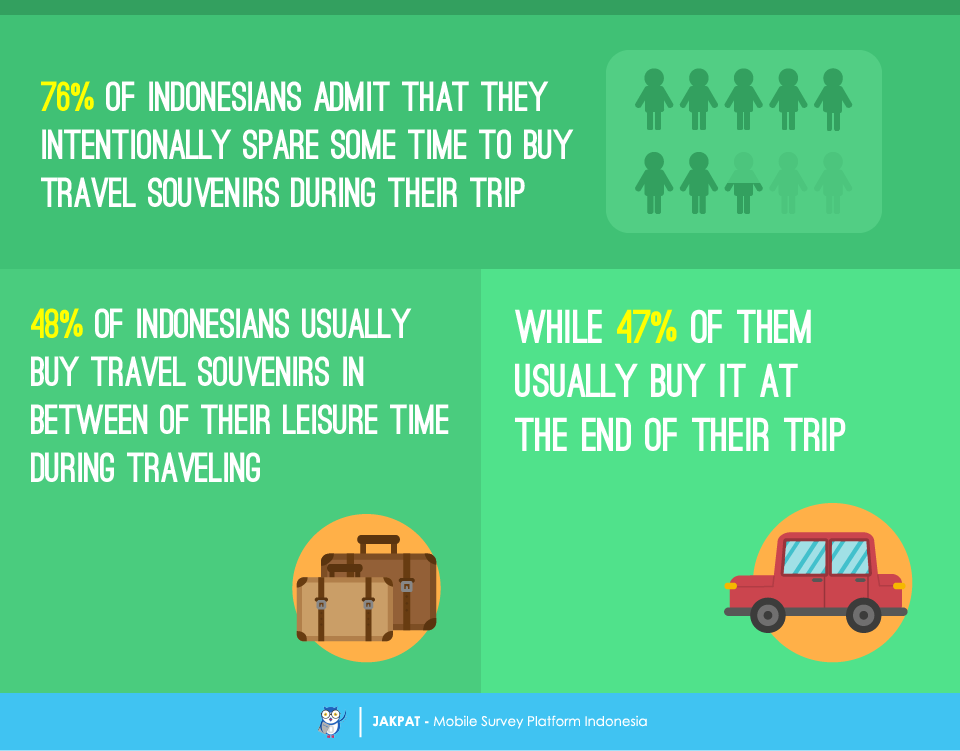
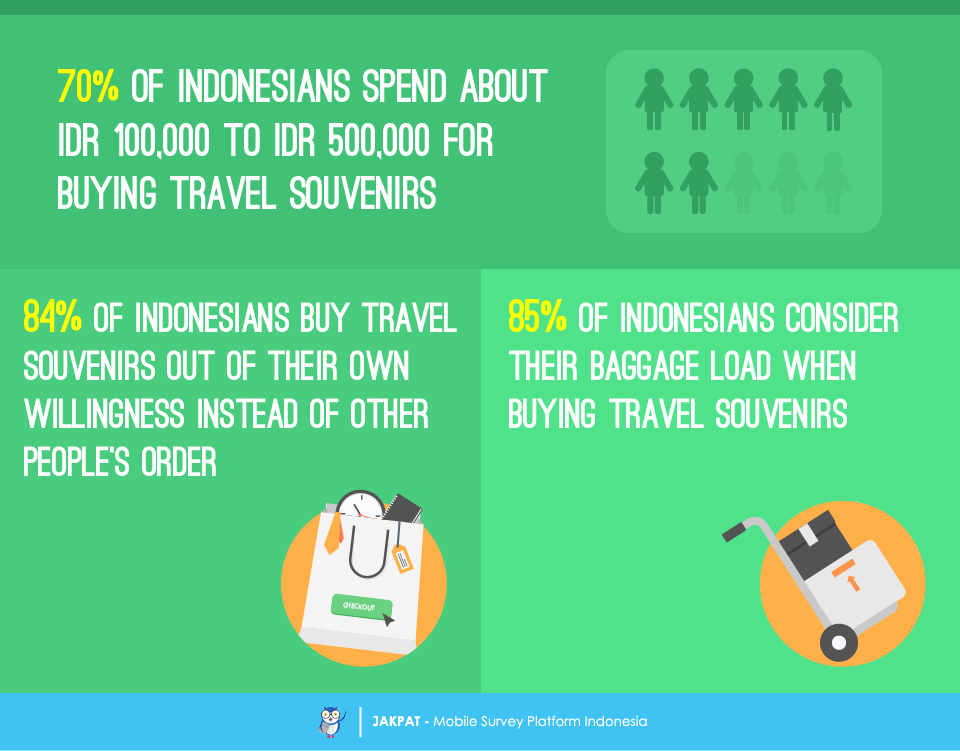
Regarding to some habit in buying travel souvenirs, we found that there are 76% of our respondents who intentionally spare some time during their trip in order to buy travel souvenirs. Surprisingly, there are more men than women who admit that (76% VS 75%). Henceforth, they usually buy it in between of their leisure time during traveling (48%) or near the end of their trip (47%). Furthermore, related to the expense they spend for buying travel souvenirs, apparently most of our respondents (70%) spend about IDR 100,000 to IDR 500,000. Meanwhile, there are 16% of them who spend less than IDR 100,000, and also 10% of them who admit that they usually spend about IDR 500,000 to IDR 1,000,000 for buying travel souvenirs. Subsequently, most of our respondents (84%) admit that they buy travel souvenirs out of their own willingness instead of other people’s errand. Furthermore, we found out that apparently most of our respondents (85%) consider their baggage load when buying travel souvenirs.
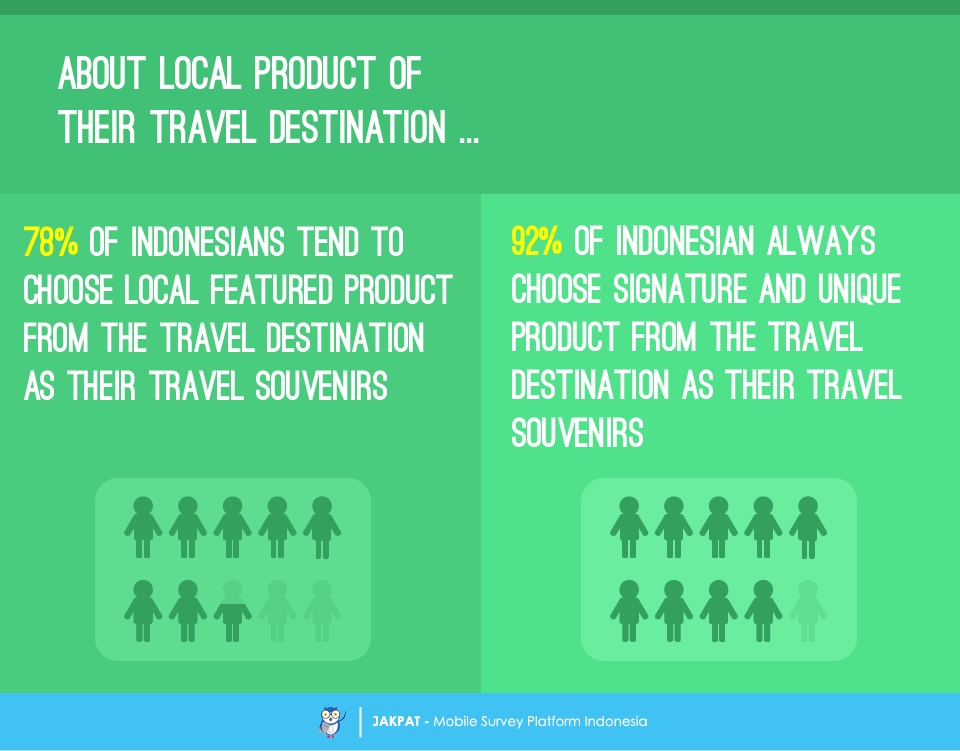
Lastly, we asked about local product of the travel destination as travel souvenirs they buy. Regarding to the local product of their travel destination, most of our respondents (78%) admit that they tend to choose local featured product from their travel destination as travel souvenirs. Concurrently, almost all of our respondents (92%) agree that they always choose signature and unique product from their travel destination as travel souvenirs.
For more detail you can download XLS report at the button below (bahasa). JAKPAT report consists of 3 parts which are 1) Respondent Profile, 2) Crosstabulation for each question and 3) Raw Data. Respondent profile shows you demographic profiles ( gender,age range, location by province, and monthly spending). Cross tabulation enables you to define different demographic segment preference on each answer.
![]()
You can also download PDF here:
![]()

or Get A Sales Quote by filling this form or Call to +622745015293
