


Valentine’s day is all about gift giving. This tradition is adapted in all around the world.
The average American will spend $142.31 on Valentine’s Day gifts this year,according to a survey by the National Retail Federation released last month. How bout Indonesia?
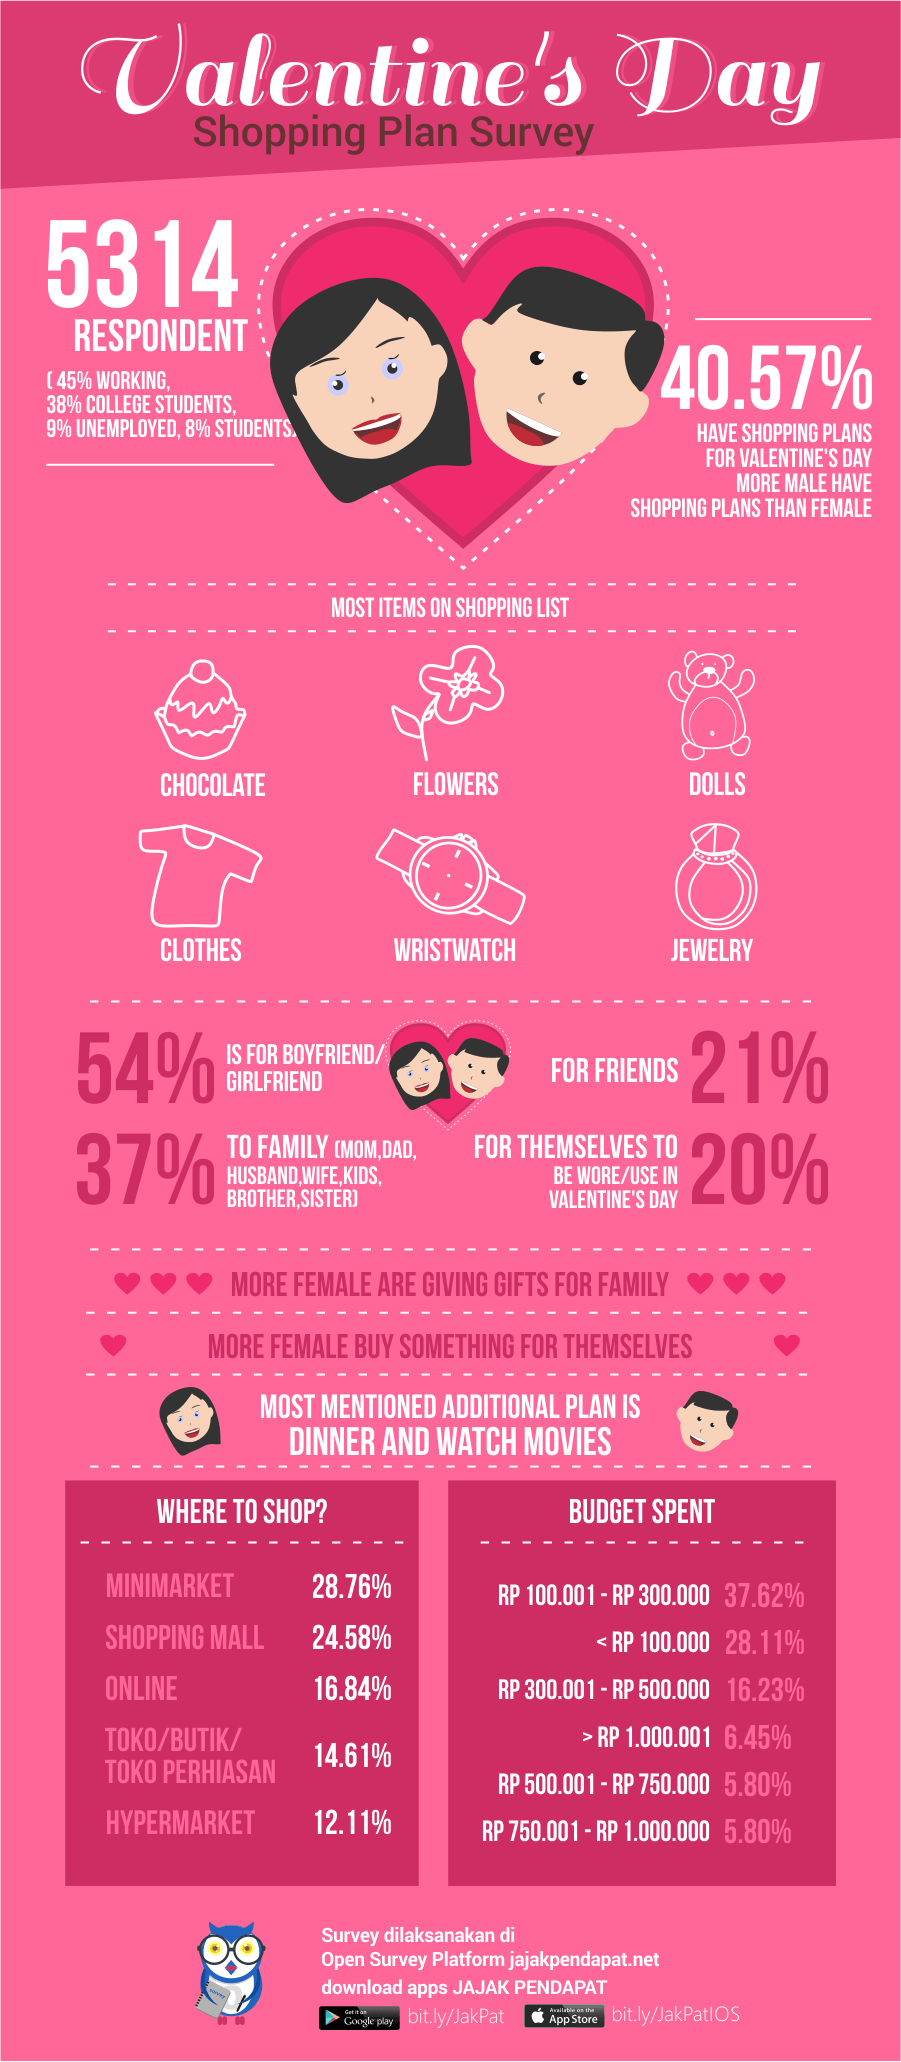
JAKPAT did a one day survey toward 5314 respondents which consists of :
| Gender | Male | Female |
| Percentage | 49.83% | 50.17% |
| No of Panel | 2648 | 2666 |
| Age Range | < 16 | 16-19 | 20-25 | 26-29 | 30-35 | 36-39 | 40-45 | > 45 |
| Percentage | 3.67% | 16.86% | 52.22% | 14.02% | 8.54% | 2.65% | 1.32% | 0.72% |
| No of Panel | 195 | 896 | 2775 | 745 | 454 | 141 | 70 | 38 |
| Spending Level | < USD 100 | USD 101 – 200 | USD 201 – 300 | USD 301 – 500 | USD 501 – 750 | > USD 750 |
| Percentage | 41.95% | 34.21% | 13.04% | 6.93% | 1.90% | 1.98% |
| No of Panel | 2229 | 1818 | 693 | 368 | 101 | 105 |
And around 38% of them are college students, 8% are students, 9% are unemployed, and rest of them 45% is working segment.
Valentine’s Shopping Plan Male vs Female
We asked whether they have some plan for shopping for Valentine’s day. Then the rest of the survey questions were only asked to respondents that have shopping plan for Valentine’s day.

Let’s compare male vs female result
|
Q1 (single answer) : Do you have a plan to do a shopping for Valentine’s Day
|
Total
|
Gender | |
| Male | Female | ||
|
Option 1 : Yes
|
2156 | 1191 | 965 |
| 40.57% | 44.98% | 36.20% | |
|
Option 2 : No
|
3158 | 1457 | 1701 |
| 59.43% | 55.02% | 63.80% | |
Favorite item predictably : Chocolate!

With open text answer we asked respondents to share with us what are the items they plan to buy. Most favorite is chocolate, followed by flowers, doll, clothes, shoes, and wrist watch.
| # | Answer | Total Answer | Percentage |
|---|---|---|---|
| 1 | Chocolate (1) | 723 | 33.52 % |
| 2 | Chocolate (2) | 143 | 6.63 % |
| 3 | Flowers (1) | 81 | 3.76 % |
| 4 | Dolls | 79 | 3.66 % |
| 5 | Clothes | 70 | 3.25 % |
| 6 | Shoes | 42 | 1.95 % |
| 7 | Wristwatch | 31 | 1.44 % |
| 8 | Chocolate (3) and Flower (2) | 29 | 1.34 % |
| 9 | Food | 28 | 1.3 % |
| 10 | Ring | 25 | 1.16 % |
| 11 | Cake/Cookies | 21 | 0.97 % |
| 12 | Bags | 16 | 0.74 % |
| 13 | Chocolate (4) and Flower (5) | 15 | 0.7 % |
| 14 | Clothes (2) | 14 | 0.65 % |
| 15 | Necklace | 12 | 0.56 % |
| 16 | Chocolate (5) | 12 | 0.56 % |
| 17 | Chocolate (6) and Doll (2) | 12 | 0.56 % |
| 18 | Jewelry | 11 | 0.51 % |
| 19 | Watch | 10 | 0.46 % |
| 20 | Books | 9 | 0.42 % |
54.36% Will be a Gift for Boyfriend/Girlfriend

And comparing male vs female
|
Q3 (multiple answer) : To Whom You’ll Shop The Item?
|
Total
|
Gender | |
| Male | Female | ||
|
Option 1 : Boyfriend/Girlfriend
|
1172 | 735 | 437 |
| 54.36% | 34.09% | 20.27% | |
|
Option 2 : Parents
|
426 | 207 | 219 |
| 19.76% | 9.60% | 10.16% | |
|
Option 3 : Brother/Sister
|
282 | 128 | 154 |
| 13.08% | 5.94% | 7.14% | |
|
Option 4 : Work Friends
|
132 | 60 | 72 |
| 6.12% | 2.78% | 3.34% | |
|
Option 5 : College Friends
|
190 | 98 | 92 |
| 8.81% | 4.55% | 4.27% | |
|
Option 6 : School Friends
|
142 | 81 | 61 |
| 6.59% | 3.76% | 2.83% | |
|
Option 7 : Myself, to be wore/use at Valentine’s day
|
450 | 169 | 281 |
| 20.87% | 7.84% | 13.03% | |
|
Option 8 : Other
|
352 | 177 | 175 |
| 16.33% | 8.21% | 8.12% | |
|
Total
|
3146 | 1655 | 1491 |
| 145.92% | 76.76% | 69.16% | |
Though most answers are refered to boyfriend/girlfriend, there are some unique insight if we compare male vs female answers. More male will shop valentine’s gift to girlfriend and their friends more than female. And more female will shop valentine’s gift to family, work friends and they also (13%) bought item for themselves to wear at Valentine’s day. That might includes the fashion stuff.
The other answers contain most words related to wife or husband and their daughter or sons as the gift recipient.
Where to buy?
| # | Option | Total Answer | Percentage |
|---|---|---|---|
| 1 | Minimarket | 620 | 28.76 % |
| 2 | Shopping Mall | 530 | 24.58 % |
| 3 | Online | 363 | 16.84 % |
| 4 | Specialty Shop/ Boutique/Jewelry Shop | 315 | 14.61 % |
| 5 | Hypermarket | 261 | 12.11 % |
| 6 | Other option | 67 | 3.11 % |
28.76% will shop Valentine’s item in Minimarket, and 24.58% will shop in Shopping mall, and suprisingly 16.84% will shop online. Though it’s not the top answer, still online is voted by significant no. of segment here.
Comparing male vs female respondent
|
Q4 (single answer) : Rencananya anda akan membeli barang tersebut secara online atau langsung di toko?
|
Total
|
Gender | |
| Male | Female | ||
|
Option 1 : Online
|
363 | 216 | 147 |
| 16.84% | 18.14% | 15.23% | |
|
Option 2 : Minimarket
|
620 | 358 | 262 |
| 28.76% | 30.06% | 27.15% | |
|
Option 3 : Hypermarket
|
261 | 132 | 129 |
| 12.11% | 11.08% | 13.37% | |
|
Option 4 : Shopping Mall
|
530 | 259 | 271 |
| 24.58% | 21.75% | 28.08% | |
|
Option 5 : Specialty Shop/Boutique/Jewelry Shop
|
315 | 195 | 120 |
| 14.61% | 16.37% | 12.44% | |
|
Option 6 : Other
|
67 | 31 | 36 |
| 3.11% | 2.60% | 3.73% | |
|
Total
|
2156 | 1191 | 965 |
| 100.00% | 100.00% | 100.00% | |
More male will shop online and in minimarket while more female will shop in the shopping mall.
Plan for Dinner and Watch Movies
We also asked do they plan other thing to do on Valentine’s day other than shopping any gift or item to be given or used during Valentine’s day. Dinner and watching movies are most mentioned answers.
| # | Answer | Total Answer | Percentage |
|---|---|---|---|
| 1 | None | 597 | 27.69 % |
| 2 | Dinner | 245 | 11.36 % |
| 3 | Watch Movies | 195 | 9.04 % |
| 4 | Yes | 131 | 6.08 % |
| 5 | None | 102 | 4.73 % |
| 6 | Eat out | 55 | 2.55 % |
| 7 | dinner | 46 | 2.13 % |
| 8 | Dinner | 25 | 1.16 % |
| 9 | Watch Movies | 16 | 0.74 % |
| 10 | Watch Movies | 16 | 0.74 % |
How much budget they plan to spend?
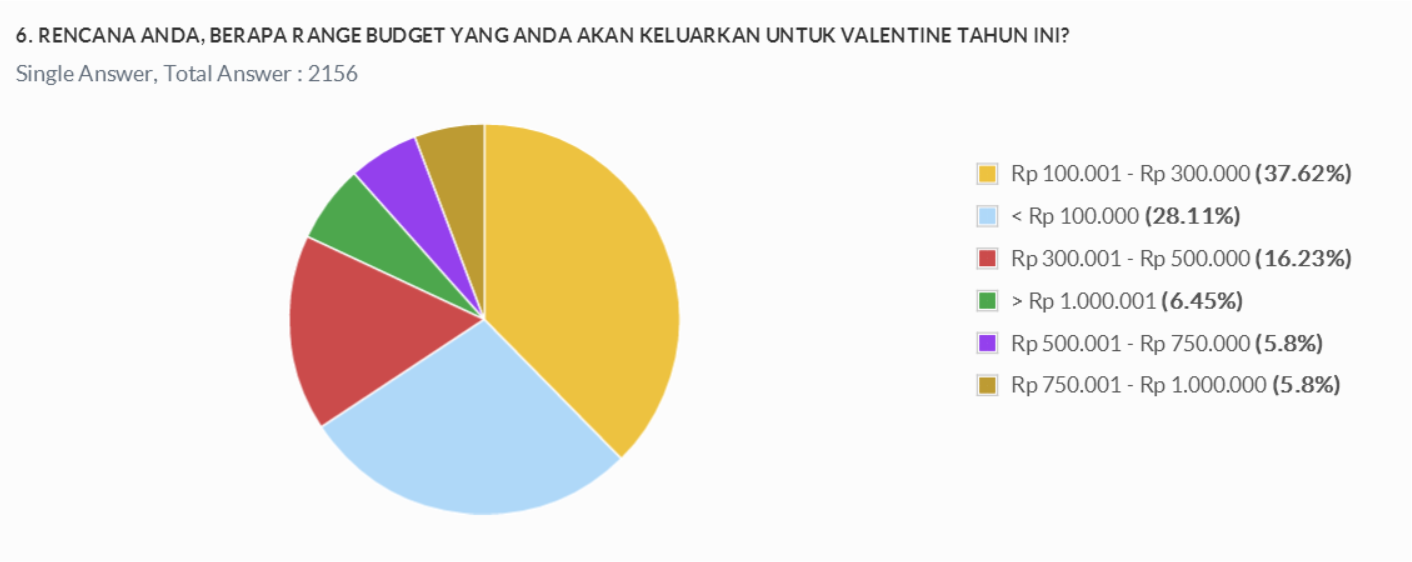
Comparing male vs female, we crosstab between male/female (divide for each monthly spending level) VS Valentine’s shopping budget:
| Female | |||||
| Budget/Month Spending | < USD 100 | USD 101 – 200 | USD 201 – 300 | USD 301 – 500 | USD 501 – 750 |
| < Rp 100.000 | 44.72% | 31.75% | 16.79% | 16.85% | 5.00% |
| Rp 100.001 – Rp 300.000 | 39.02% | 43.03% | 40.15% | 31.46% | 35.00% |
| Rp 300.001 – Rp 500.000 | 10.57% | 15.13% | 24.09% | 28.09% | 25.00% |
| Rp 500.001 – Rp 750.000 | 2.44% | 4.45% | 7.30% | 8.99% | 10.00% |
| Rp 750.001 – Rp 1.000.000 | 1.08% | 2.08% | 8.76% | 6.74% | 5.00% |
| > Rp 1.000.001 | 2.17% | 3.56% | 2.92% | 7.87% | 20.00% |
| Grand Total | 100.00% | 100.00% | 100.00% | 100.00% | 100.00% |
Male
| Male | |||||
| Budget/Month Spending | < USD 100 | USD 101 – 200 | USD 201 – 300 | USD 301 – 500 | USD 501 – 750 |
| < Rp 100.000 | 39.04% | 18.36% | 12.90% | 8.05% | 3.70% |
| Rp 100.001 – Rp 300.000 | 36.33% | 40.82% | 33.55% | 24.14% | 25.93% |
| Rp 300.001 – Rp 500.000 | 10.86% | 17.63% | 20.00% | 22.99% | 37.04% |
| Rp 500.001 – Rp 750.000 | 4.18% | 6.52% | 11.61% | 13.79% | 7.41% |
| Rp 750.001 – Rp 1.000.000 | 3.55% | 8.94% | 14.84% | 14.94% | 7.41% |
| > Rp 1.000.001 | 6.05% | 7.73% | 7.10% | 16.09% | 18.52% |
| Grand Total | 100.00% | 100.00% | 100.00% | 100.00% | 100.00% |
For more detail you can download XLS report at the button below. AKPAT report consists of 3 parts which are 1) Respondent Profile, 2) Crosstabulation for each question and 3) Raw Data. Respondent profile shows you demographic profiles ( gendr,age range, locationby province, and monthly spending). Cross tabulation enables you to define different demographic segment preference on each answer.
![]()
Click the icon to download XLS report
And also PDF Report here:
If you’re interested to do survey on retail and consumer goods field toward our respondents, we have over 23,000 mobile respondents ranged from age 17-50 years old, smartphone active users, and located in all regions of Indonesia that has installed our app and readily answering your survey.
Those 23,000 respondents has been verified, profiled, and continuously tracked to make sure you get the updated profiles of them. Our respondents has been profiled based on their demographic (age,gender,location, spending level, profession,religion), lifestyle habit (smoking/non, gamers/non, wearing glasses/non, frequent flyer/non, online shopper/non), and also brand consumption level ( brand A users, brand B users in FMCG, Retail, E-commerce,etc).
If you want to do research toward our respondent, please signup here and directly create your survey there. Or directly contact our Bizdev - Chrisprastika at +62-878-3908-9833. To non-Indonesian client, we offer free translation from foreign languages includes English, Chinese,Hindi,etc.