

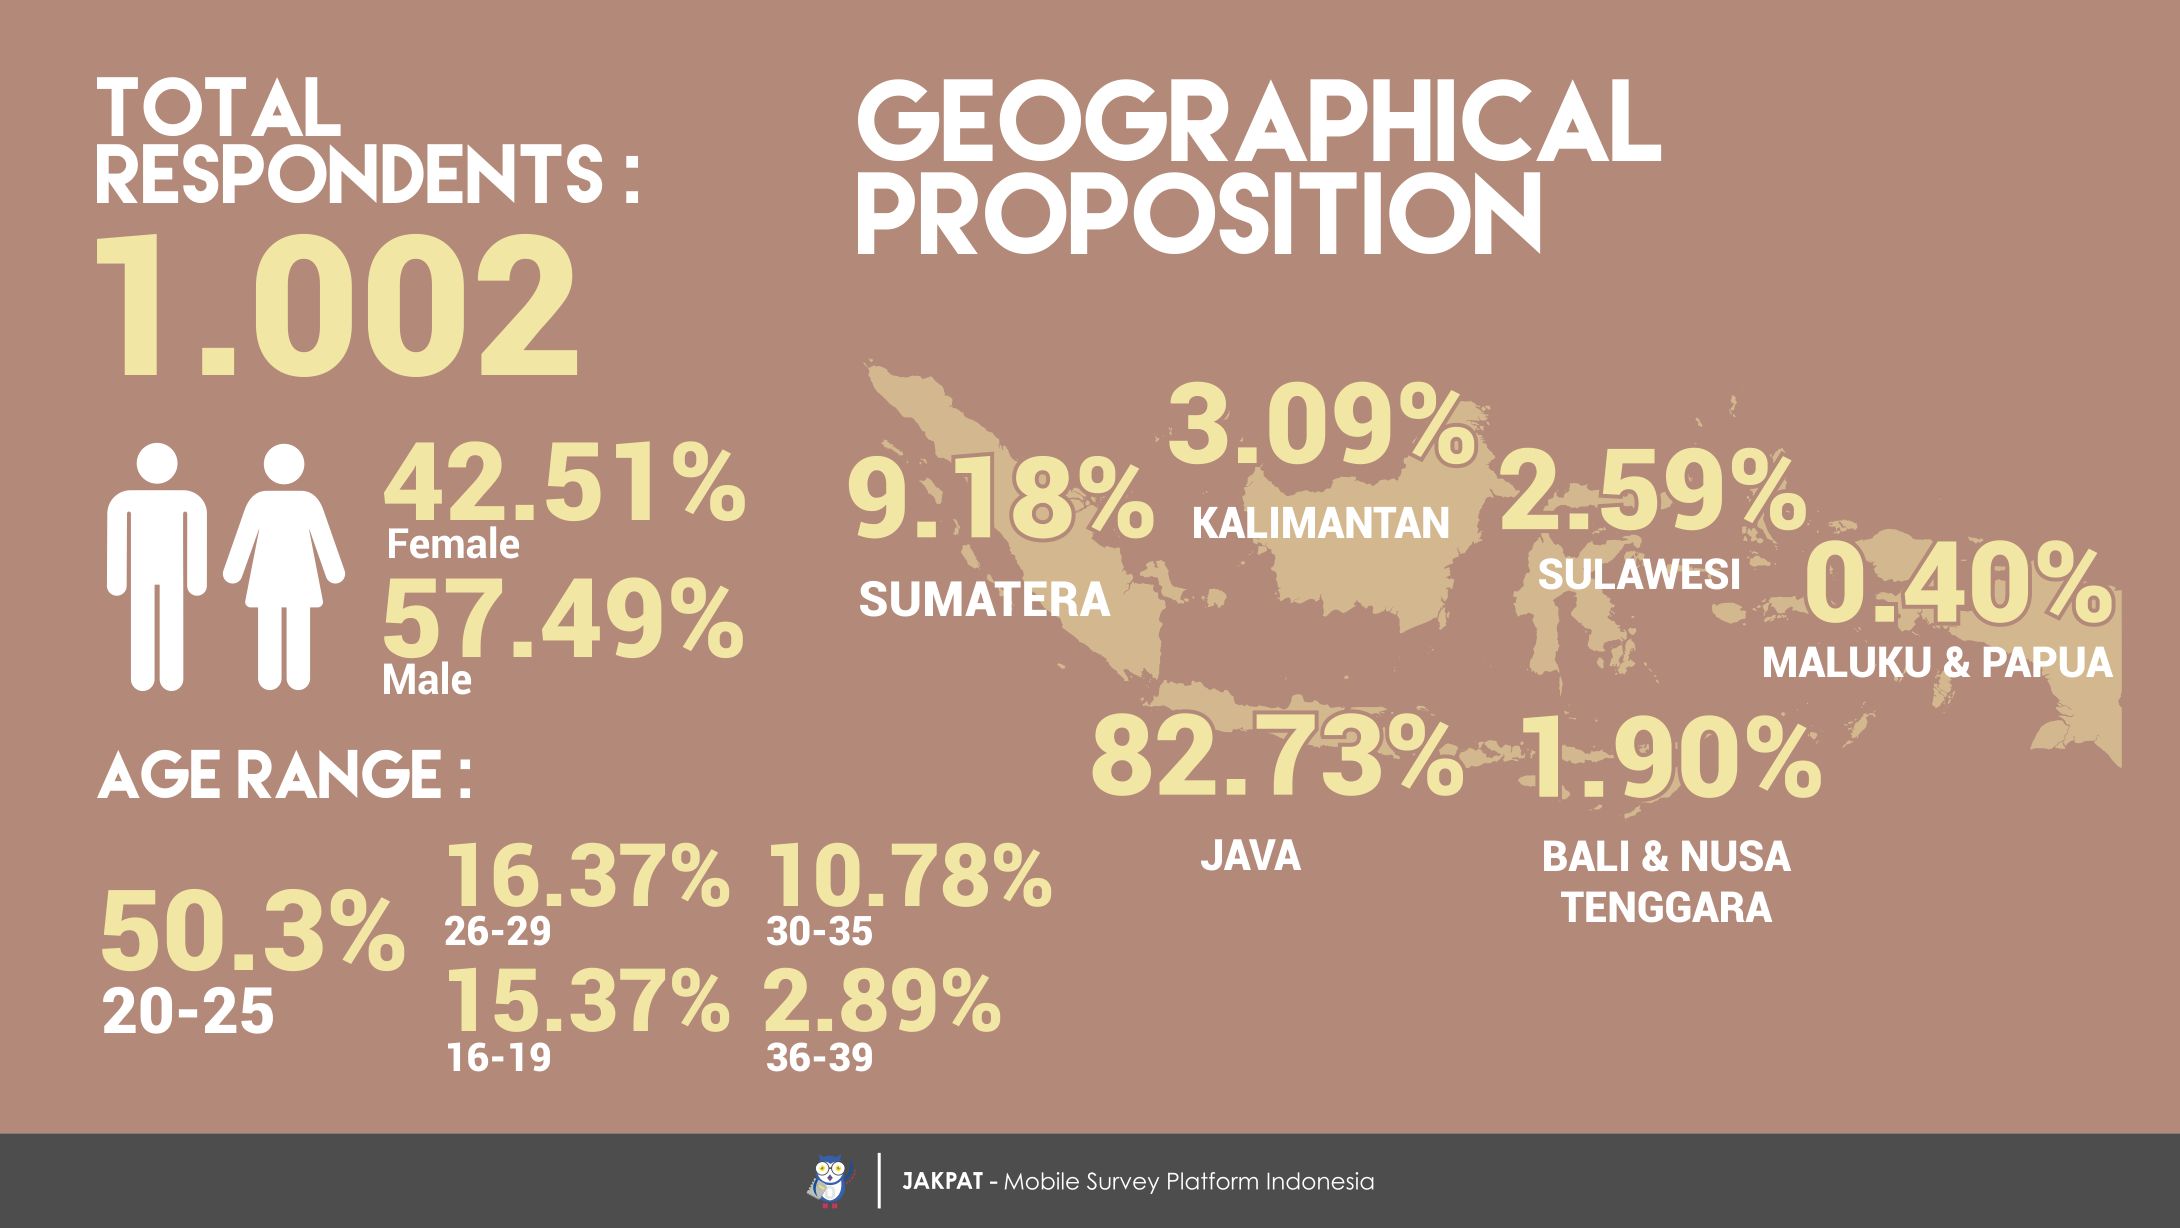
The growth and vast development of information and communication technology has led us to an era that has allowed us to exchange information through e-mails and with the help of online web browsers. We thought about finding out what our respondents had to say about their pattern or habit of using e-mail and a web browser of their choice. We managed to ask 1.002 respondents consisting of 42.51% female and 57.49% male. Our initial idea was to head-to-head compare the usage of e-mail and web browser for respondents who are students and who are employees. However we found that there is no significant difference at all in the pattern. For now we are delivering information and data in general without specific classification in the demography of the respondents involved in the survey.

Out of the 1002 respondents initially involved in the survey, only 987 of them who said yes to a question if they have and use an e-mail at all. For the 987 respondents, we asked how many e-mail accounts they used. Majority of them said 2 e-mail accounts (43.16%). Other answers include 1 e-mail account (25.33%), 3 e-mail accounts (17.33%), more than 5 e-mail accounts (9.12%), 4 e-mail accounts (3.65%), and lastly 5 e-mail accounts (1.42%). It is interesting that our respondents seem to have not only one e-mail account. Based on that we are moving to the next curious question.
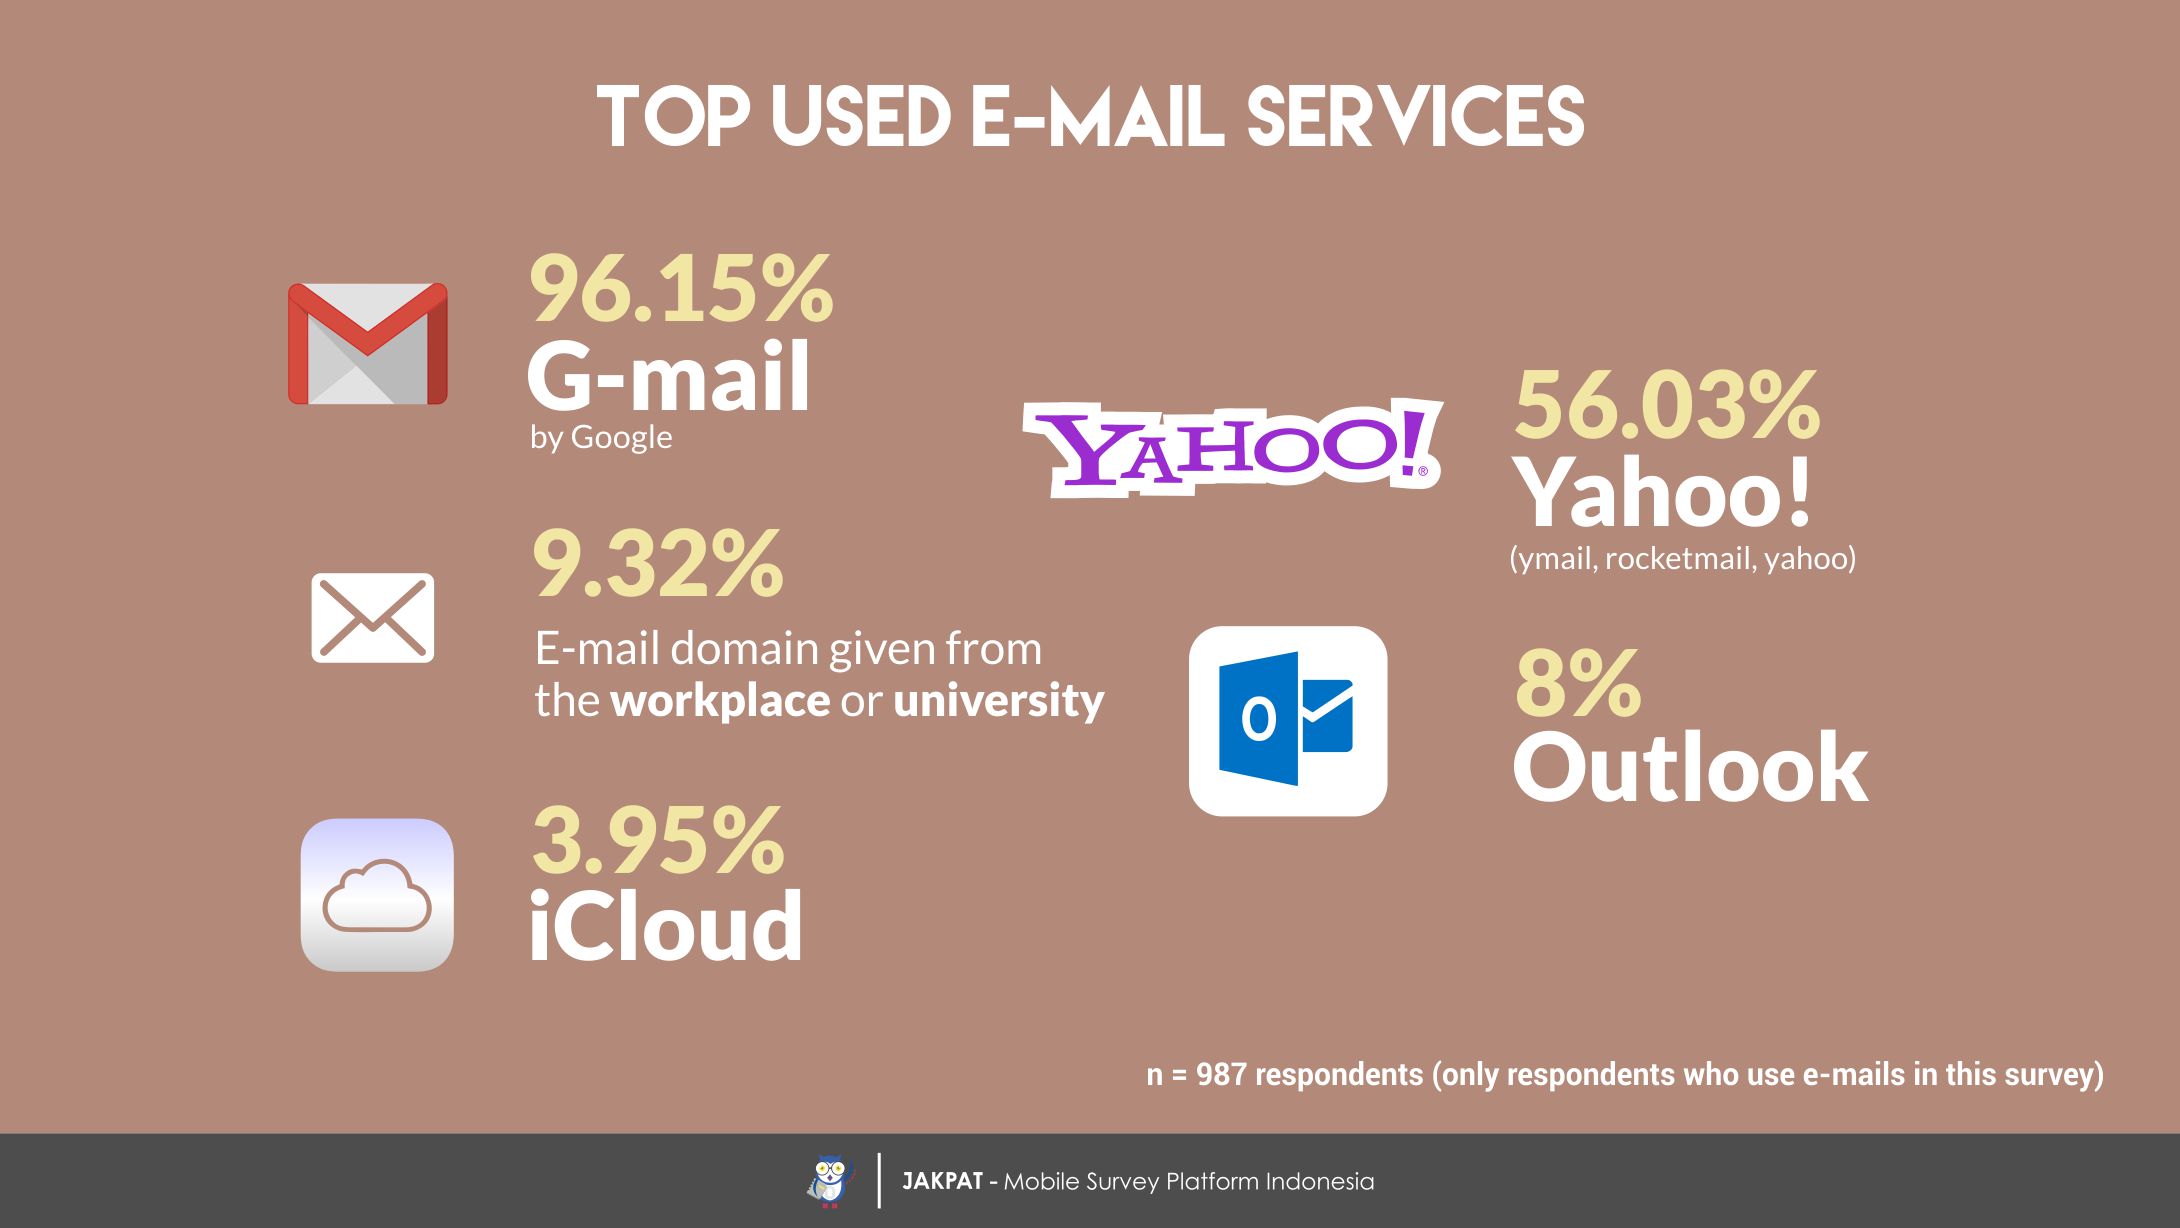
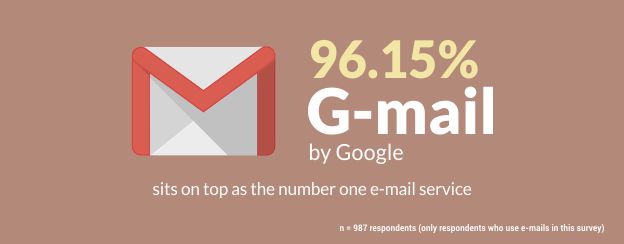
Although majority of the respondents use at least 2 e-mail accounts, we have found that there is one e-mail service that beats other e-mail services by quite much. We asked which e-mail services are used of all e-mail services out there available, and found that G-mail sits far on the top of the list being the most used e-mail service, as claimed by 96.15% of the respondents. The second place belongs to Yahoo!Mail which should include ymail, rocketmail and yahoo, as claimed by 56.03%. Other e-mail services include e-mail domain given from the workplace or university (9.32%), Outlook (8%), and iCloud (3.95%).
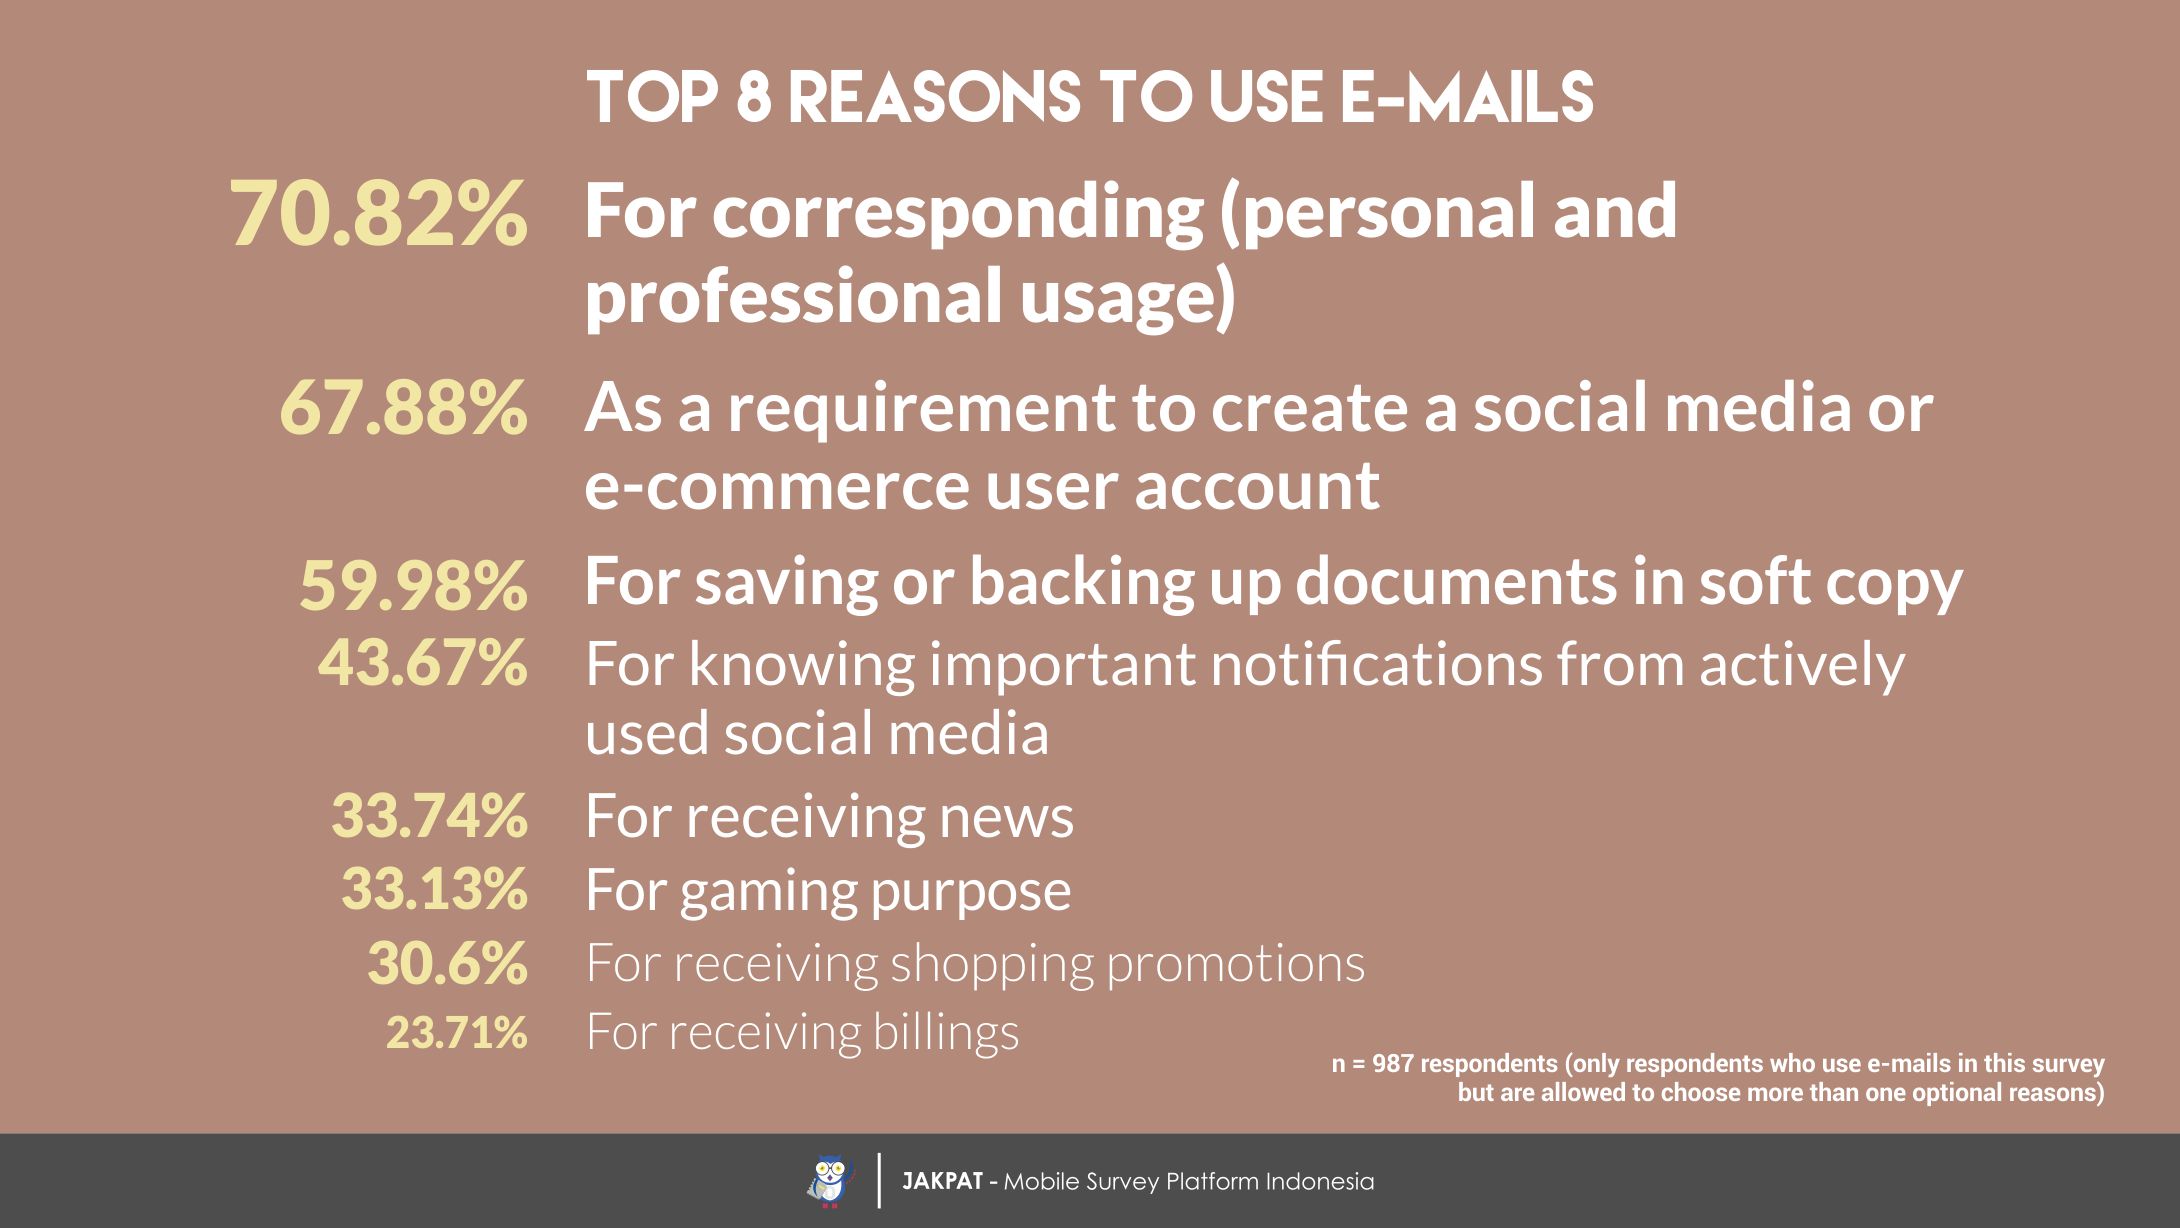
What is the purpose of using e-mail anyway? We then asked the respondents the same question. We found top 8 reasons to why they use e-mail. Being the number one reason as claimed by 70.82% respondents, it is for corresponding purpose; it is for either personal or professional usage. 67.88% of the respondents claim that they use their e-mail(s) as a requirement to create a social media or e-commerce user account. 59.98% of the respondents claim using e-mail for saving or backing up documents in the form of soft copy or soft file. 43.67% claim using e-mail for knowing important notifications from social media that the respondents actively use. Other reasons include for receiving news (33.74%), for gaming purpose (33.13%), for receiving shopping promotions (30.6%), and for receiving billings (23.71%).
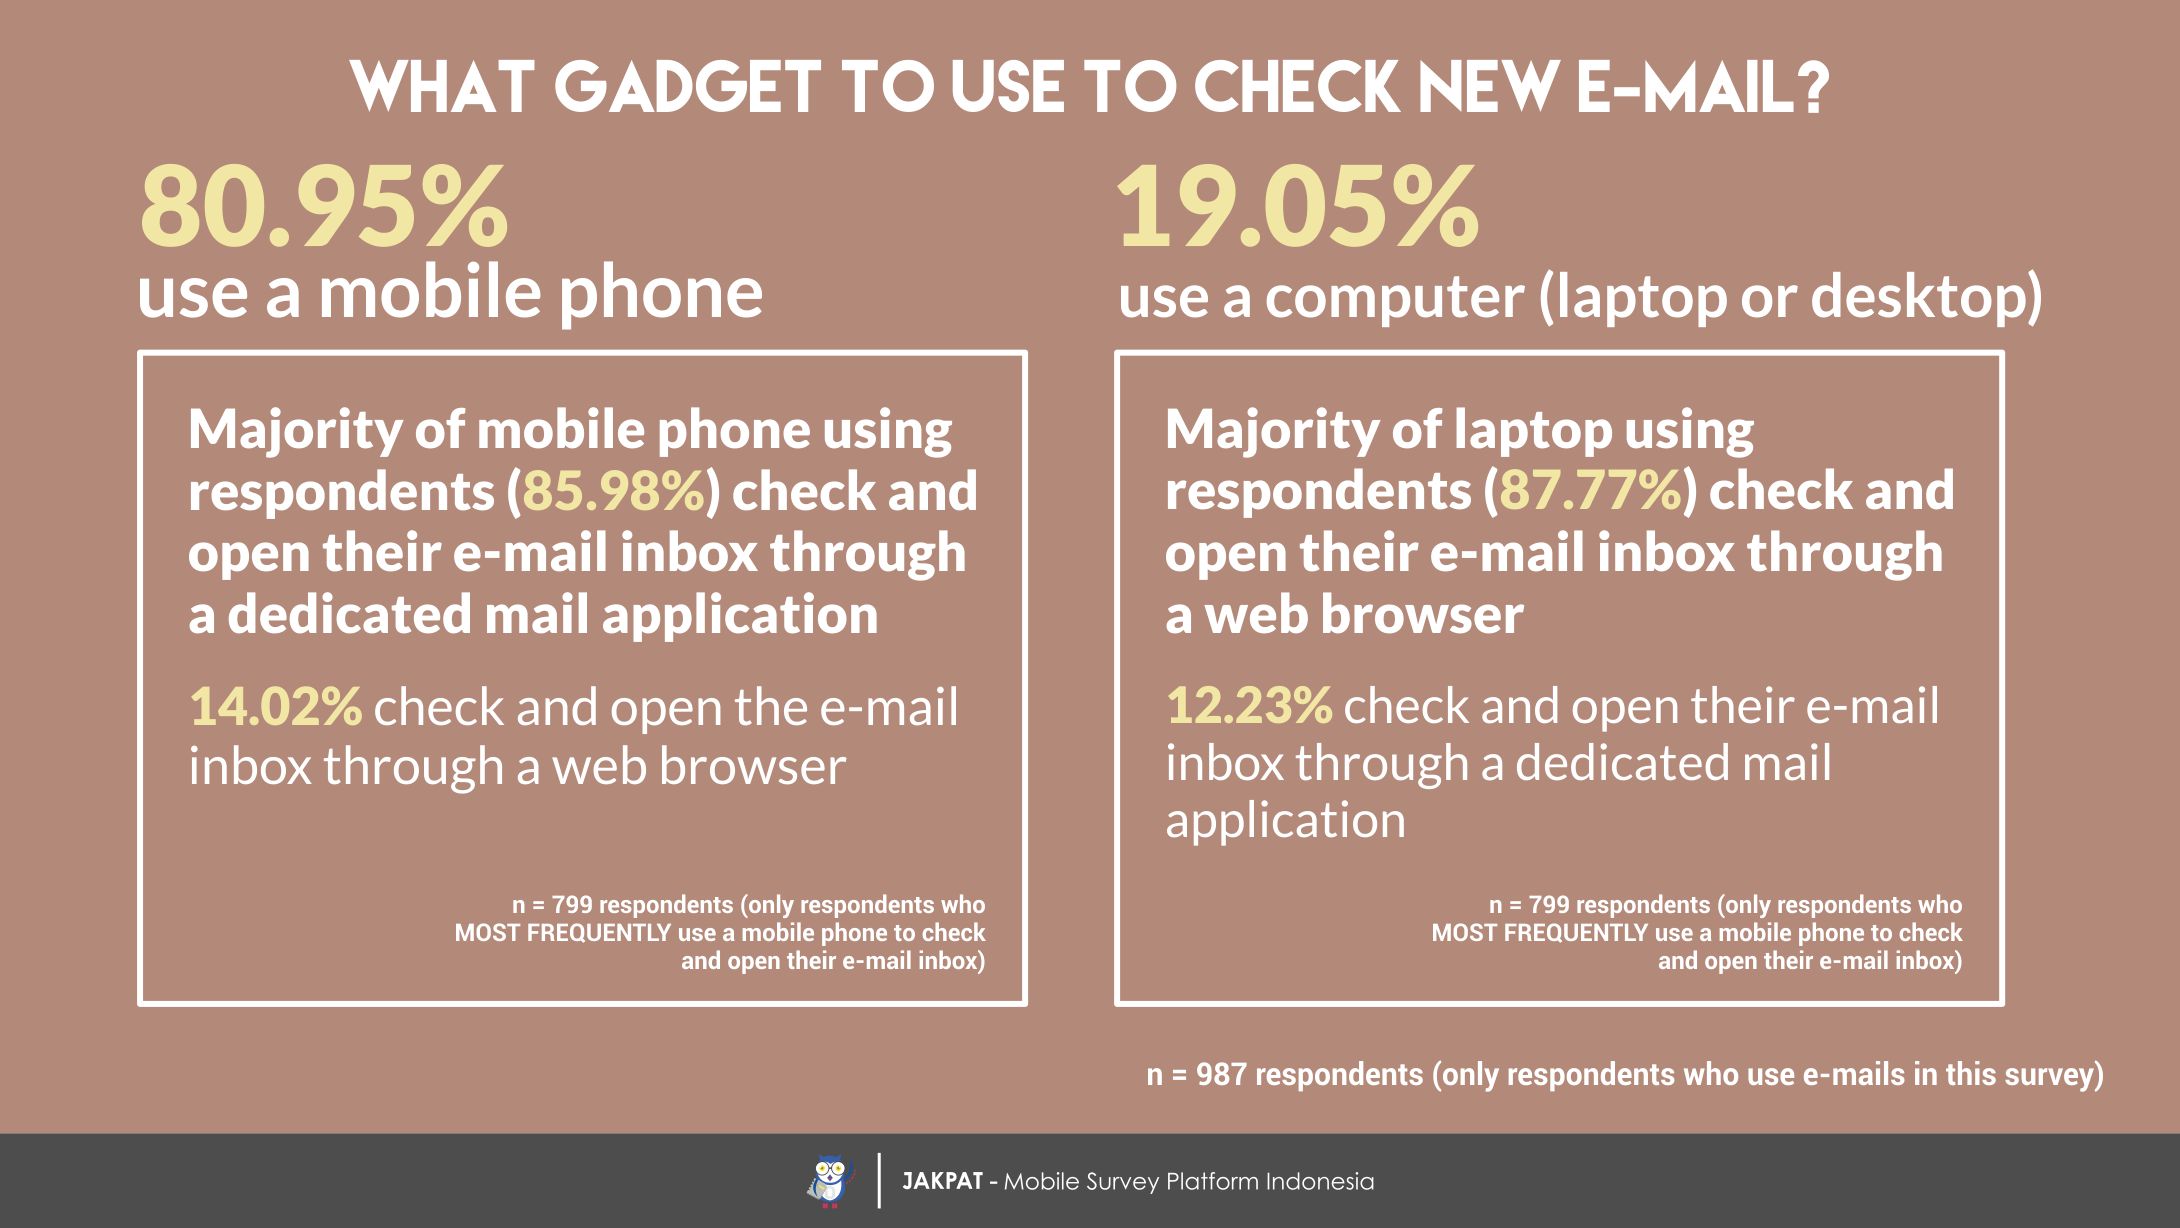
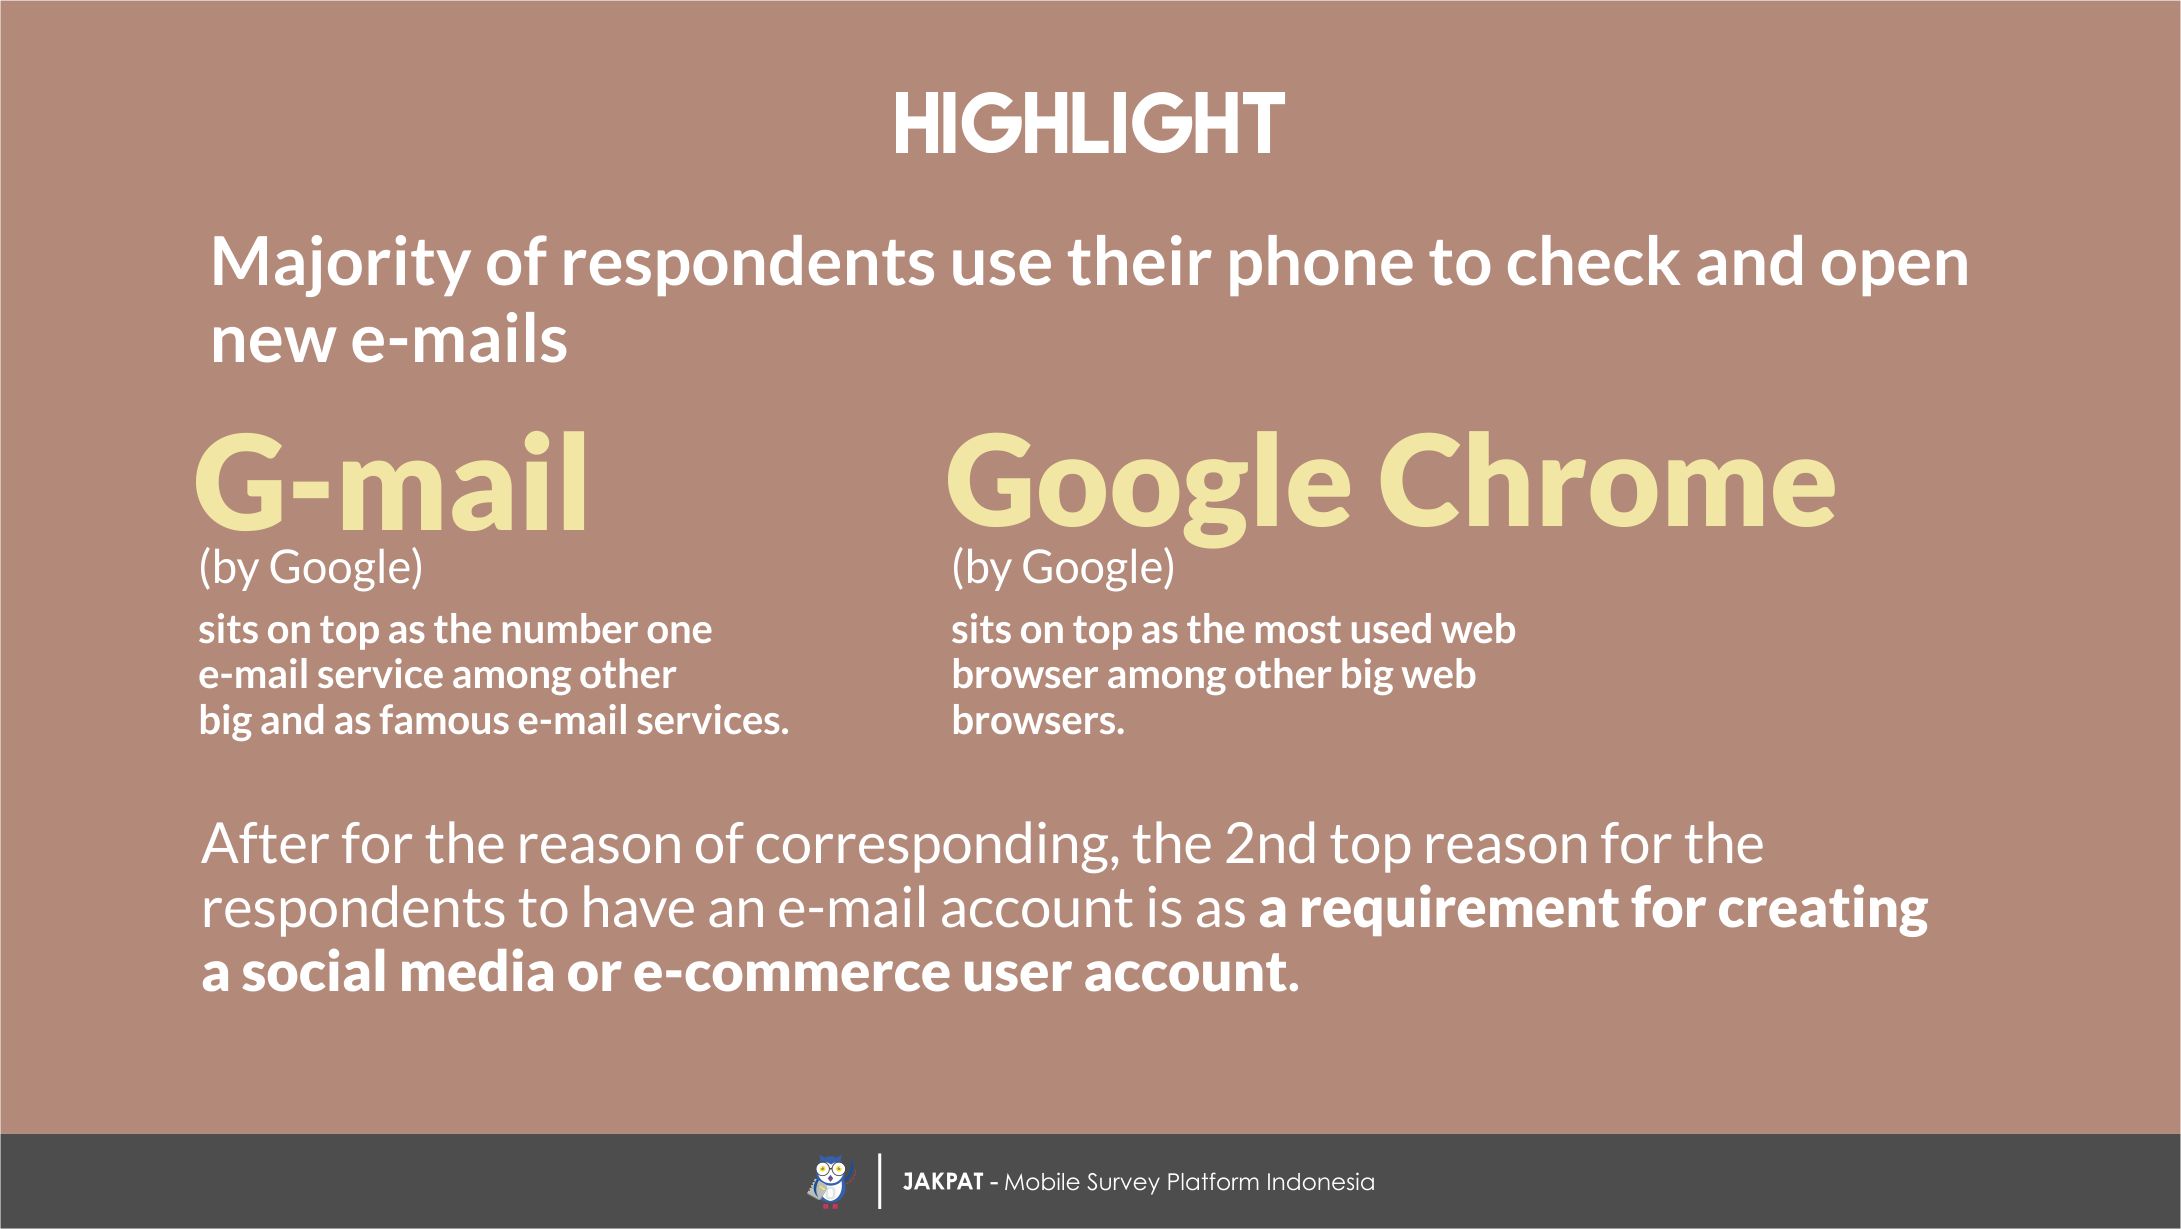
After knowing the number of e-mail accounts used and the reasons for using them, we then asked the respondents what type of gadget they use to actually check and open their e-mail inbox. We separated the option into two: a mobile phone and a computer (laptop or desktop). We found that out of 987 respondents who claimed to use e-mail, significant 80.95% claim that they check the e-mail from a mobile phone, and only 19.05% use a computer to do the task.
We then got even more specific with our question. We asked the respondents separately on whether they use a mail app or a web browser based on their answer to which gadget type they used. For respondents who claimed to use a mobile phone to check their e-mail, 85.98% claim that they check and open their e-mail inbox via a dedicated mail application, and only 14.02% do the task via a web browser. Then, the same question was asked to the respondents who previously claimed to use a computer to check and open their e-mail inbox. We found that 87.77% of the respondents do the task via a web browser while 12.23% via a dedicated mail application.
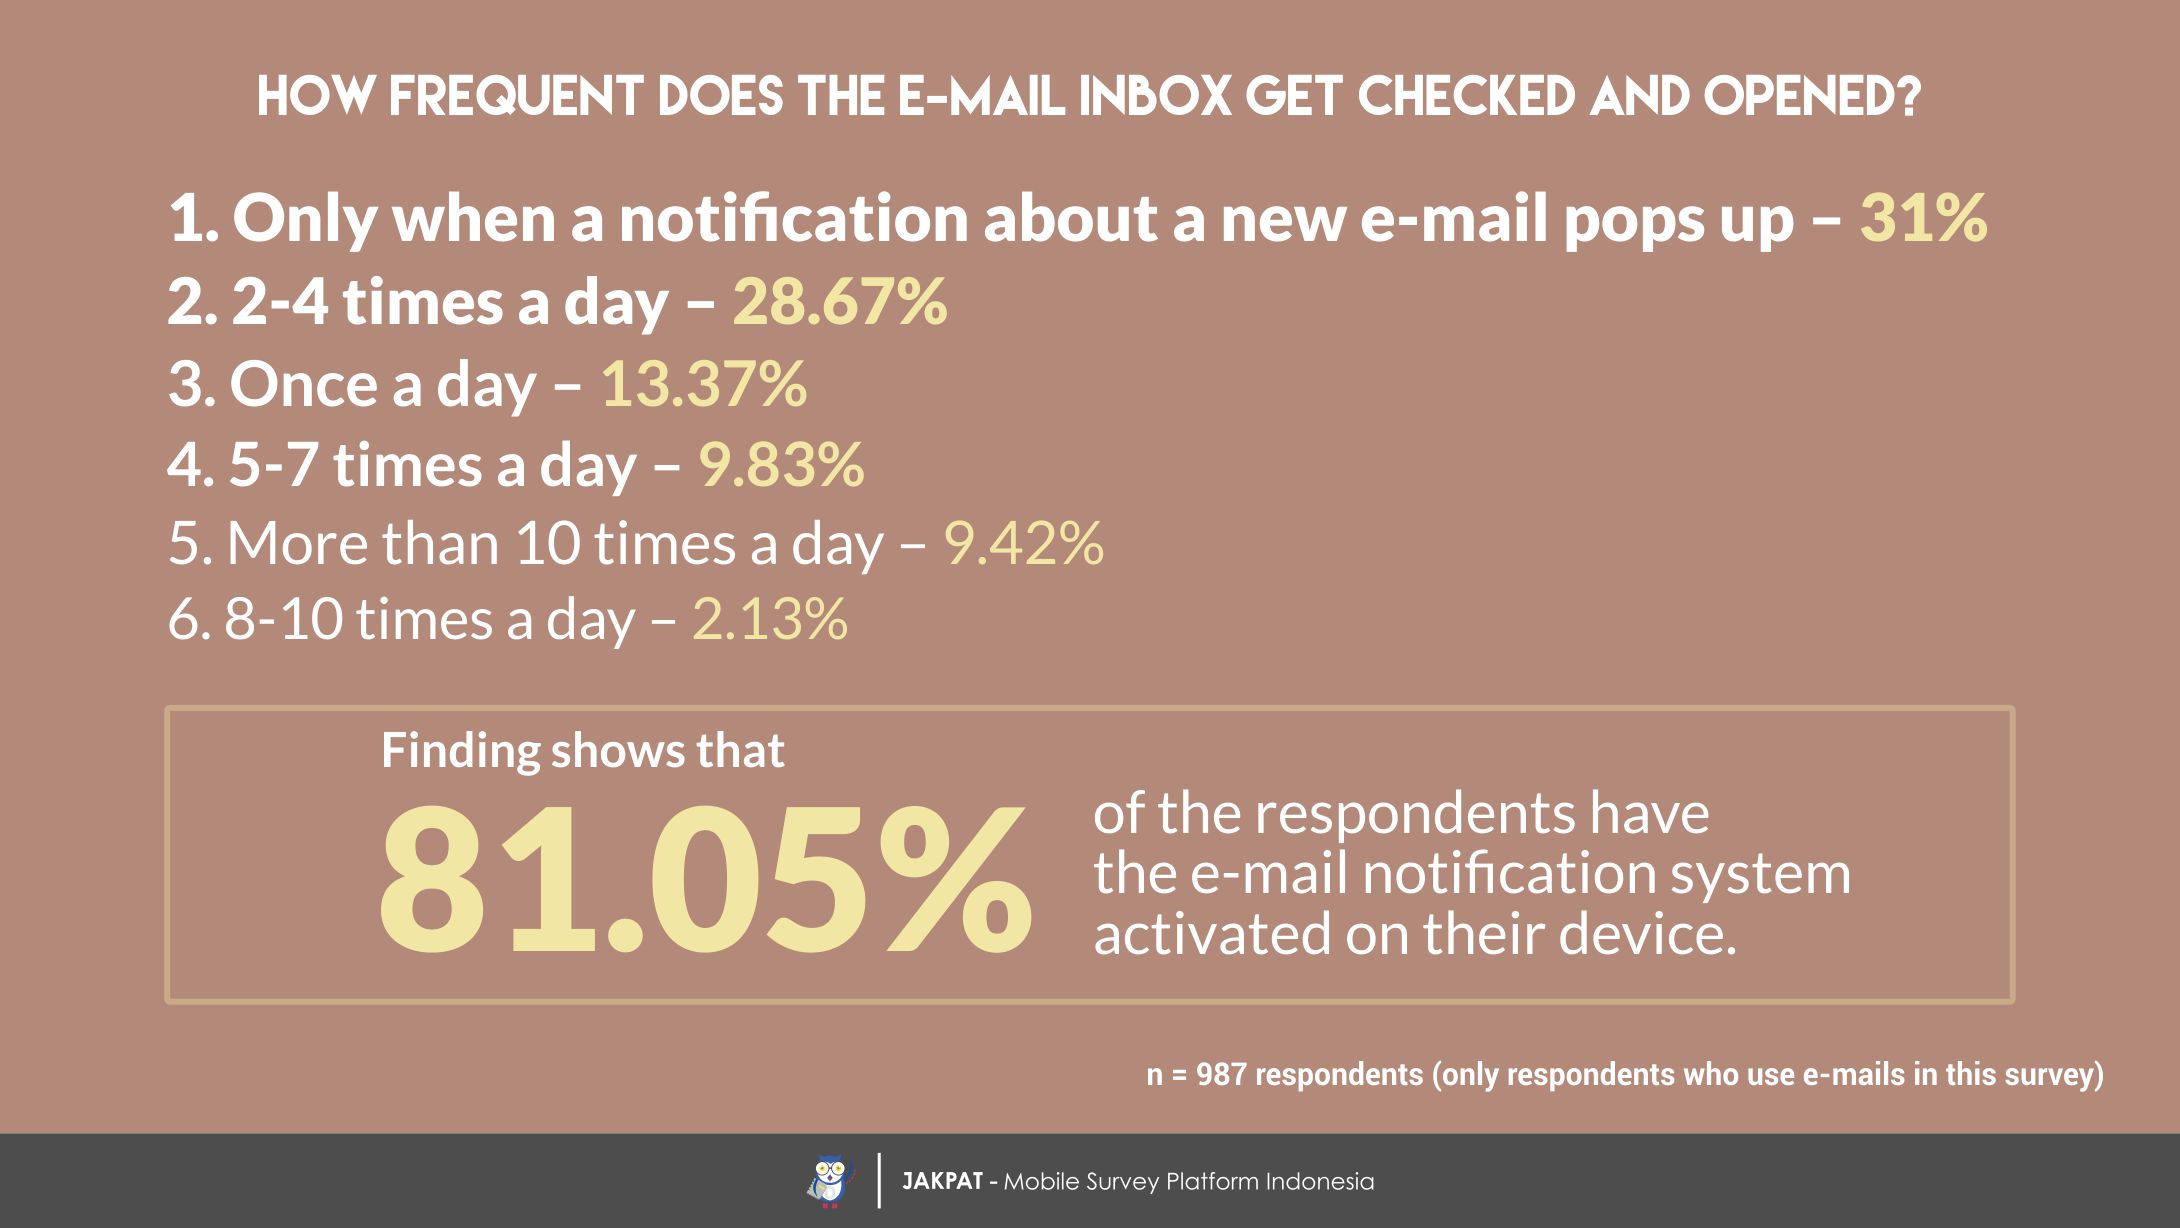
How frequent do our respondents check their e-mail in a day? That’s the question we asked to the respondents to find out when or how many times in a day they check for new e-mails in the inbox. We found that majority of the respondents say they check their inbox only when a notification about a new e-mail pops up, as claimed by 31%. 28.67% claim to check the inbox 2-4 times a day. 13.37% say once a day. 9.83% do it 5-7 times a day. 9.42% do the checking more than 10 times a day. Lastly, 2.13% do it 8-10 times a day. And, 81.05% of the respondents who use e-mail admit that they have the e-mail notification system activated on their device.
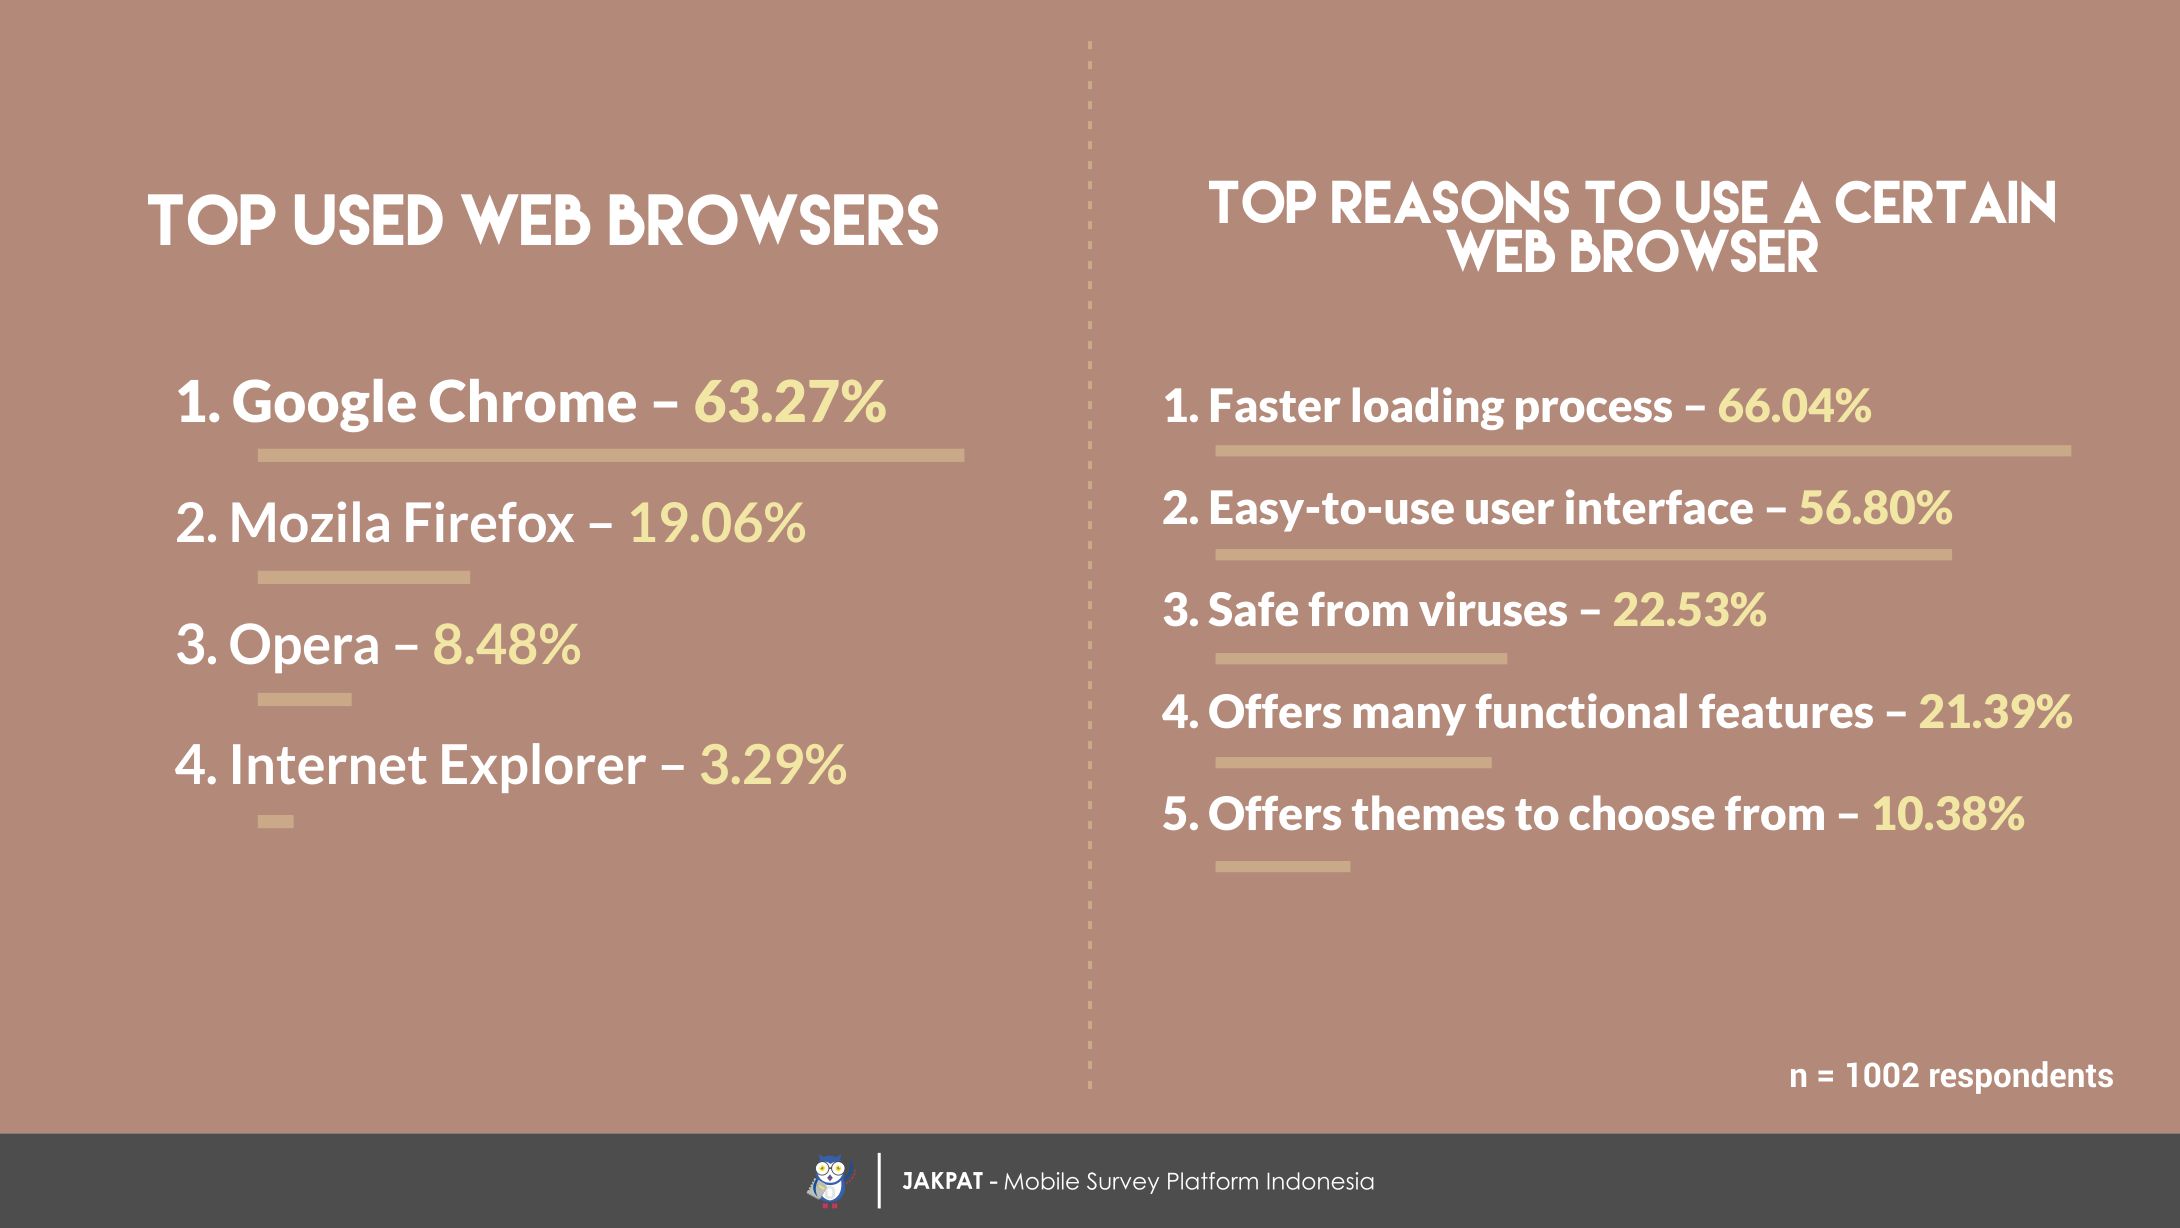
We are ending this article with a finding about web browsers of choice and reasons to using them. We asked our respondents which web browser they use most frequently, and found that Google Chrome, as claimed by 63.27%, sits on the top in the list. Following at number 2 is Mozila Firefox as claimed by 19.06%. Opera sits at number 3, as claimed by 8.48%. Lastly, Internet Explorer sits at number 4 as claimed by 3.29%. It is clearly a far gap between number 1 and number 2, which shows how Google Chrome wins the competition unbeatably.
As for the reasons to why the respondents use a web browser of their choice, we found that 66.04% were looking for a faster loading process when using their web browser of choice. The number 2 reason is an easy-to-use user interface (56.80%). The other reasons include safe from viruses (22.53%), offering many functional features (21.39%), and offering themes to choose from (10.38%).
For more detail you can download XLS report at the button below (Bahasa Indonesia). JAKPAT report consists of 3 parts which are 1) Respondent Profile, 2) Crosstabulation for each question and 3) Raw Data. Respondent profile shows you demographic profiles ( gender,age range, location by province, and monthly spending). Cross tabulation enables you to define different demographic segment preference on each answer.
![]()
You can also download PDF here:
![]()

or Get A Sales Quote by filling this form or Call to +622745015293
