

We live in the world where most of the time we need to take care of the things that we own. Of course we can hire someone to work as a household assistant but for the people who cannot afford such a convenient service when our things get dirty we have our hands to use to clean.
Cleaning is mostly to keep the things looking new again, free of bacteria, free of stains, and safe to use again. Therefore there are cleaning products that are special to clean certain things. So different people may use different brands, but there might be a pattern of common favor. We shall see in the result of our survey about cleaning product consumption habit in Indonesia.

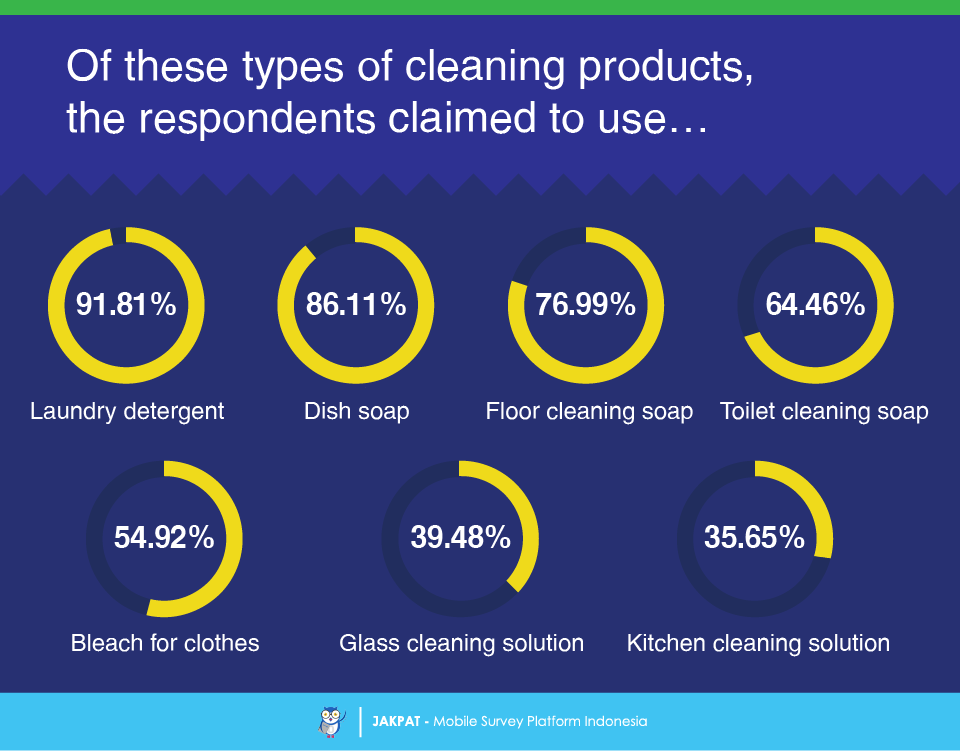
As much as 95,36% of just over 1000 respondents admitted that they care to have their surrounding and belonging kept clean. And of the 95,36% of the respondents, we asked them the type of cleaning product they use. Our finding showed that laundry detergent is the most used type of cleaning product, claimed by 91,81% of the respondents. That shows cleanliness of the clothes seems to be the most urgent type of belonging to clean before anything else.
The second most used cleaning product goes to dish soap (86,11%); while 76,99% claimed to using floor cleaning soap; 64,46% to using toilet cleaning soap; 54,92% to using bleach for clothes; 39,48% to using glass cleaning solution; 35,65% to using kitchen cleaning solution.
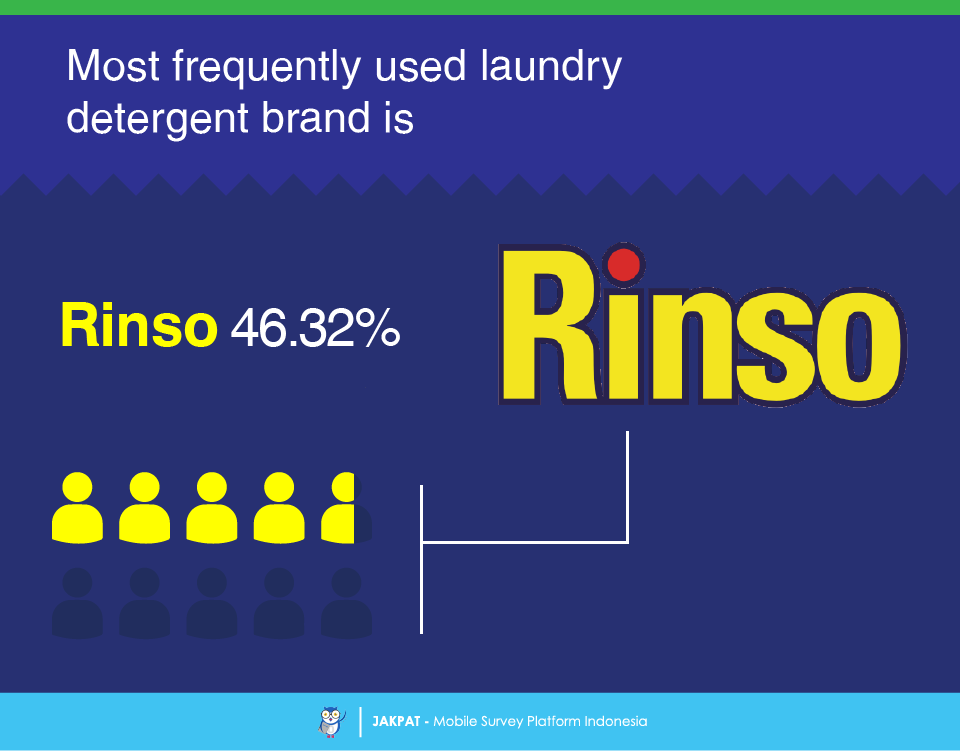
Let us talk about the products one type at a time. Rinso was chosen by 46,32% of the respondents to become the most frequently used brand for washing the clothes.
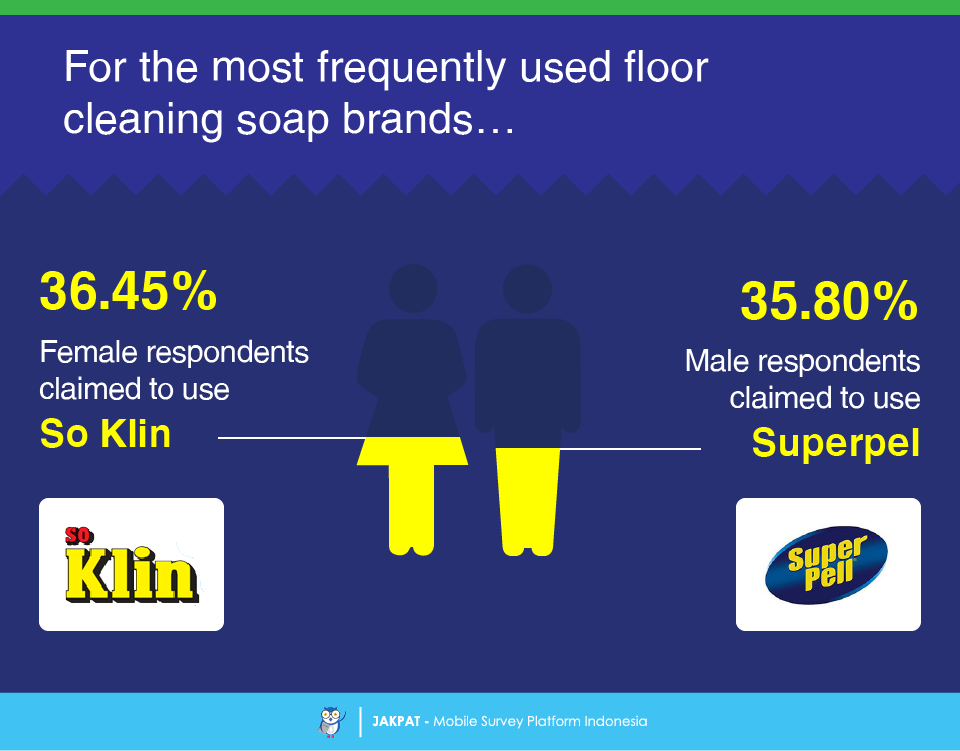
As for the floor cleaning soap, we found an interesting finding. Apparently the female respondents most frequently use So Klin (36,45%) for cleaning the floor, while the male respondents most frequently use Superpel (35,80%). We are not sure why such preference could be affected by the gender difference. We may do specific research in the future to answer that.
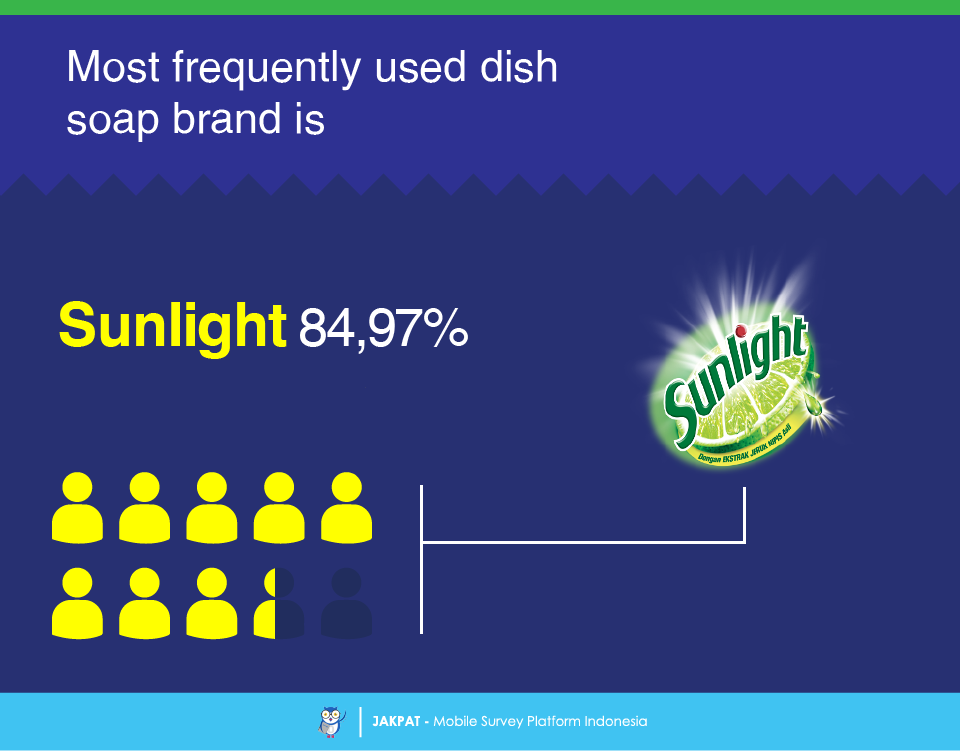
We are moving on to the most frequently used dish soap brand, and it goes to Sunlight (claimed by 84,97% of the respondents).
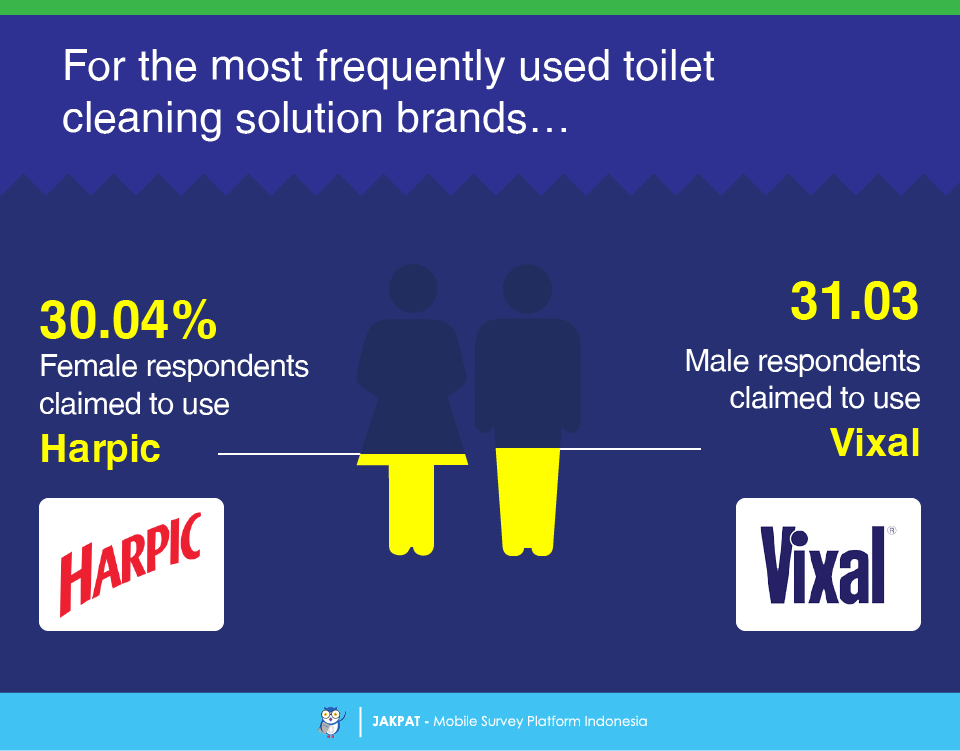
Yet, another brand preference seemed to be affected by the gender difference. We found two different brands specialized for cleaning the toilet. The female respondents claimed to using Harpic (30,04%). While the male respondents use Vixal (31,03%). Again, we may do specific research in the future for the answer to why such gender-affected preference.
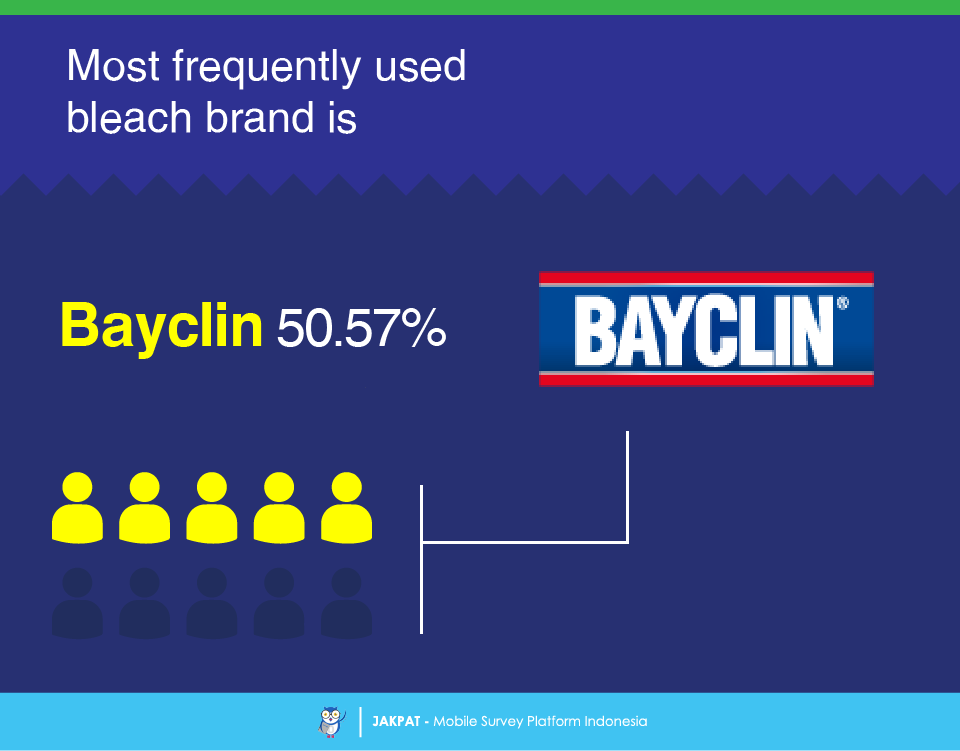
Of all the brands of bleach products, 50,57% of the respondents admitted to mostly using Bayclin.
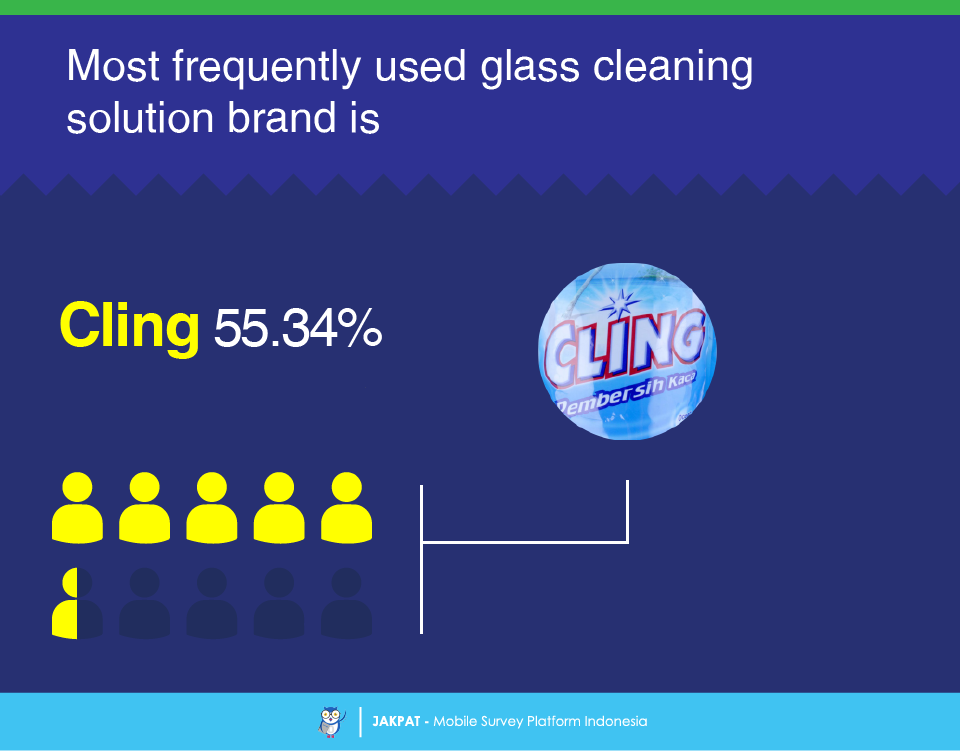
As for the most frequently used solution brand for cleaning glass most respondents (55,34%) claimed to using Cling.
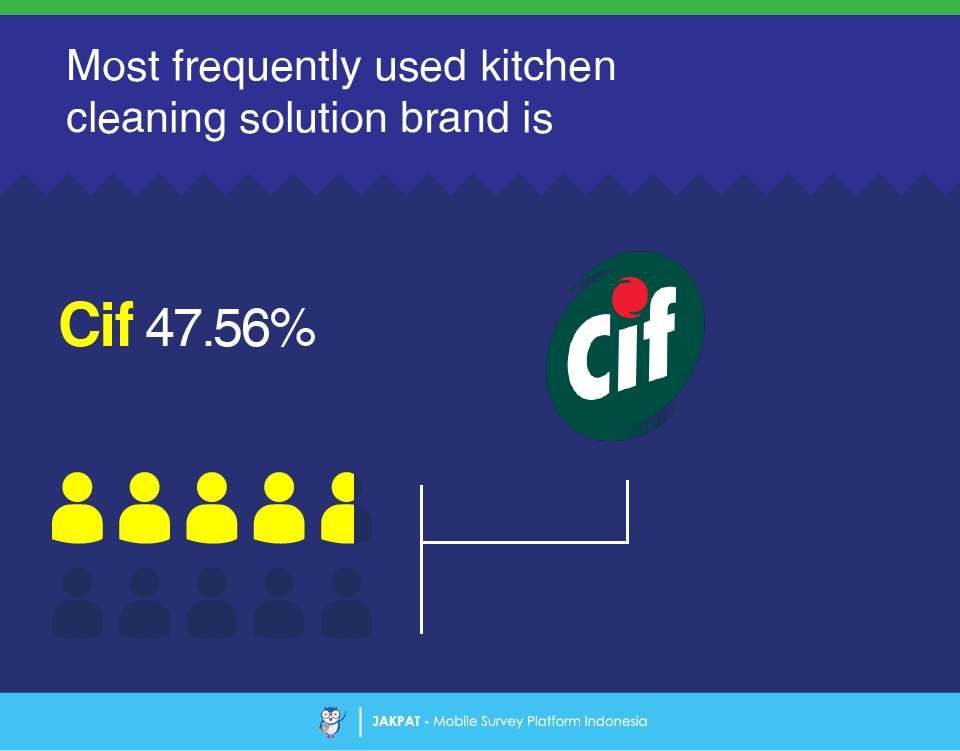
And, lastly, the most frequently used kitchen cleaning solution brand goes to Cif, as claimed by 47,56% of the respondents.
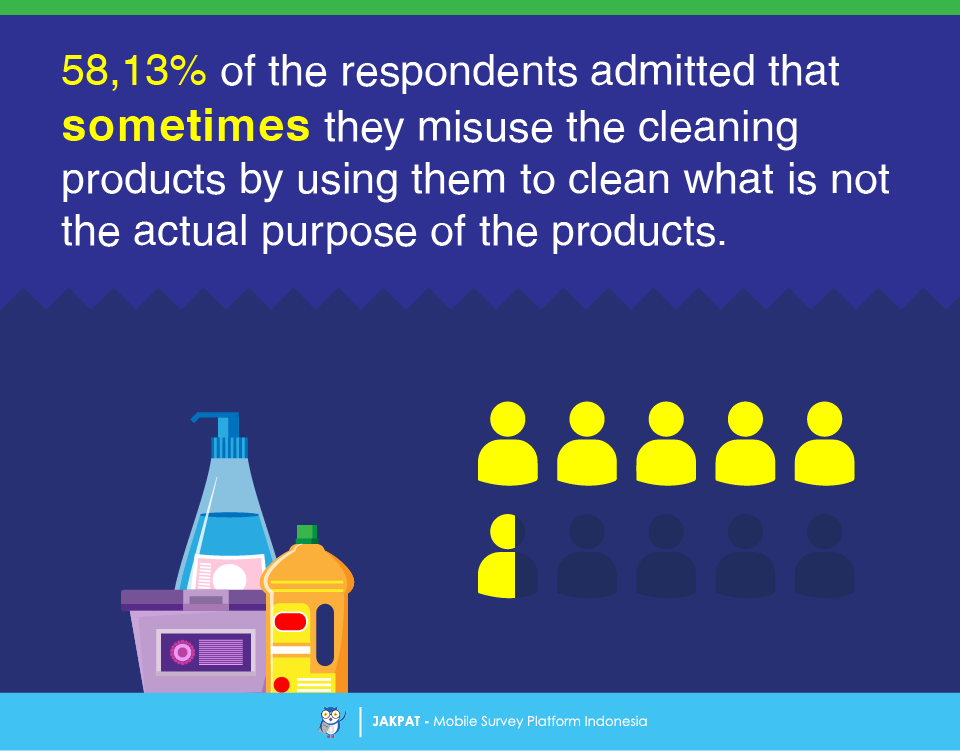
Here is a question. Do sometimes people misuse a cleaning product to clean what is not the actual purpose of the cleaner as clearly informed on the package? Before we get to the answer we asked if the respondents actually always read the information on the package. As much as 63,94% of the respondents said ‘yes’. However, for some reason, the majority of the respondents (58,13%) admitted that sometimes they misuse the product for cleaning something the product is not supposed to clean. That is an irony.
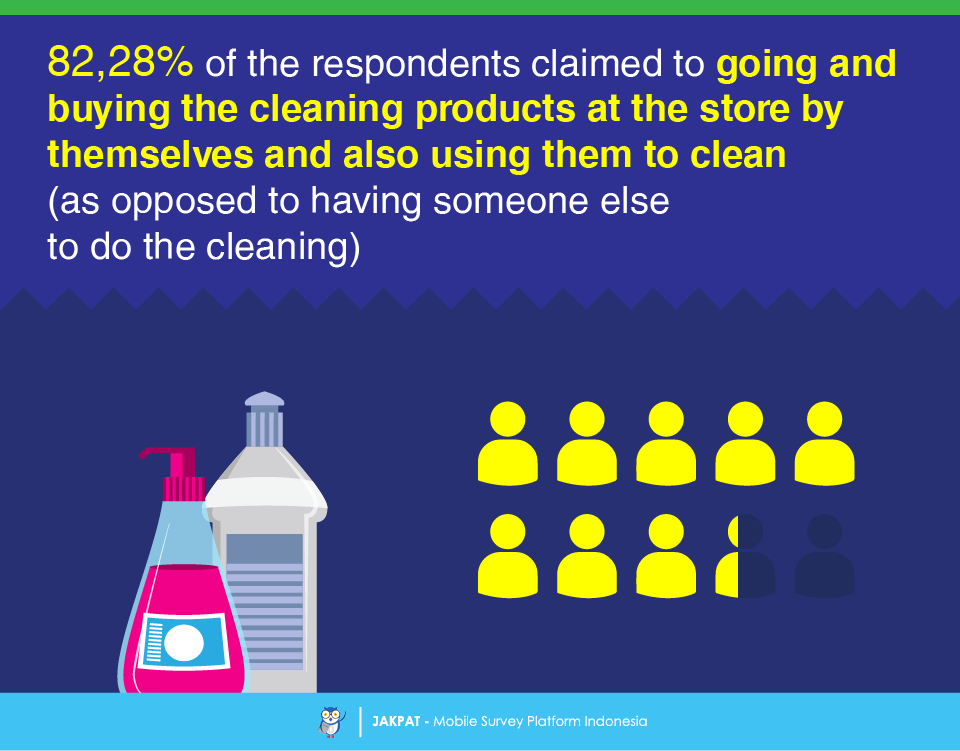
We were curious to know whether people actually go to the store and buy the products themselves and also use the products. To that we found that, yes, majority of the respondents (82,28%) claimed so. Our curiosity was actually sparked by the thought “perhaps the person who buys the products is not the one who uses them”. That could affect the customers’ brand knowledge and preference.
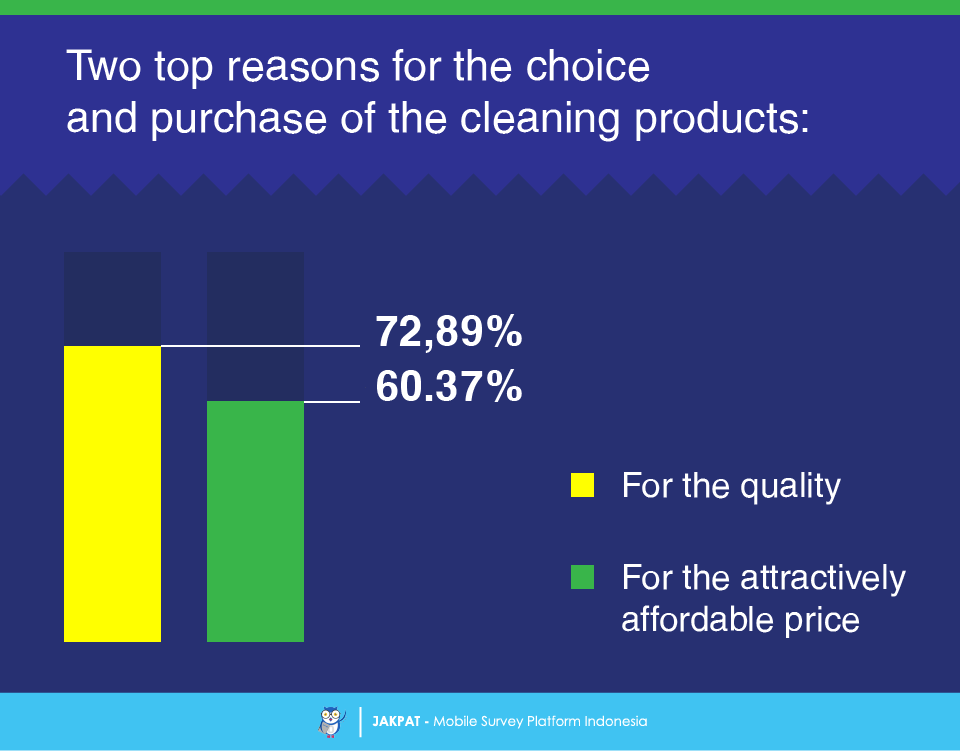
Then our question was narrowed down to why they choose and purchase the products. The two top reasons are (1) for the quality (claimed by 72,89%) and (2) for the attractively affordable price (60,37%).
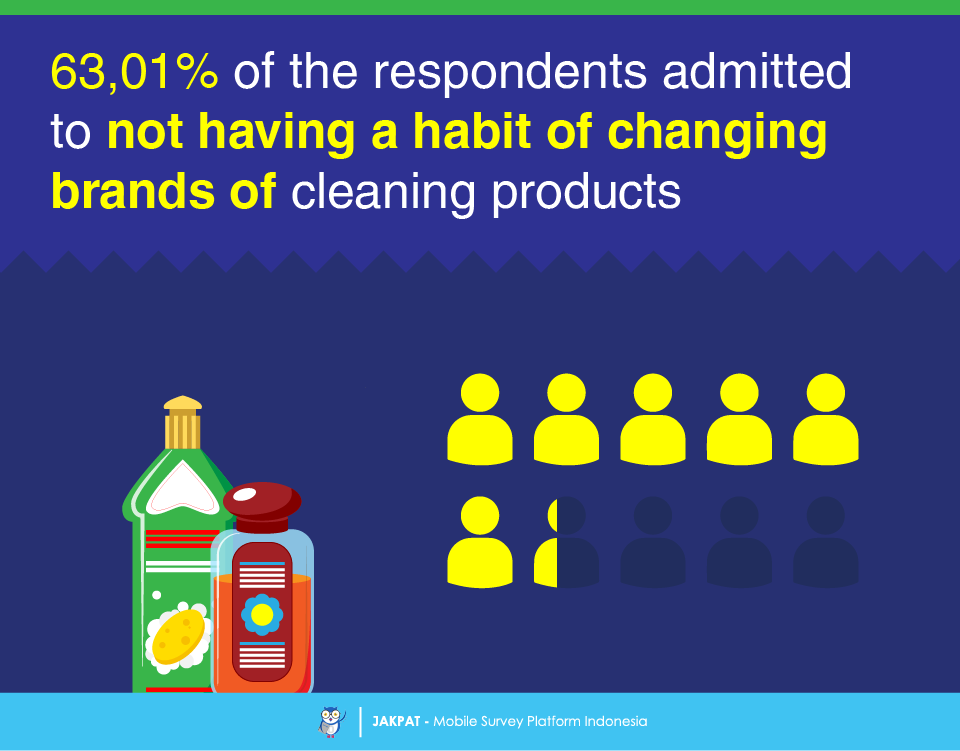
Related to that, we wanted to know whether or not the respondents have a habit of changing brands in the midst of using the products. Most respondents (63,01%) said ‘no’ to changing brands. They seem to be loyal customers.
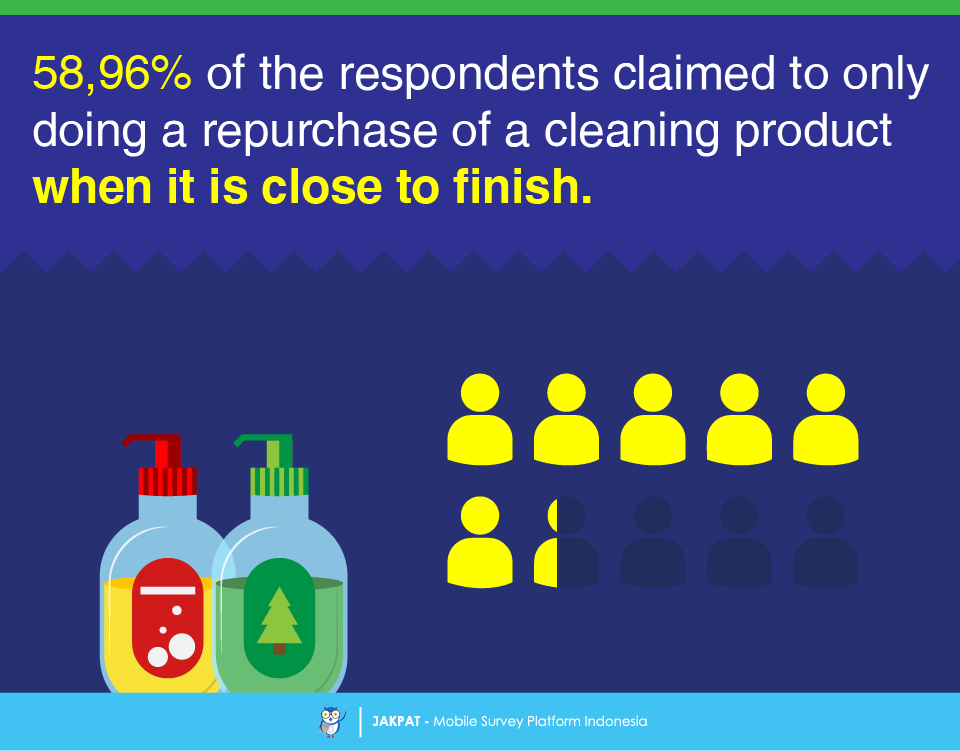
Lastly, we asked a question about when the respondents do a repurchase. As much as 58.96% of them admitted that a repurchase is done when the product is close to finish.
For more detail you can download XLS report at the button below (bahasa). JAKPAT report consists of 3 parts which are 1) Respondent Profile, 2) Crosstabulation for each question and 3) Raw Data. Respondent profile shows you demographic profiles ( gender,age range, location by province, and monthly spending). Cross tabulation enables you to define different demographic segment preference on each answer.
![]()
You can also download PDF here:
![]()

or Get A Sales Quote by filling this form or Call to +622745015293
