

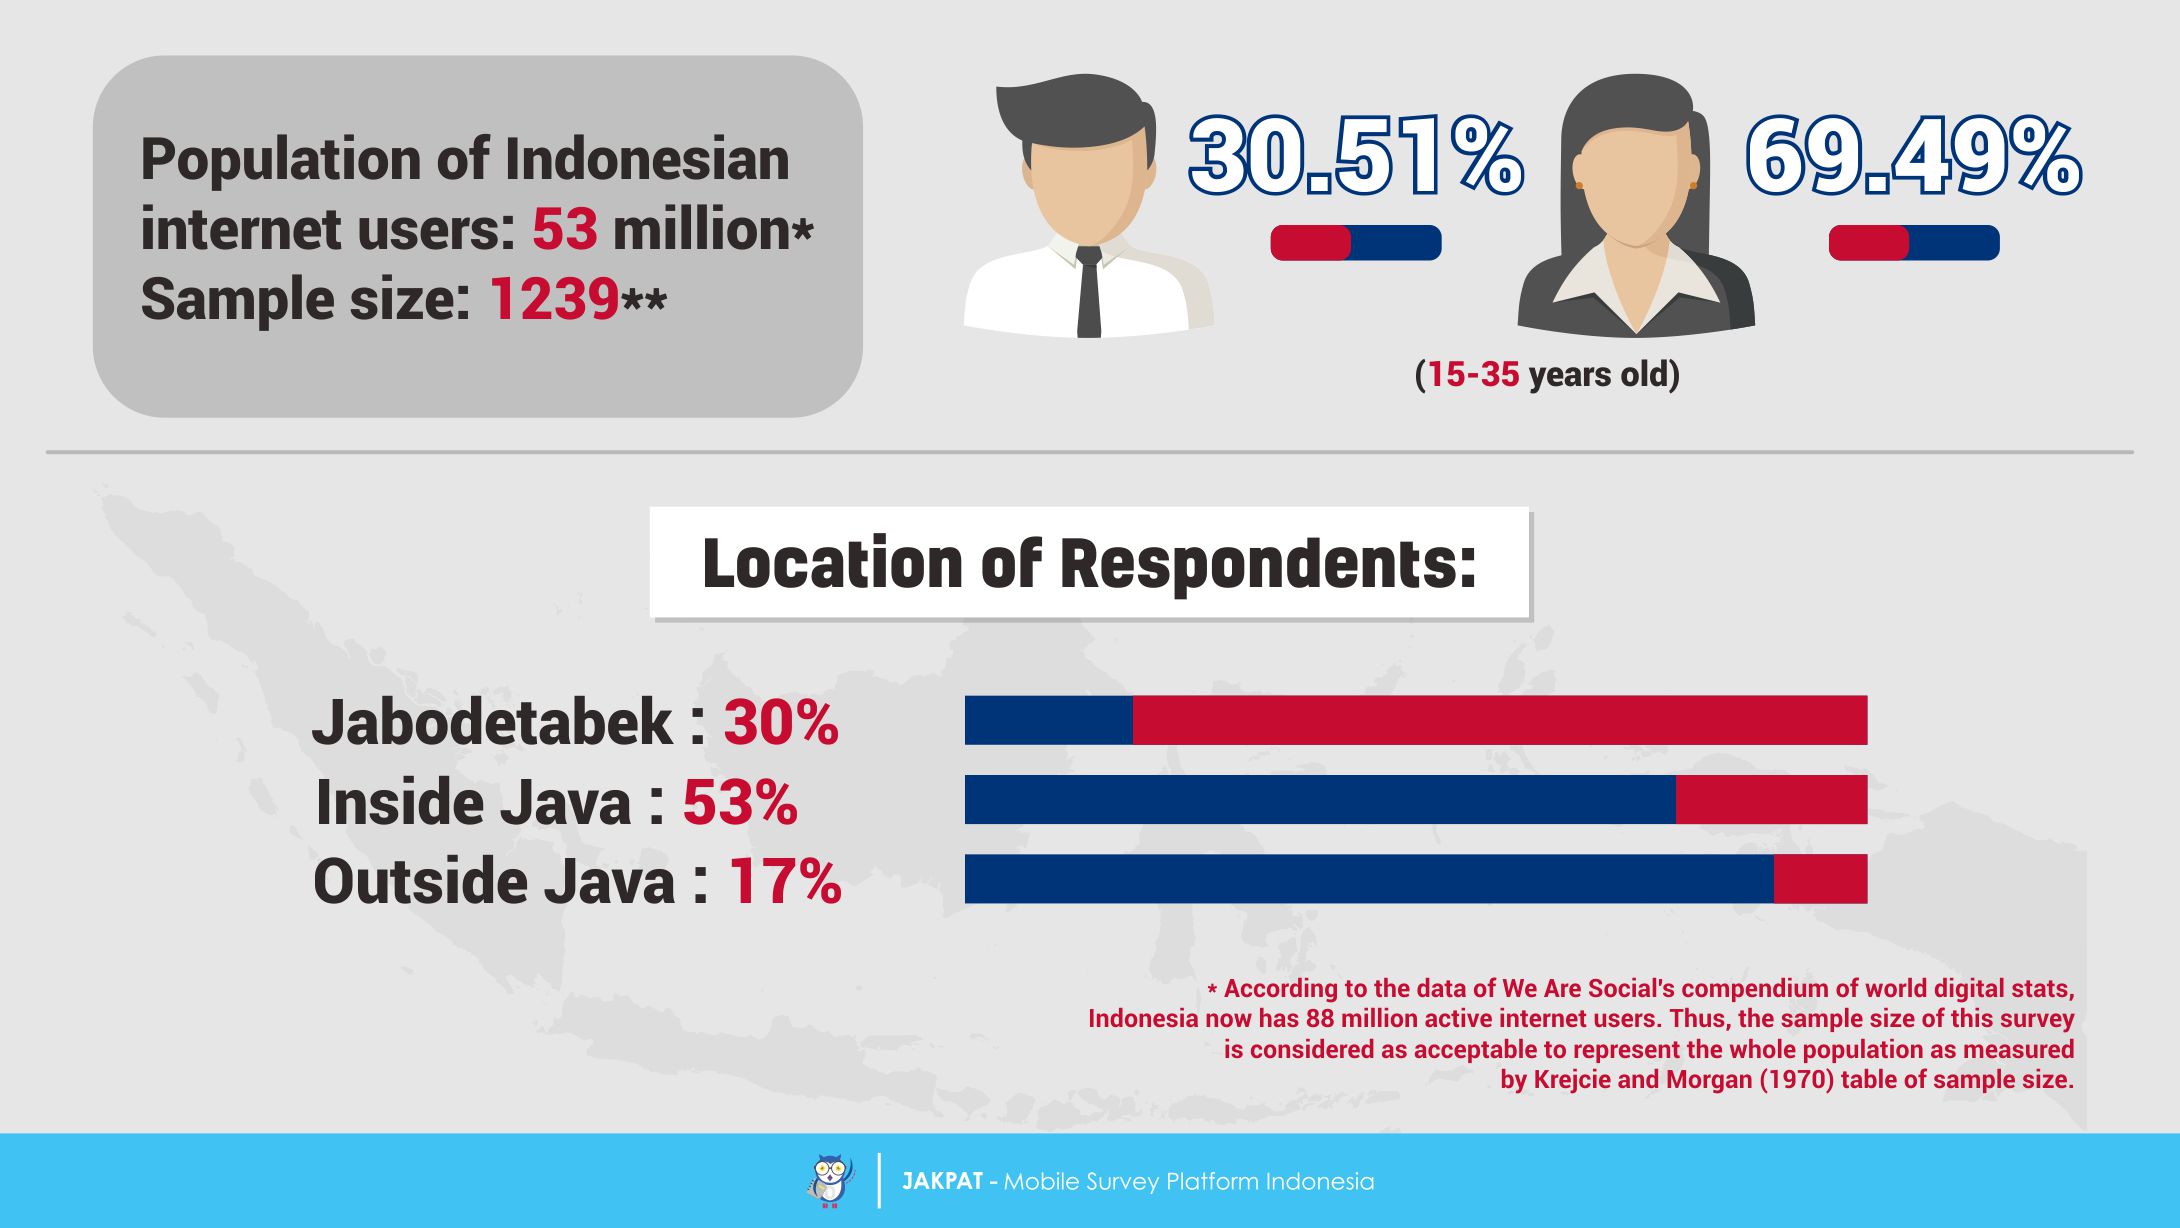
The era of Korean drama is rising again in Indonesia. After the famous era of Winter Sonata and Full House in the early 2000s, these past years the entertainment industry has been dominated once again by the television series from South Korea or widely known as Kdrama (an abbreviation for Korean drama). The continuous glory of Kdrama is inseparable from its loyal viewers, famously known as Kdrama addicts. Therefore, regarding to this matter, recently Jakpat has conducted a survey in order to see some habit and preferences of Kdrama addicts in Indonesia. This survey involved 1239 respondents from across Indonesia who has proclaimed themselves as a Kdrama addict through the preliminary questions in this survey. For the further notes, Jakpat’s respondents in this survey are Indonesian smart-phone users, with a range of age from 15 to 35 year-old.
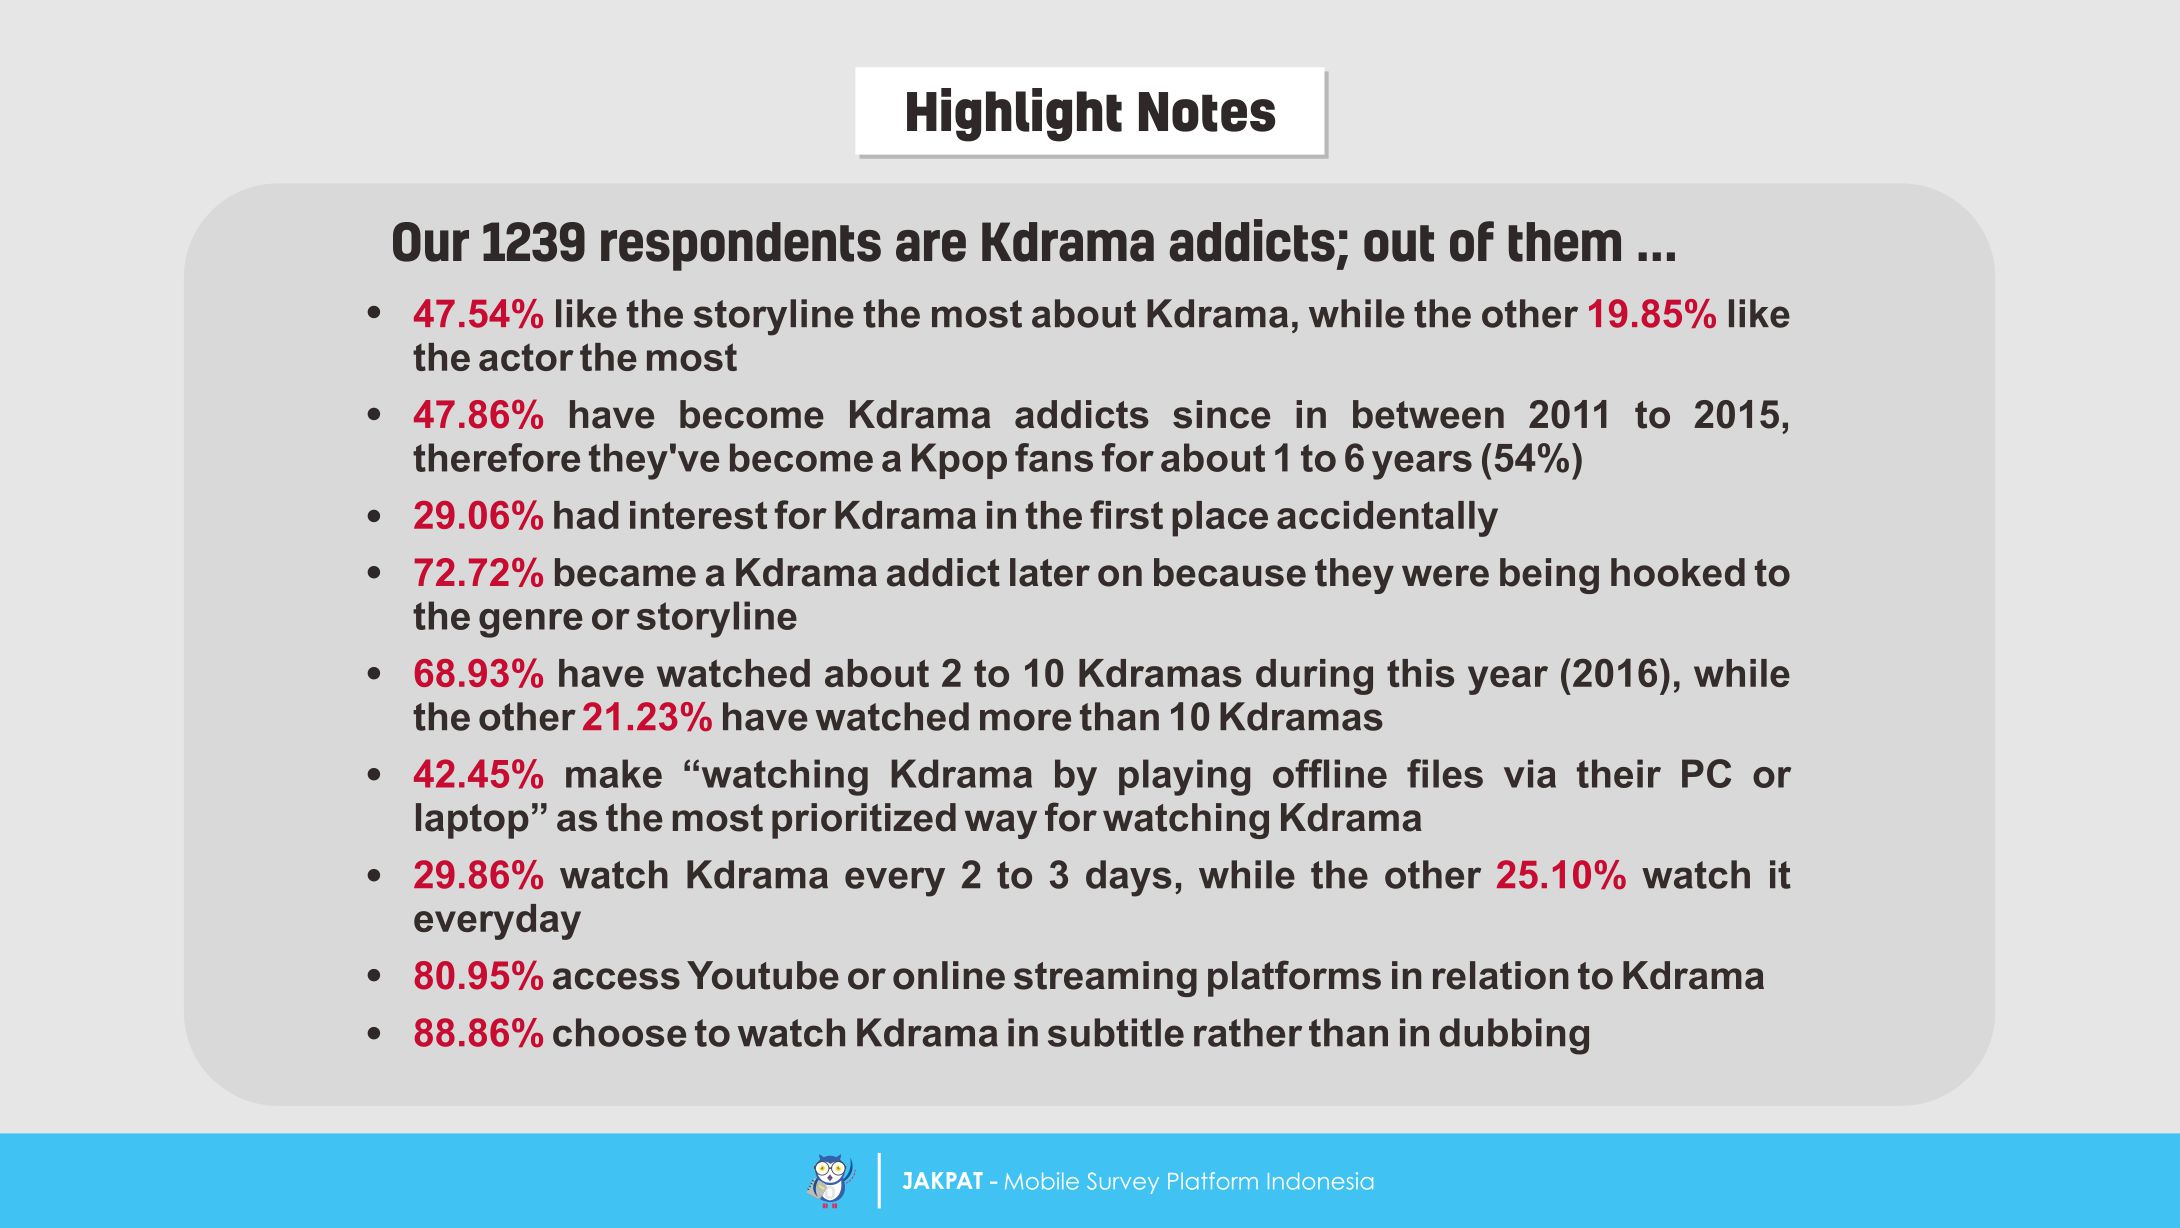
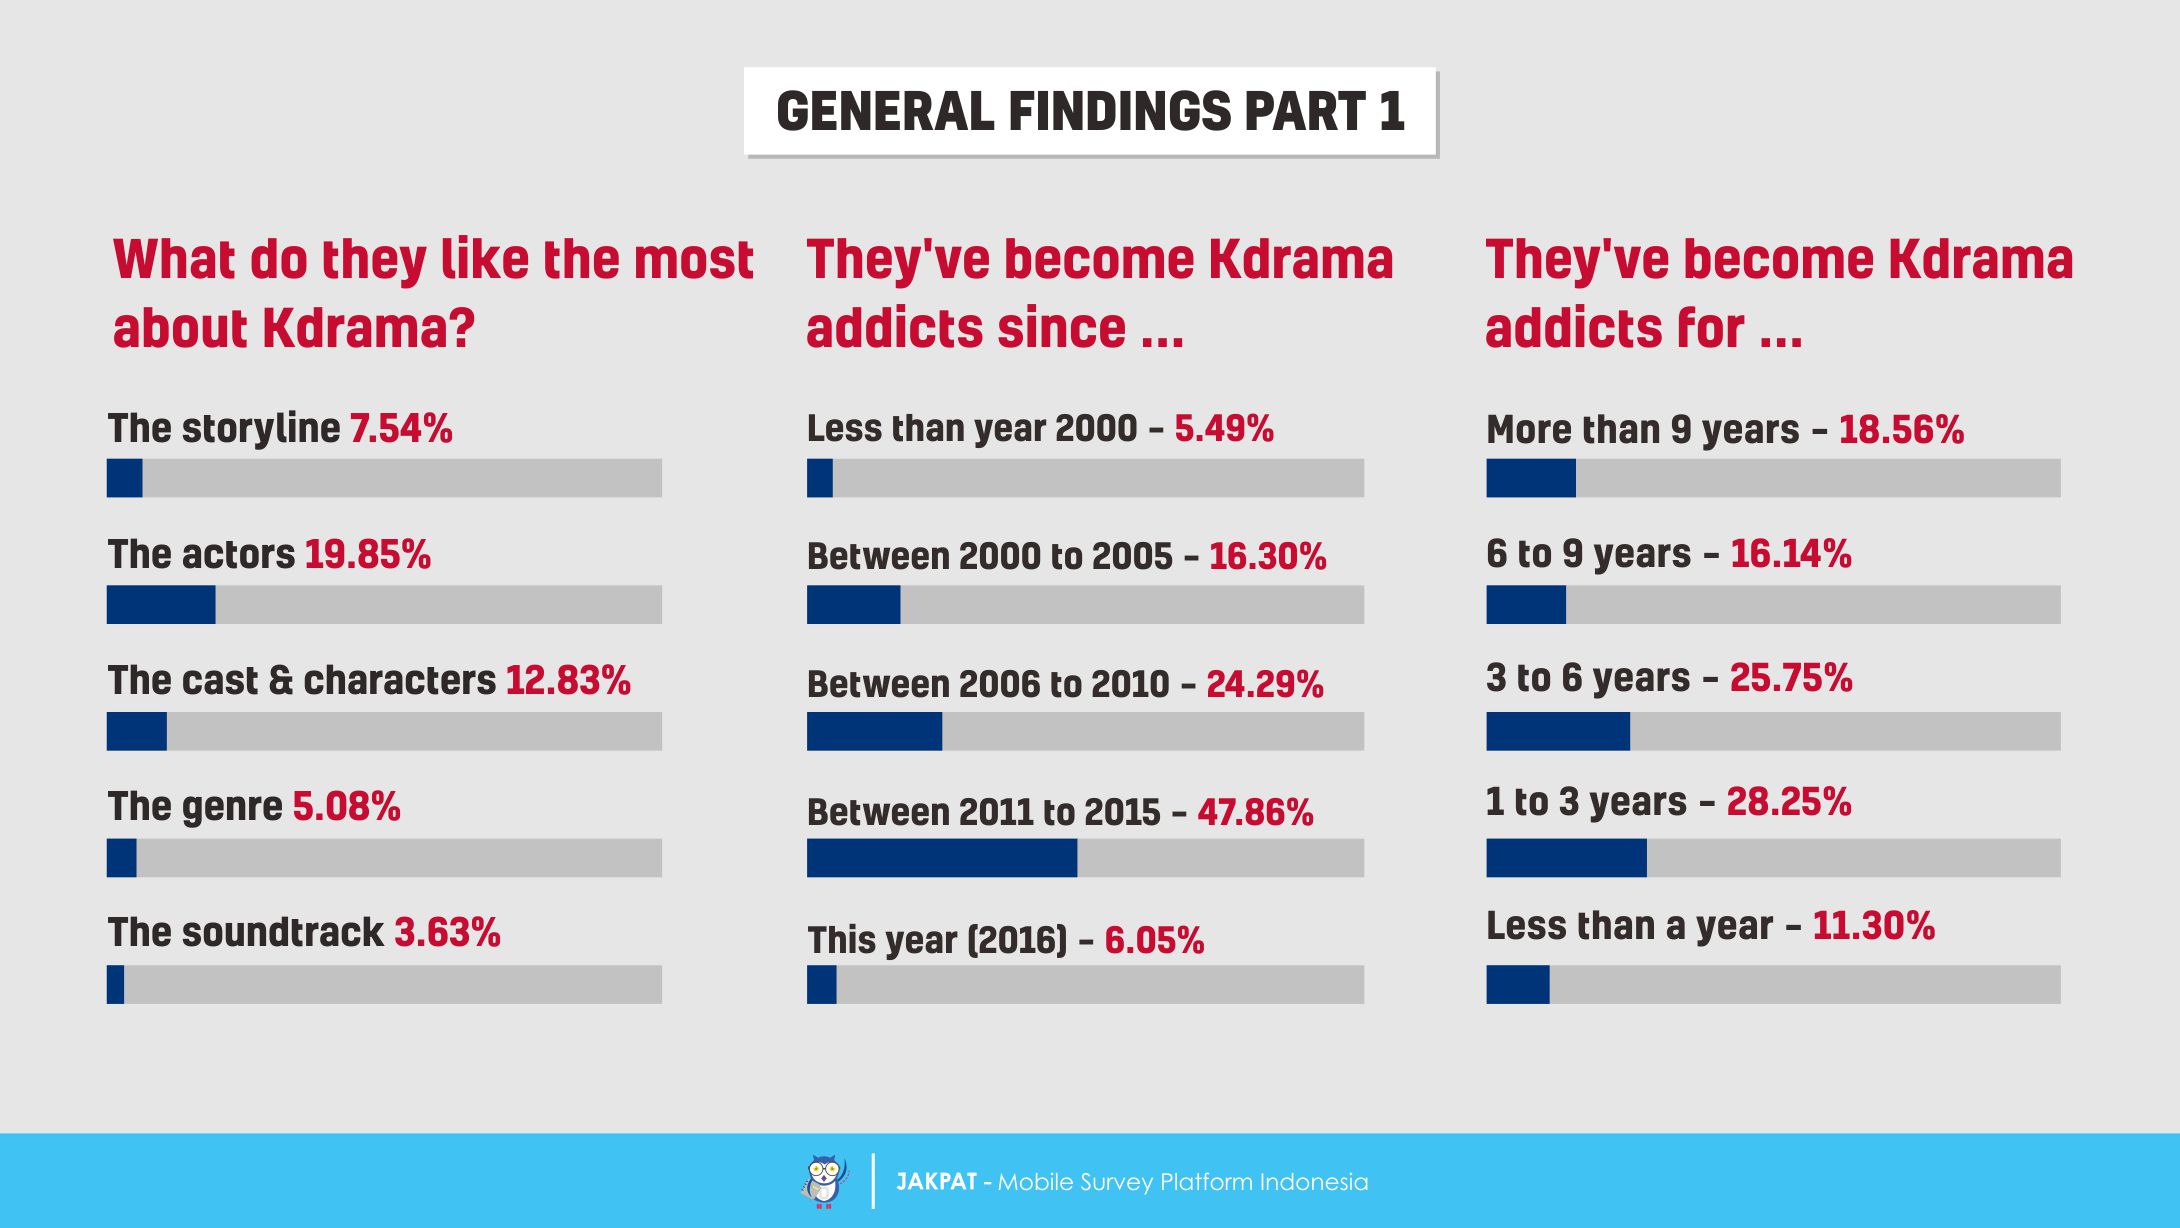
This survey report is divided into seven chapters. The first chapter contains of the general finding from this survey, and this chapter is divided into two parts. First of all, we can find in the first part the element of Kdrama that people like the most. Apparently, “the storyline” is chosen as the thing our respondents like the most about Kdrama (47.54%), while “the actors” is the second most (19.85%) and “the cast and characters” is the third (12.83%). Moreover, other top five things on the list are “the genre” (5.08%) and “the soundtrack” (3.63%). Most of our respondents (47.86%) have become Kdrama addicts since in between 2011 to 2015, which means that most of them (54.00%) have become Kdrama addicts for about 1 to 6 years already.
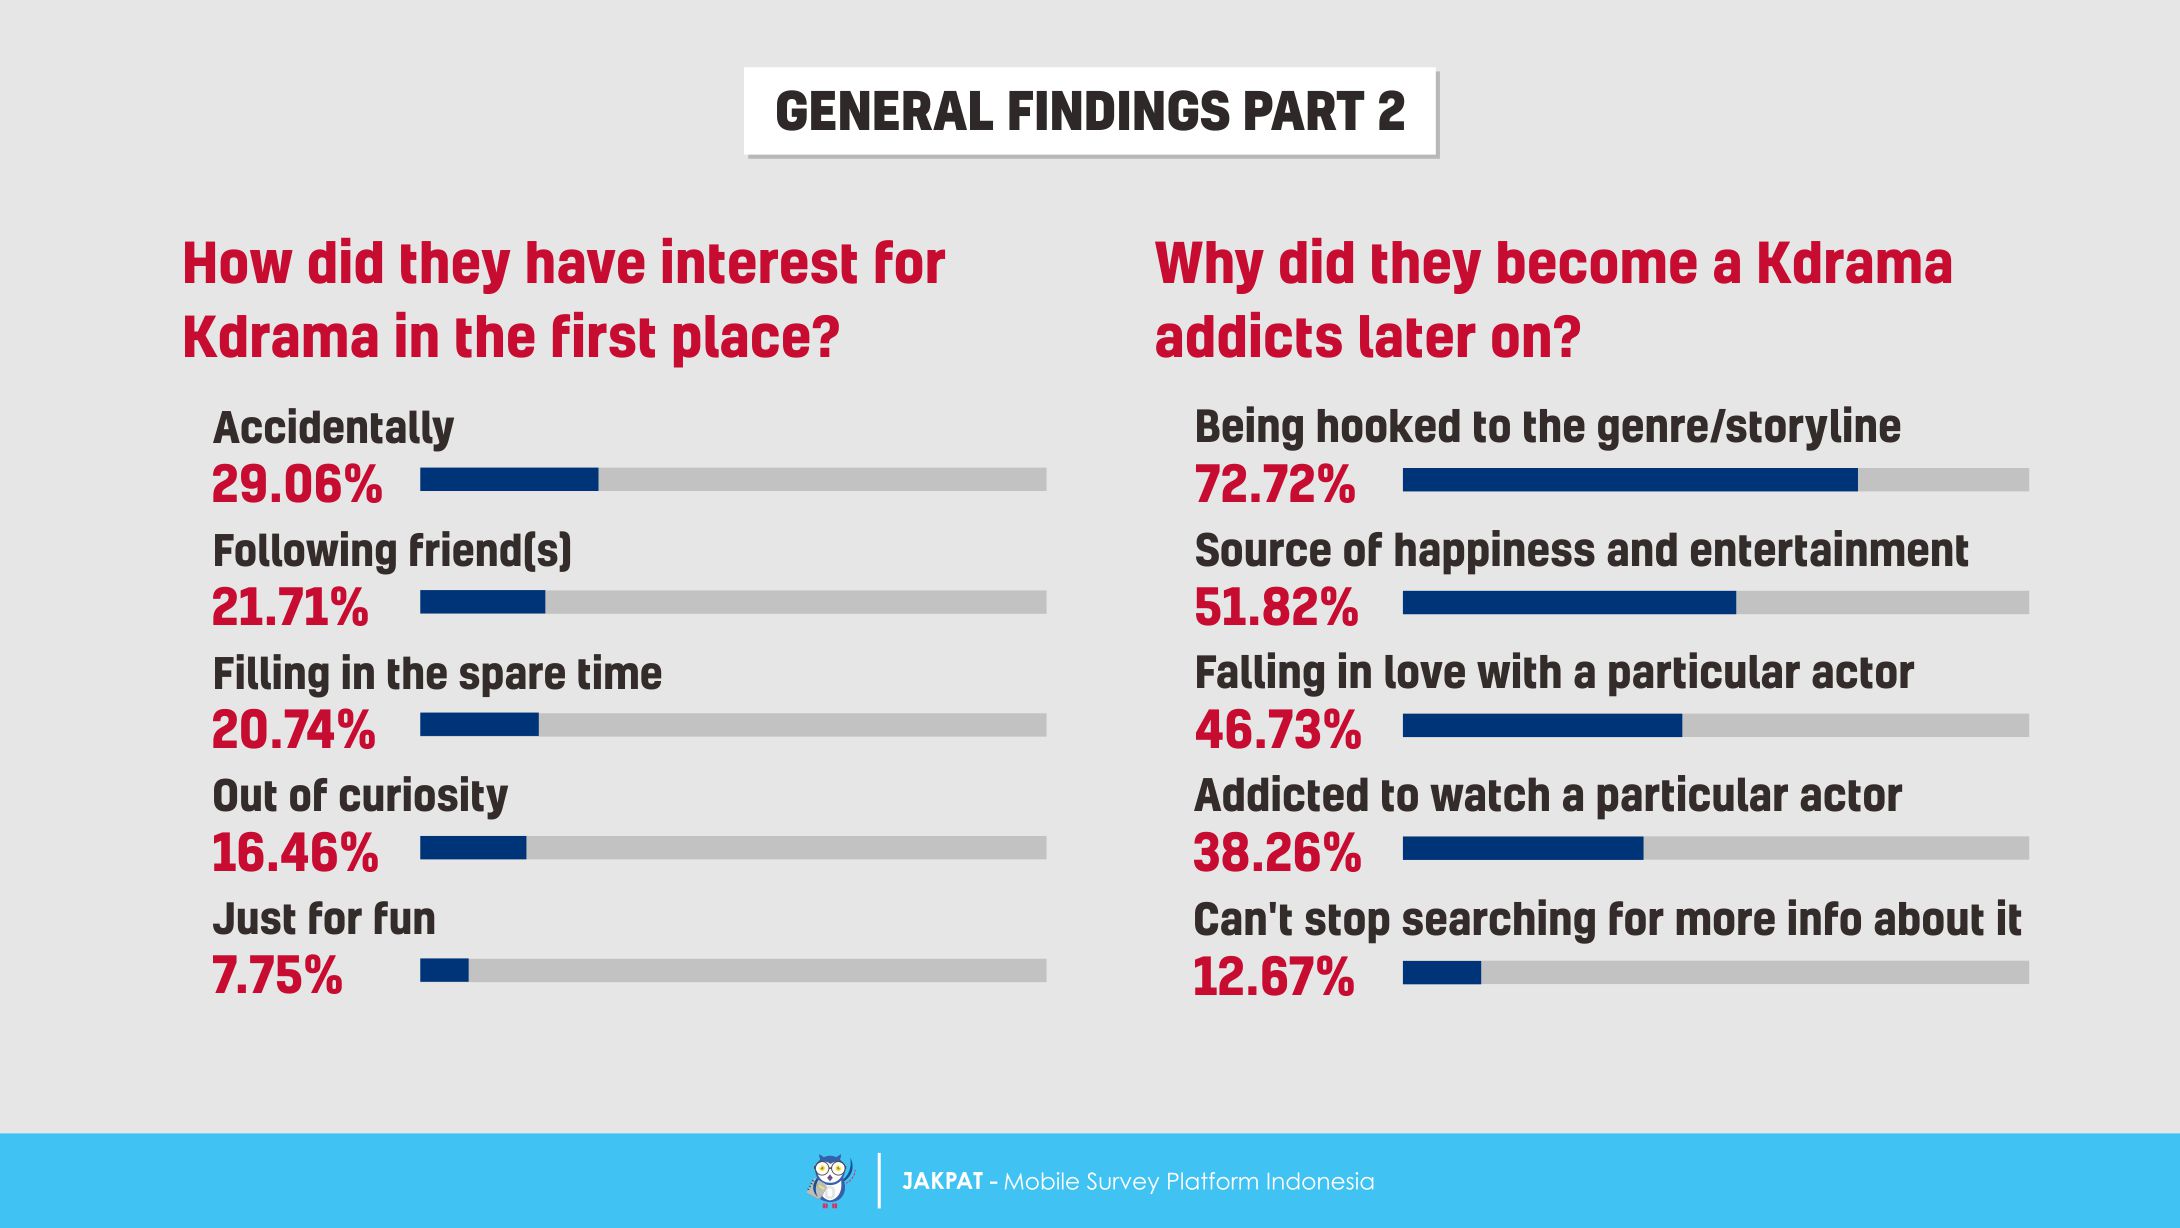
Next, in the second part of the general findings from this survey, we can find the motivation and purpose of why people become Kdrama addicts. Regarding to how they had interest for Kdrama in the first place, apparently the opinions are splitted into three most dominant answers, which are including: (1) just accidentally had interest for Kdrama in the beginning (29.06%); (2) following some friends (21.71%); and (3) filling in the spare time (20.74%). Moreover, there are also some respondents who got interested in Kdrama in the beginning just out of curiosity (16.46%), and a few of them had interest for Kdrama just for fun (7.75%). Hence, they became Kdrama addicts later on because they were being hooked to the genre or storyline (72.72%), and moreover, Kdrama has become their source of happiness and entertainment (51.82%). Furthermore, they have been falling in love with a particular actor (46.73%) or being addicted to watch that particular actor (38.26%). Besides, a few of our respondents admit that they became Kdrama addicts because they can’t stop searching for more information about it (12.67%).
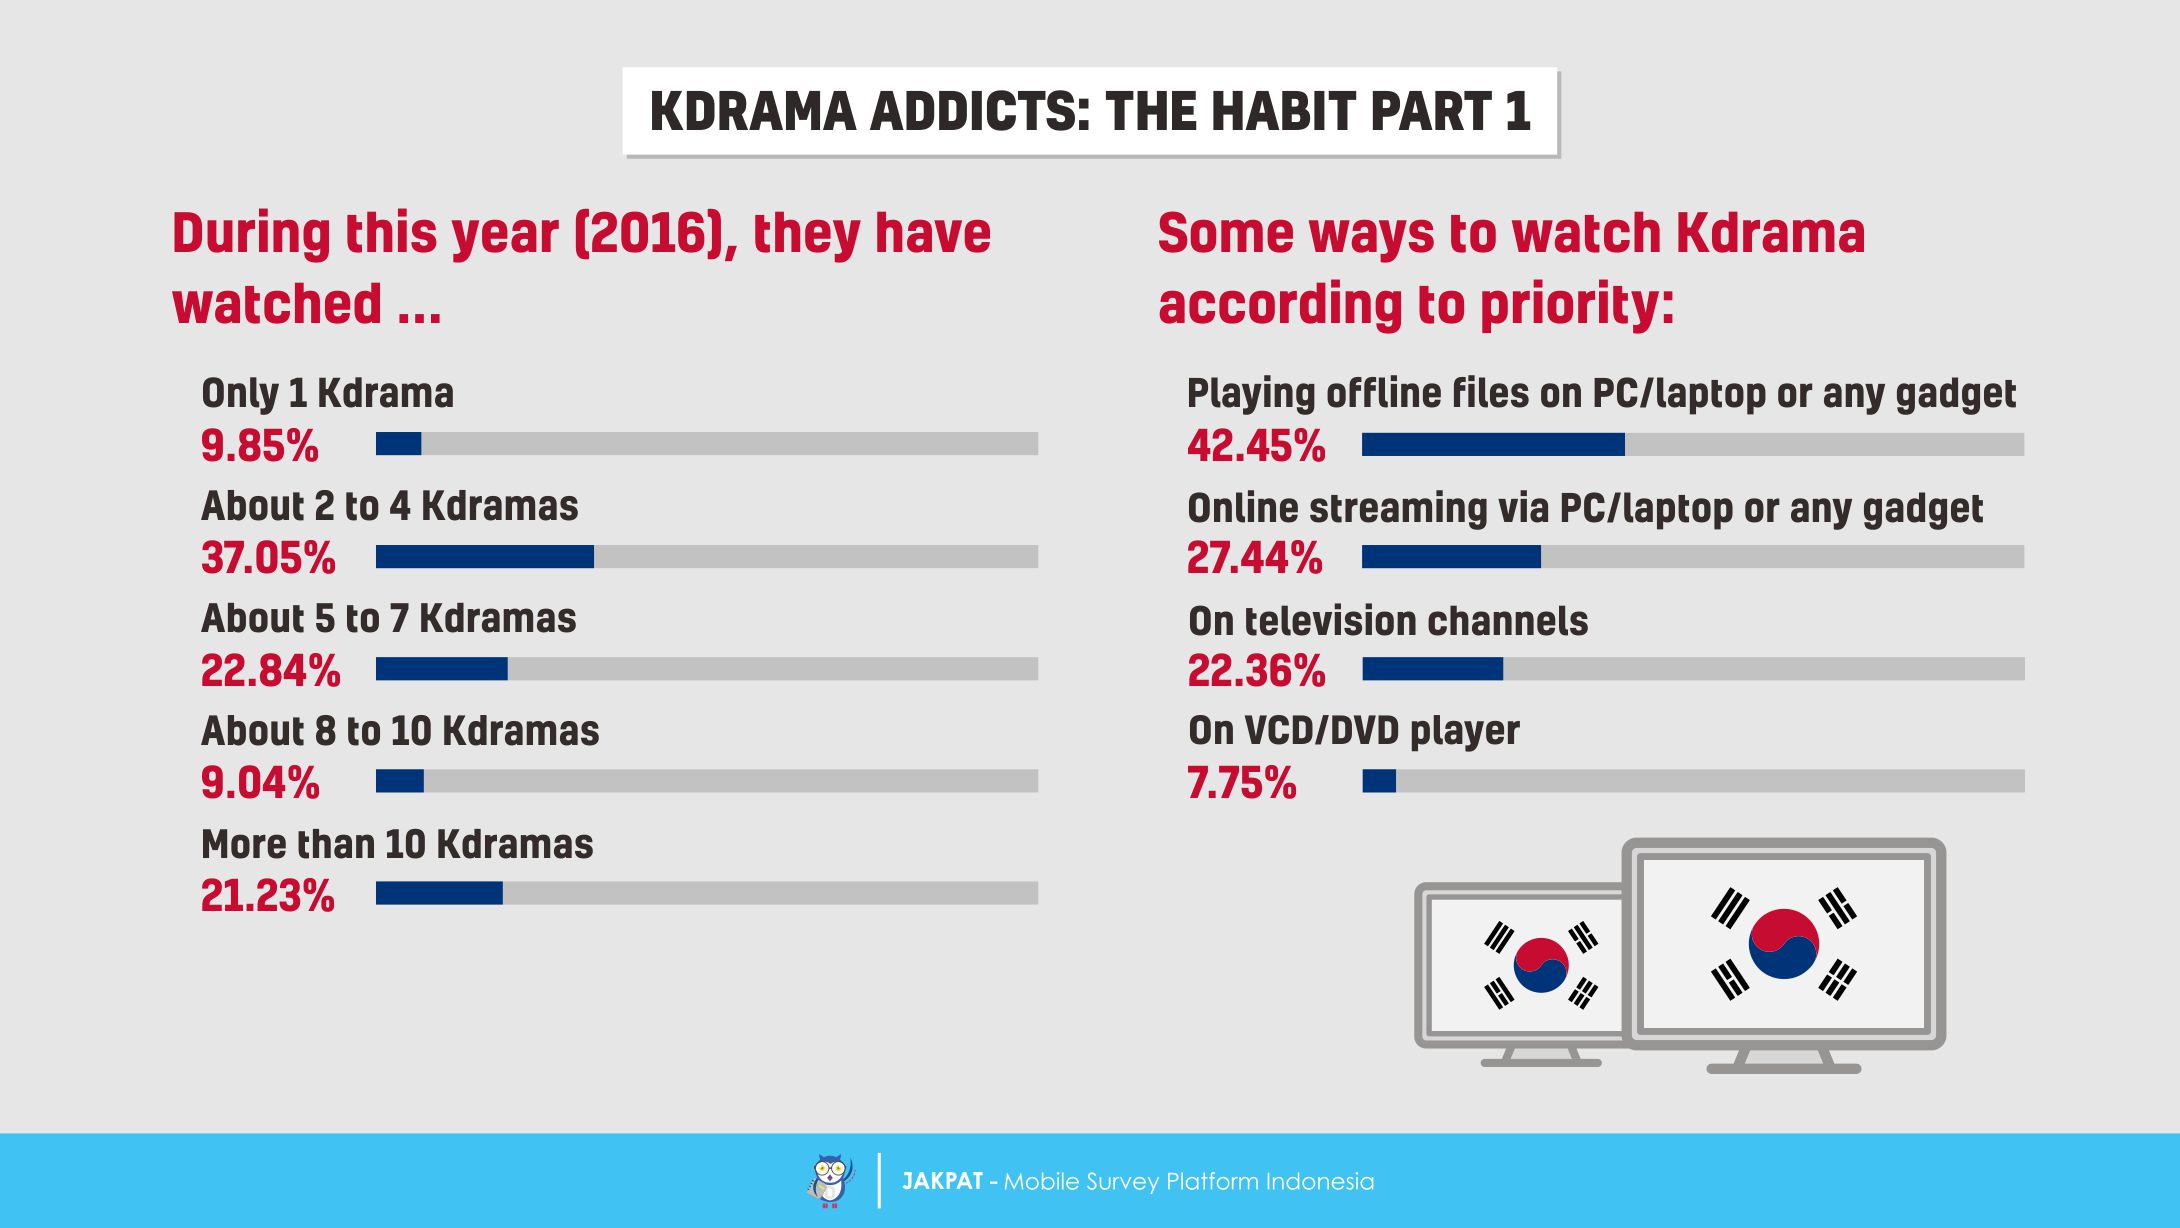
The second chapter of this survey report contains findings about some habit that Kdrama addicts have, and this chapter is also divided into two parts. In the first part, we can find that many of our respondents have watched about 2 to 4 Korean dramas (37.05%) or about 5 to 7 Korean dramas (22.84%) during this year. In addition to that, there are also some of them who have watched more than 10 Korean dramas during this year (21.23%). Regarding to how people watch Kdrama, there are four options which are ranked by their priority: (1) playing offline files or downloaded files on PC or laptop or any gadget (42.45%); (2) online streaming via PC or laptop or any gadget (27.44%); (3) on television channels (22.36%); and (4) on VCD or DVD player (7.75%).
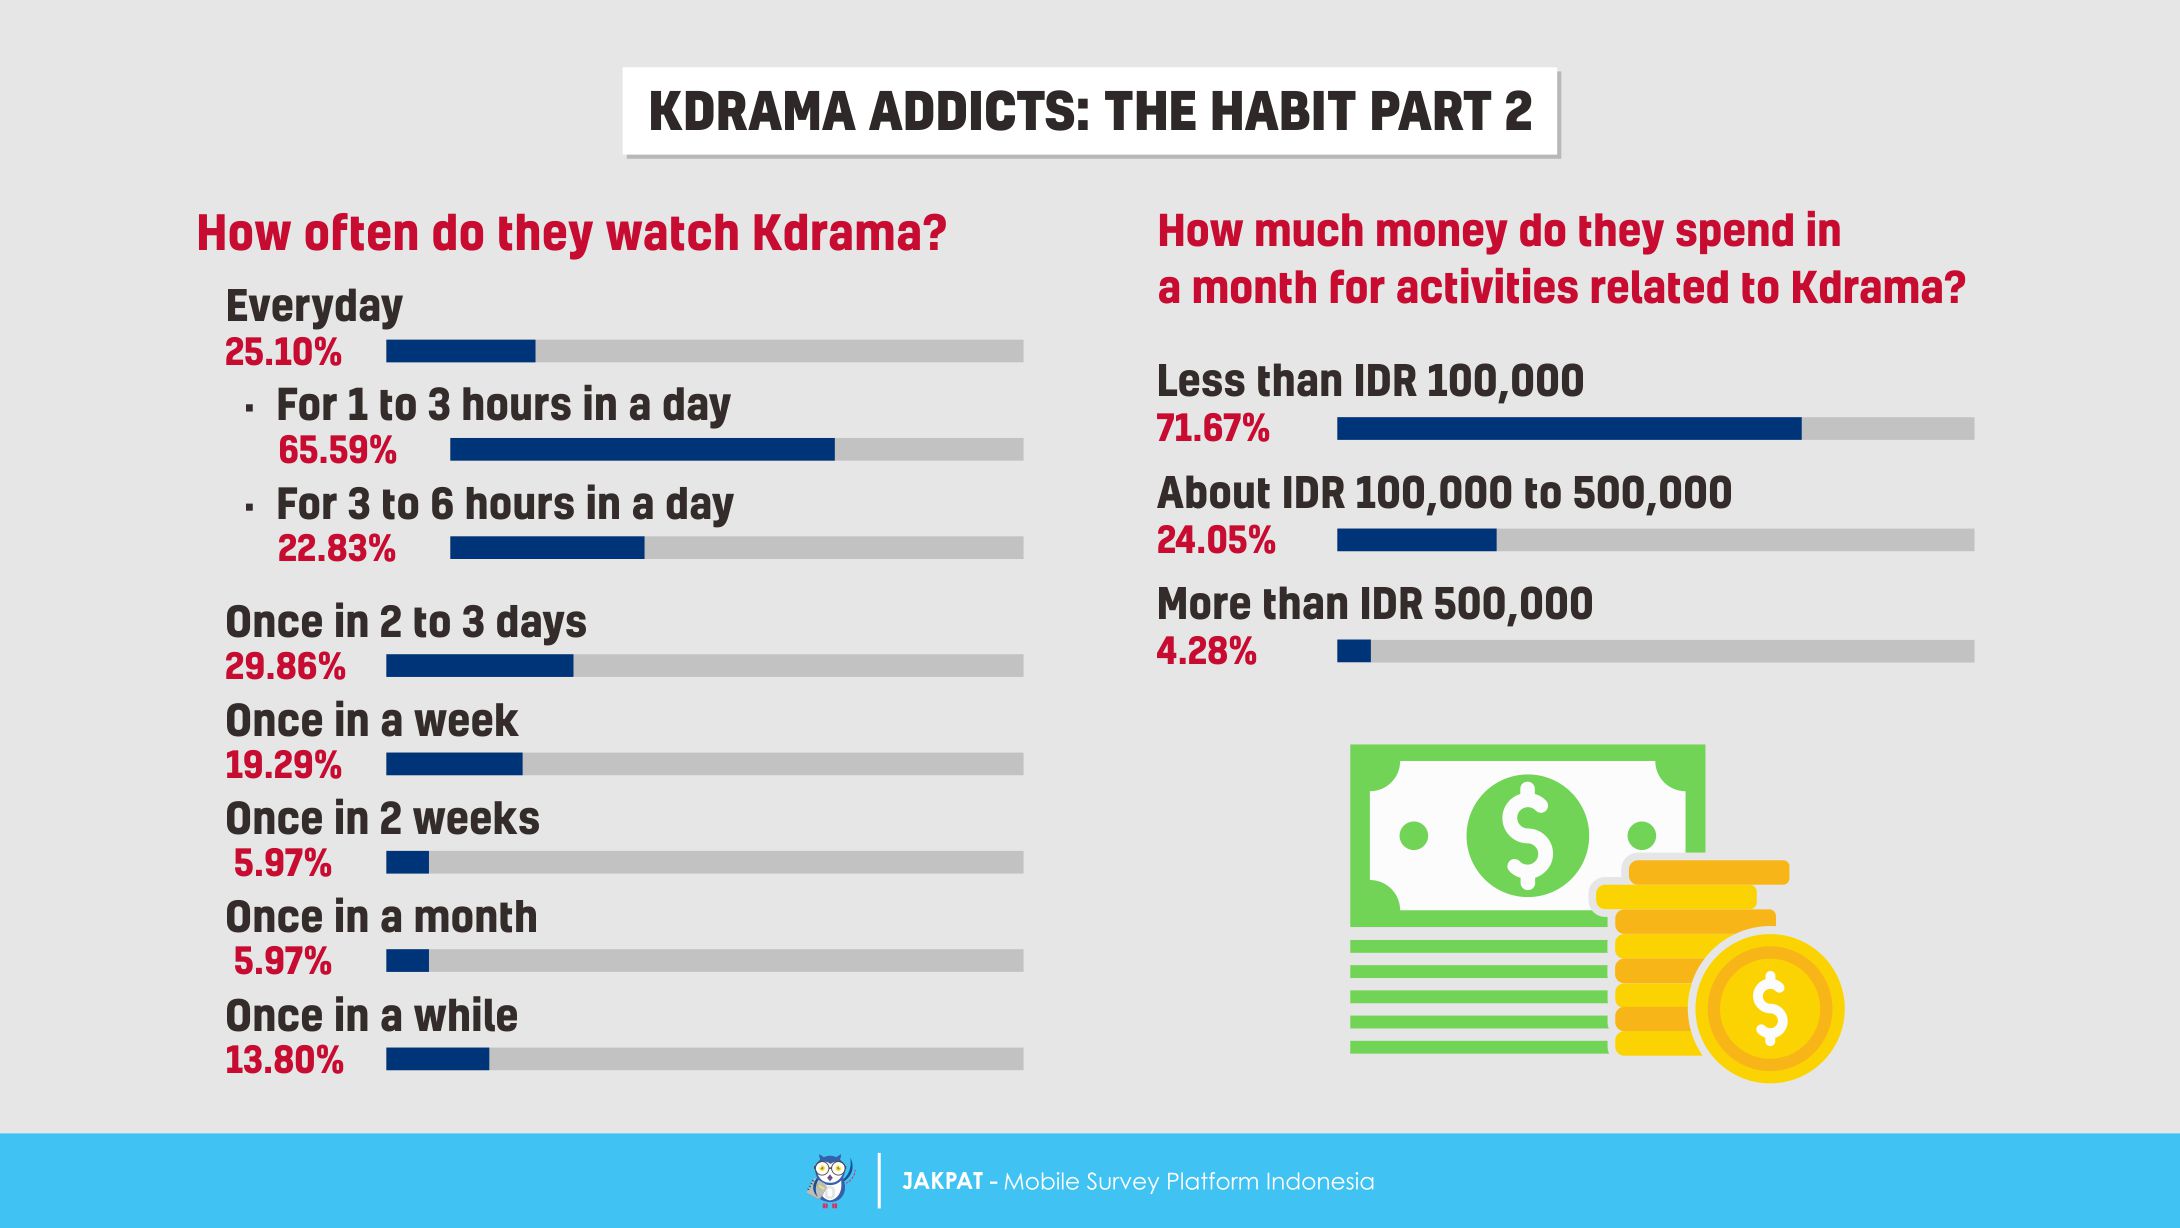
Still about some habit that Kdrama addicts have, we explore more about the amount of time and money spent for being Kdrama addicts. In the second part of this chapter we can find that many of our respondents watch Kdrama everyday (25.10%), for about 1 to 3 hours (65.59%) or about 3 to 6 hours (22.83%) in a day. Meanwhile, many of our respondents admit that they watch Kdrama once in 2 to 3 days (29.86%). Apparently, most of our respondents spend less than IDR 100,000 in a month for activities related to Kdrama (71.67%), while some of them admit that they spend about IDR 100,000 to IDR 500,000 (24.05%), and a few who spend more than IDR 500,000 (4.28%).
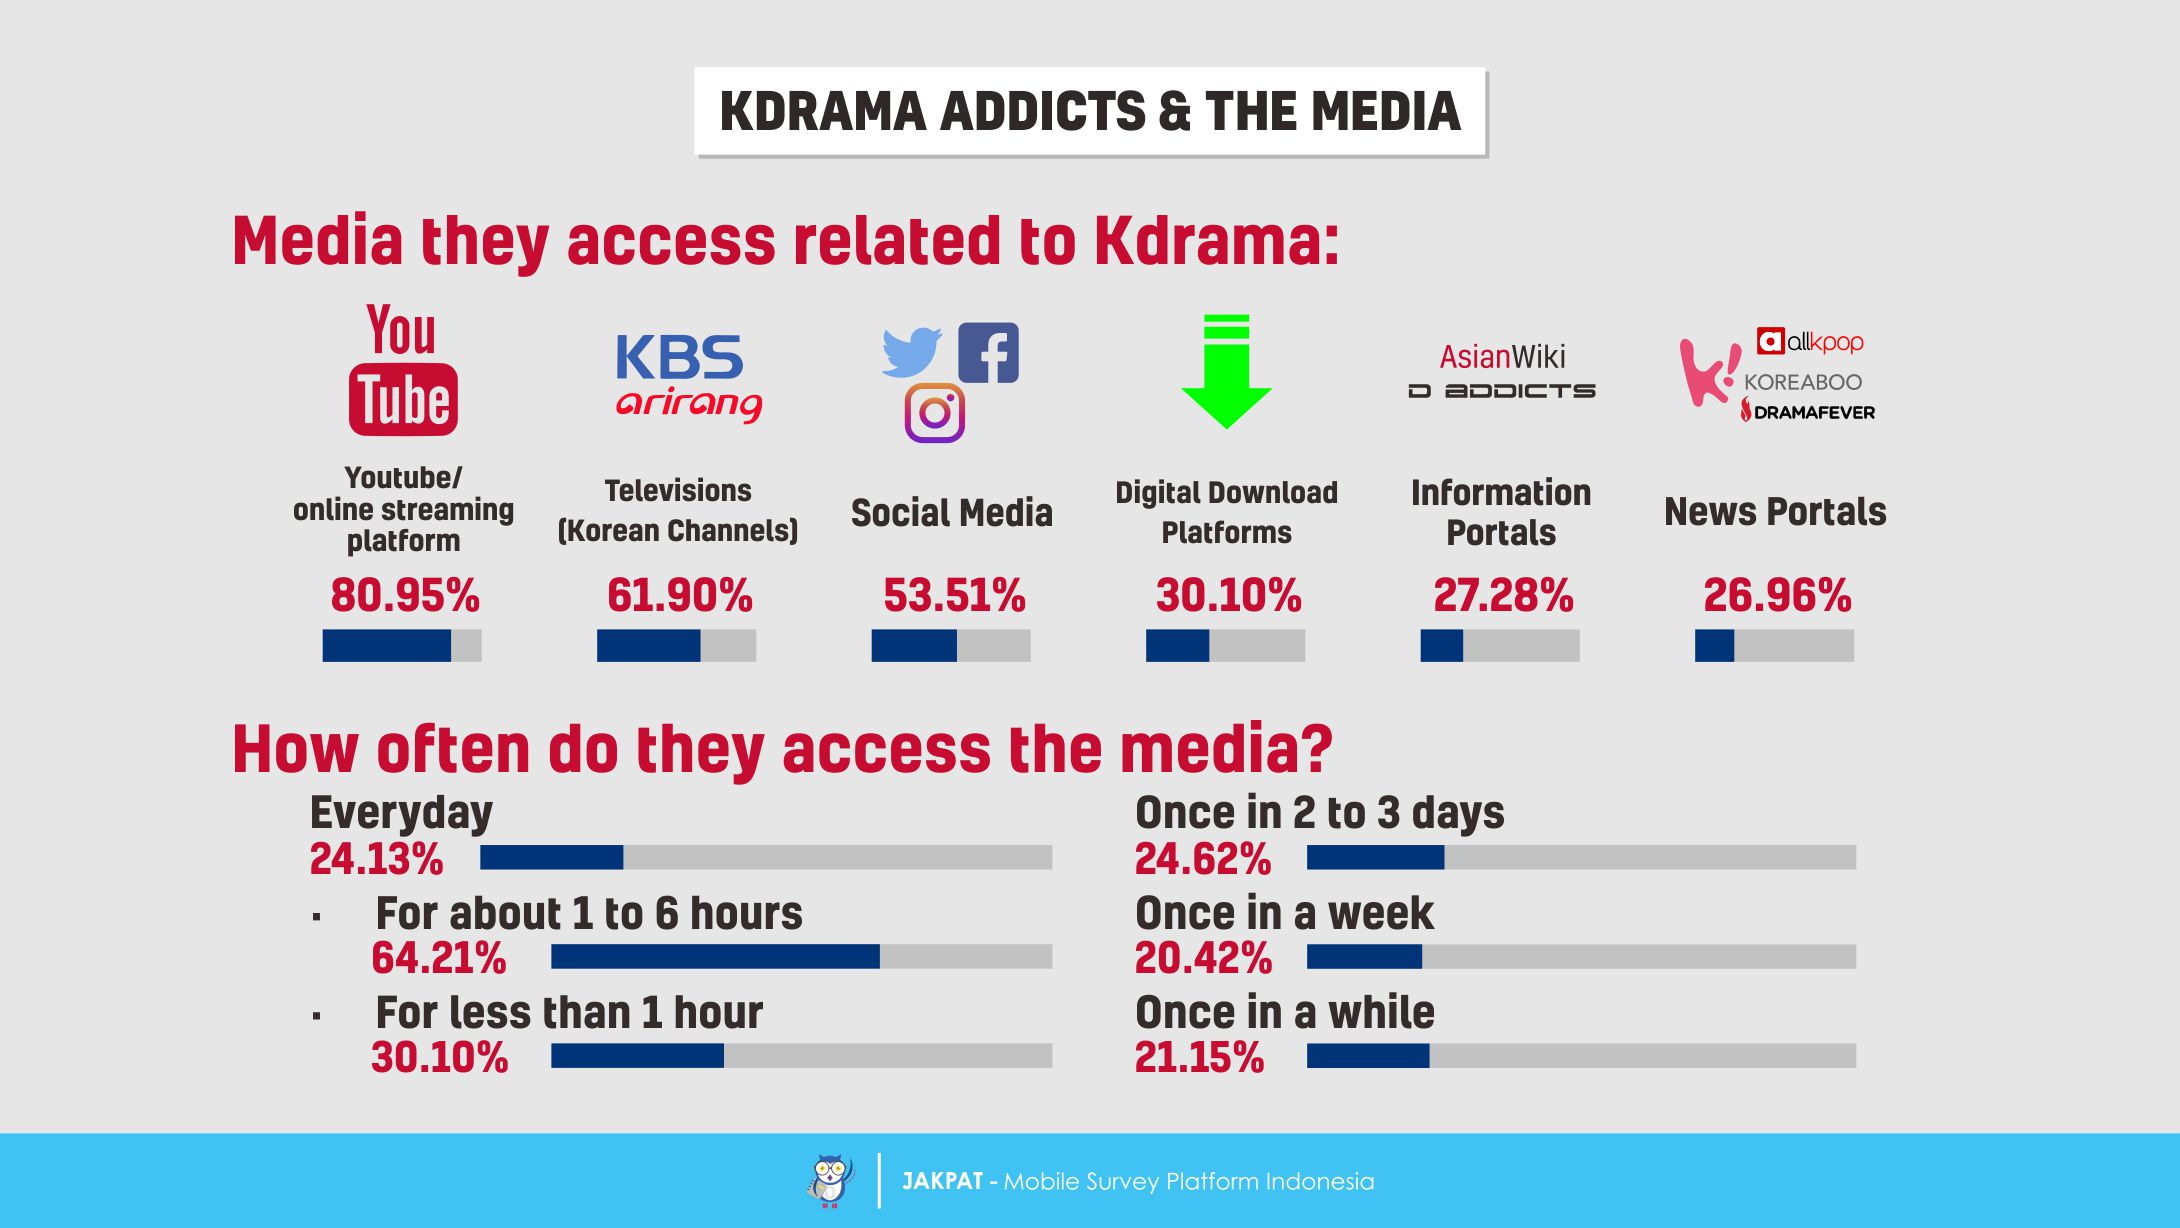
The third chapter of this survey report is about the media usage of Kdrama addicts. Related to Kdrama, most of our respondents access Youtube or any online streaming platforms (80.95%), while many of them access Korean television channels such as KBS World and Arirang TV (61.90%). More than half of our respondents (53.51%) access the social media, while some of them access any digital download platforms (30.10%), information portals (27.2%) such as Asian Wiki, or news portals (26.96%) such as Allkpop, Koreaboo, and Dramafever. There are some of our respondents who access the media related to Kdrama everyday (24.13%), for about 1 to 6 hours (64.21%) or less than 1 hour (30.10%) in a day. There are also some of them who access the media related to Kdrama only once in 2 to 3 days (24.62%), once in a week (20.42%), or even just once in a while (21.15%).
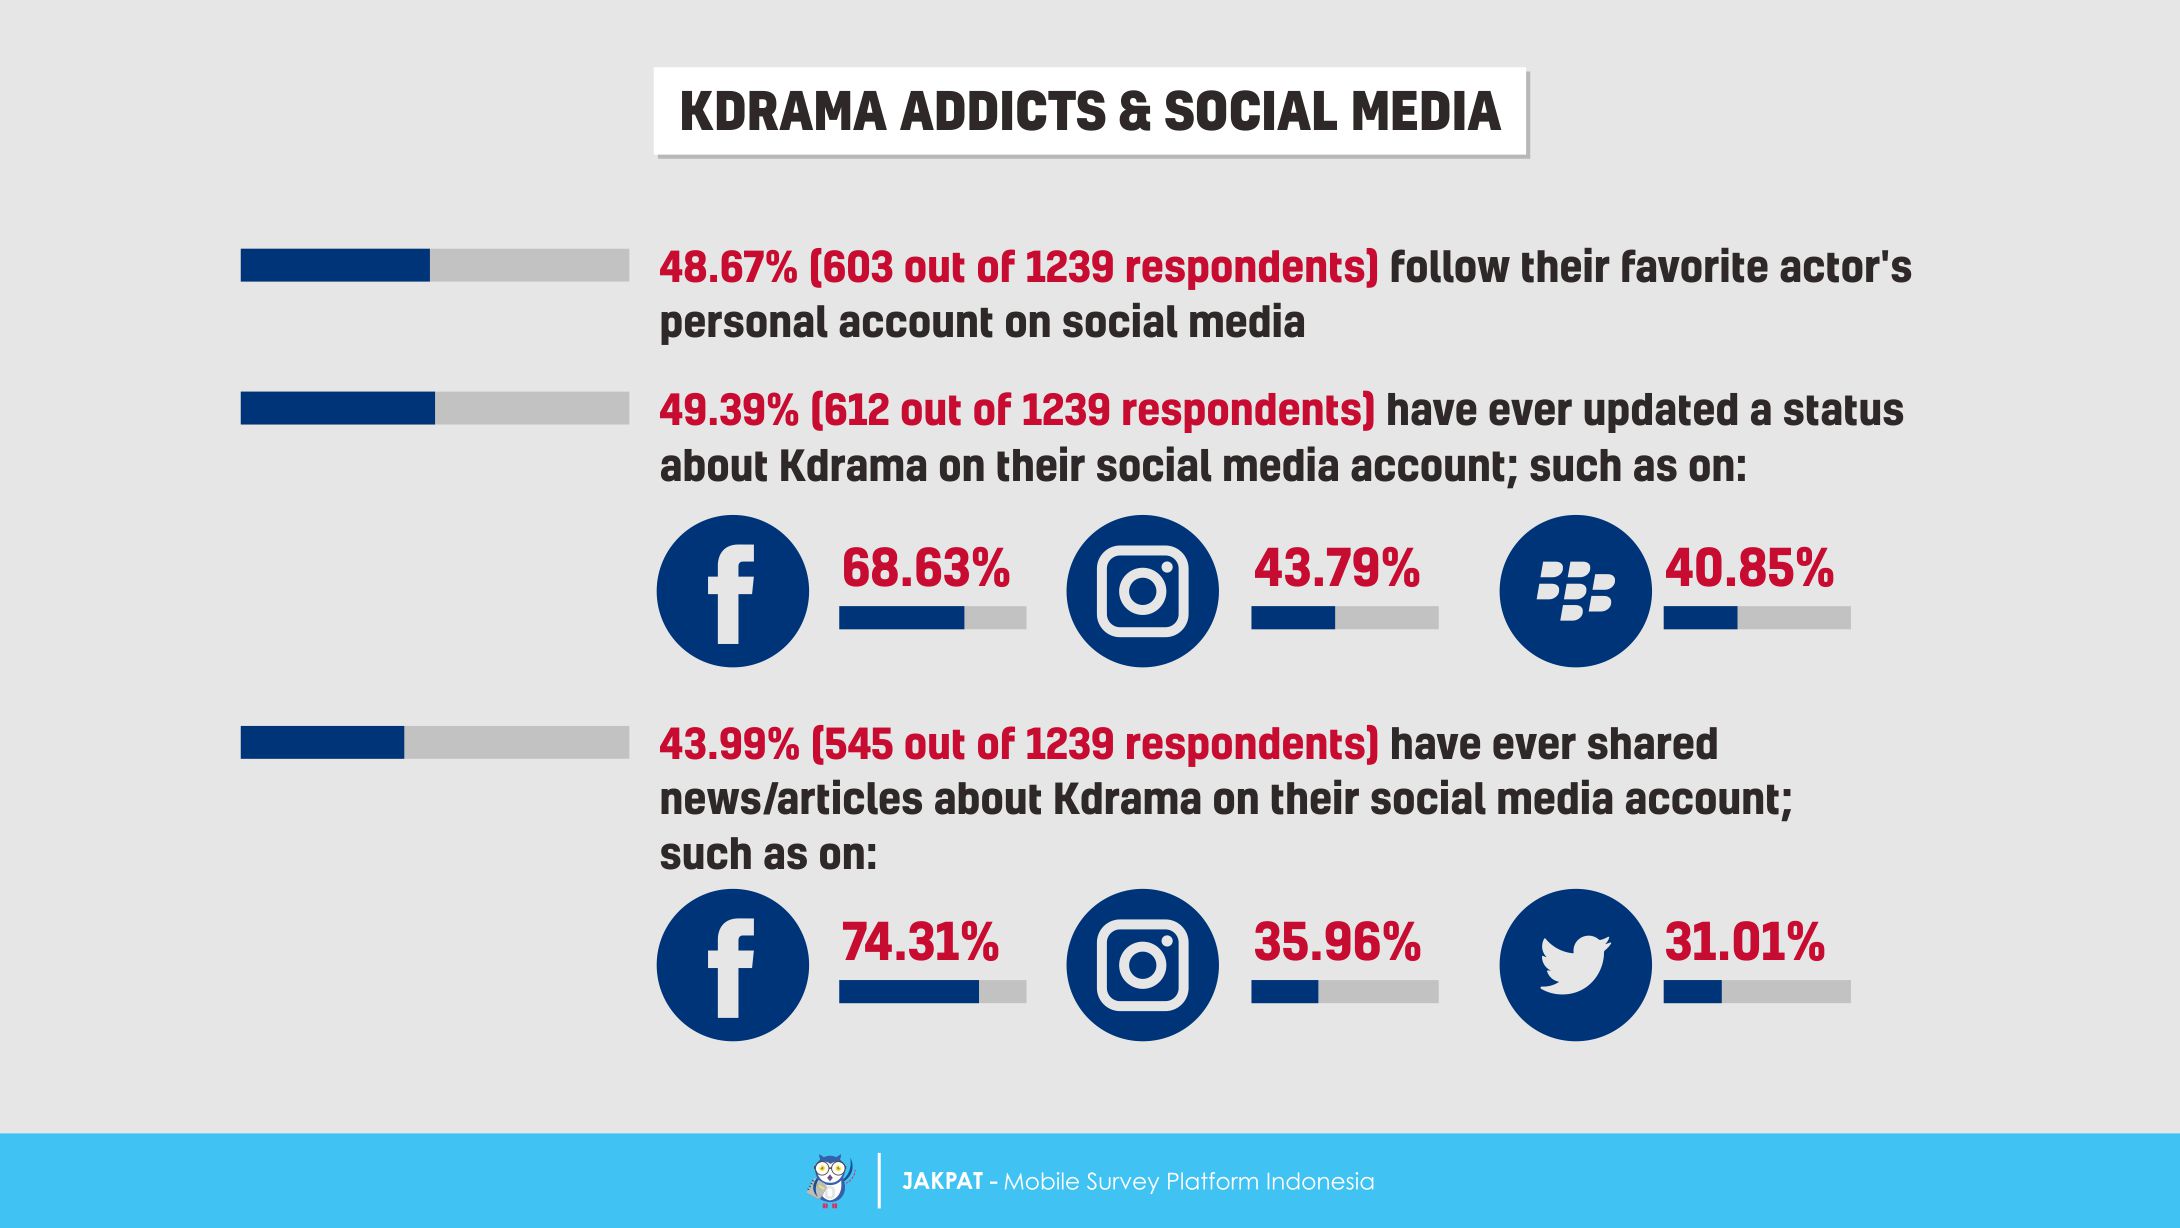
The fourth chapter of this survey report is about the social media usage by Kdrama addicts. Since actors hold significant role in the Kdrama universe, as well as it is the second thing people like the most about Kdrama, thus therefore it would be natural when Kdrama addicts want to get as closer as possible to their idols. We find that less than half of our respondents (48.67%) admit that they follow their favorite actor’s personal account on social media. Related to Kdrama, less than half of our respondents (49.39%) admit that they have ever updated a status about Kdrama on their social media account, such as on Facebook (68.63%), Instagram (43.79%), and Blackberry Messenger (40.85%). We also find that less than half of our respondents (43.99%) admit that they have ever shared news or articles about Kdrama on their social media account, such as on Facebook (74.31%), Instagram (35.96%), and Twitter (31.01%).
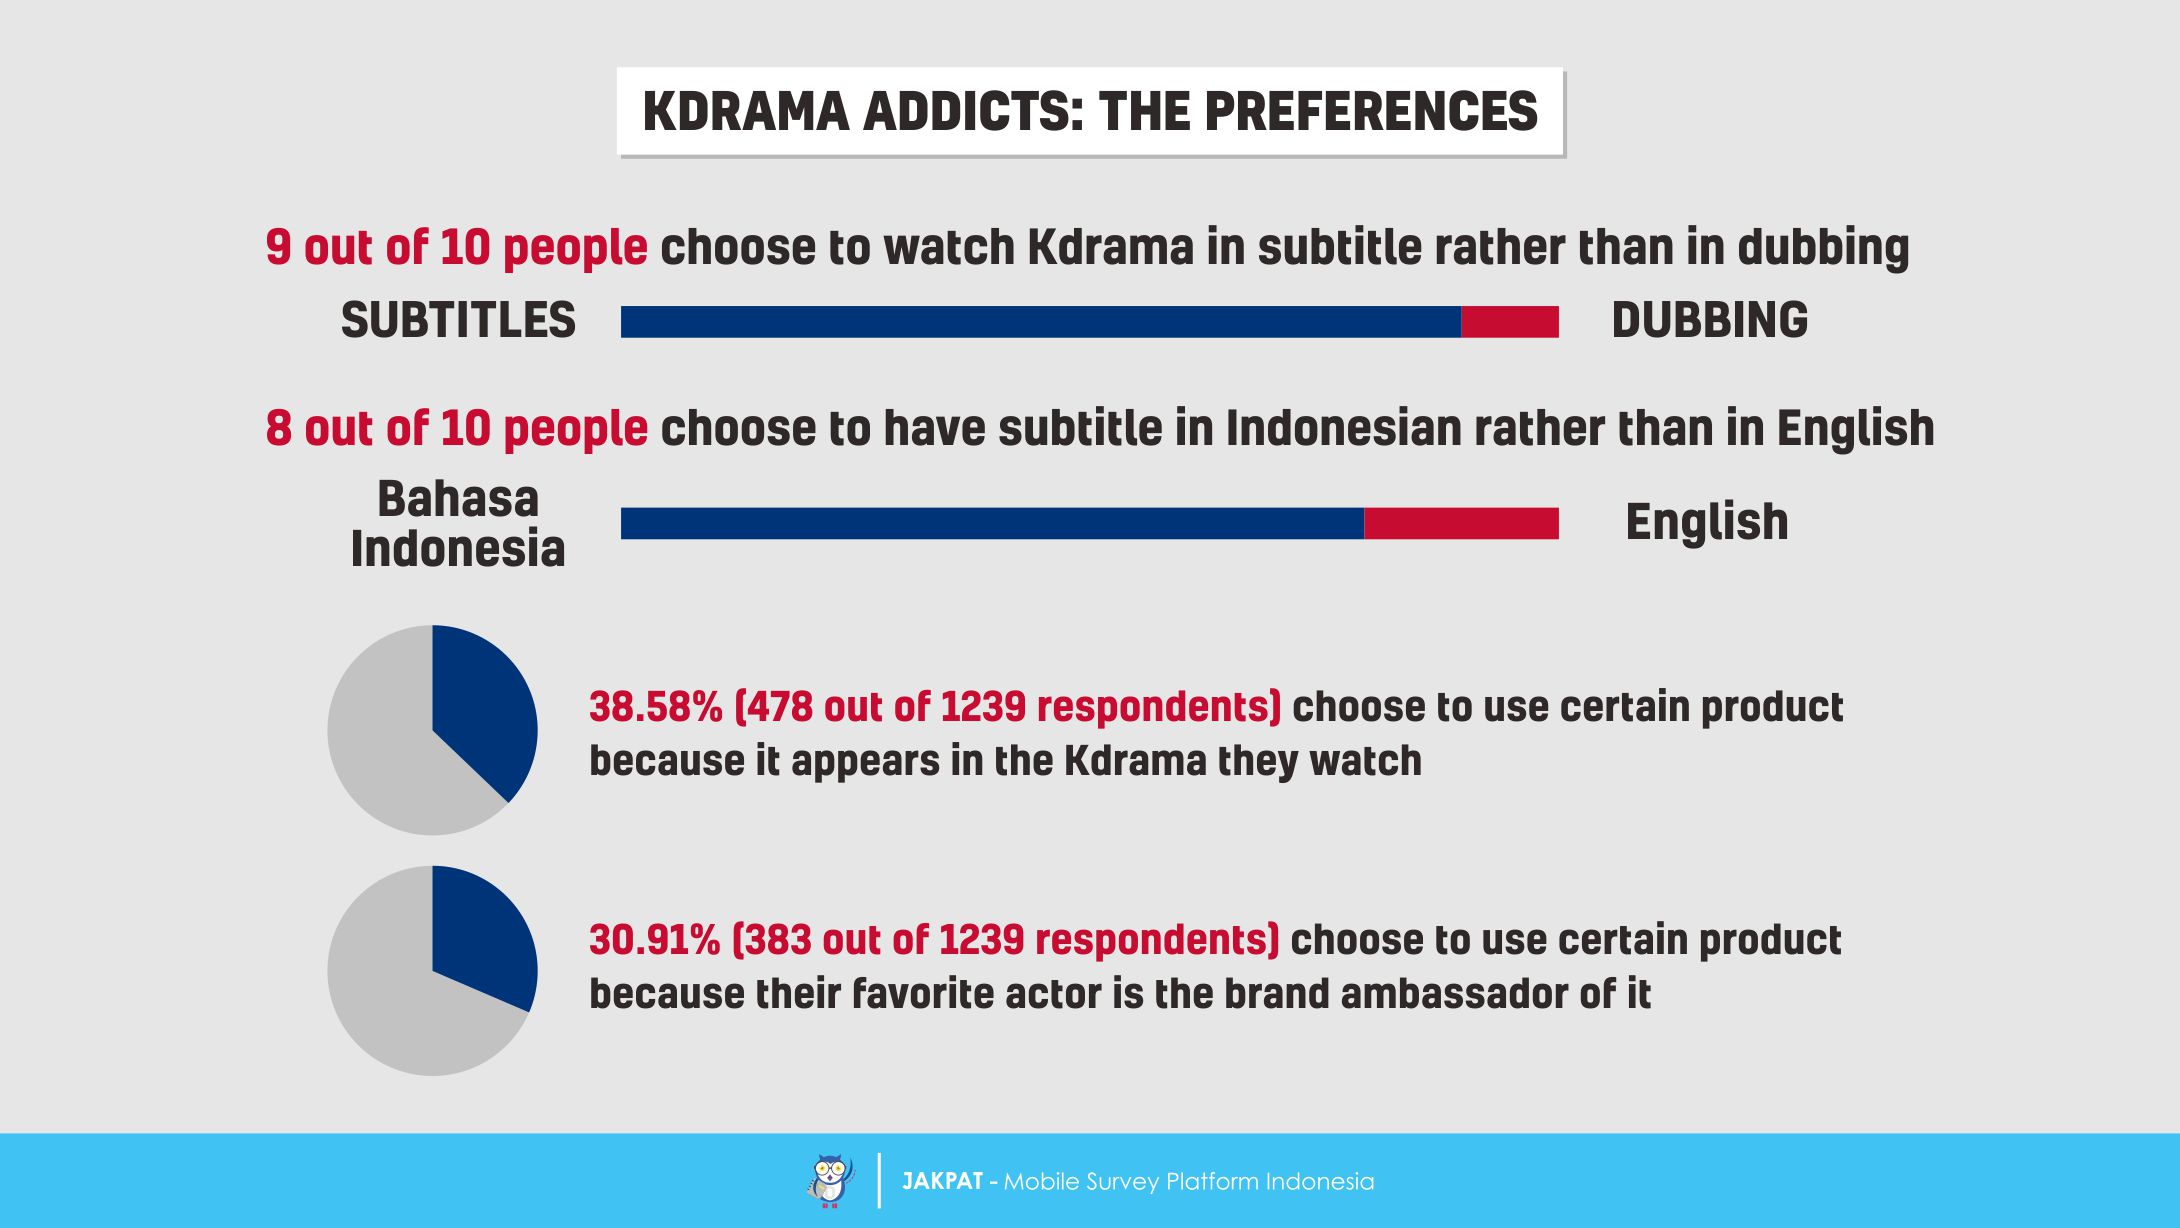
The fifth chapter of this survey report is about the preferences that Kdrama addicts have. When watching Kdrama, apparently most of our respondents (88.86%) admit that they choose to watch Kdrama in subtitle rather than in dubbing. Furthermore, most of them (80.95%) admit that they choose to have subtitle in Bahasa Indonesia rather than in English. Outside from watching Kdrama, some of our respondents (38.58%) admit that they choose to use certain product because it appears in the Kdrama they watch. Moreover, some of them (30.91%) admit that they choose to use certain product because their favorite actor or actress is the brand ambassador of that product.
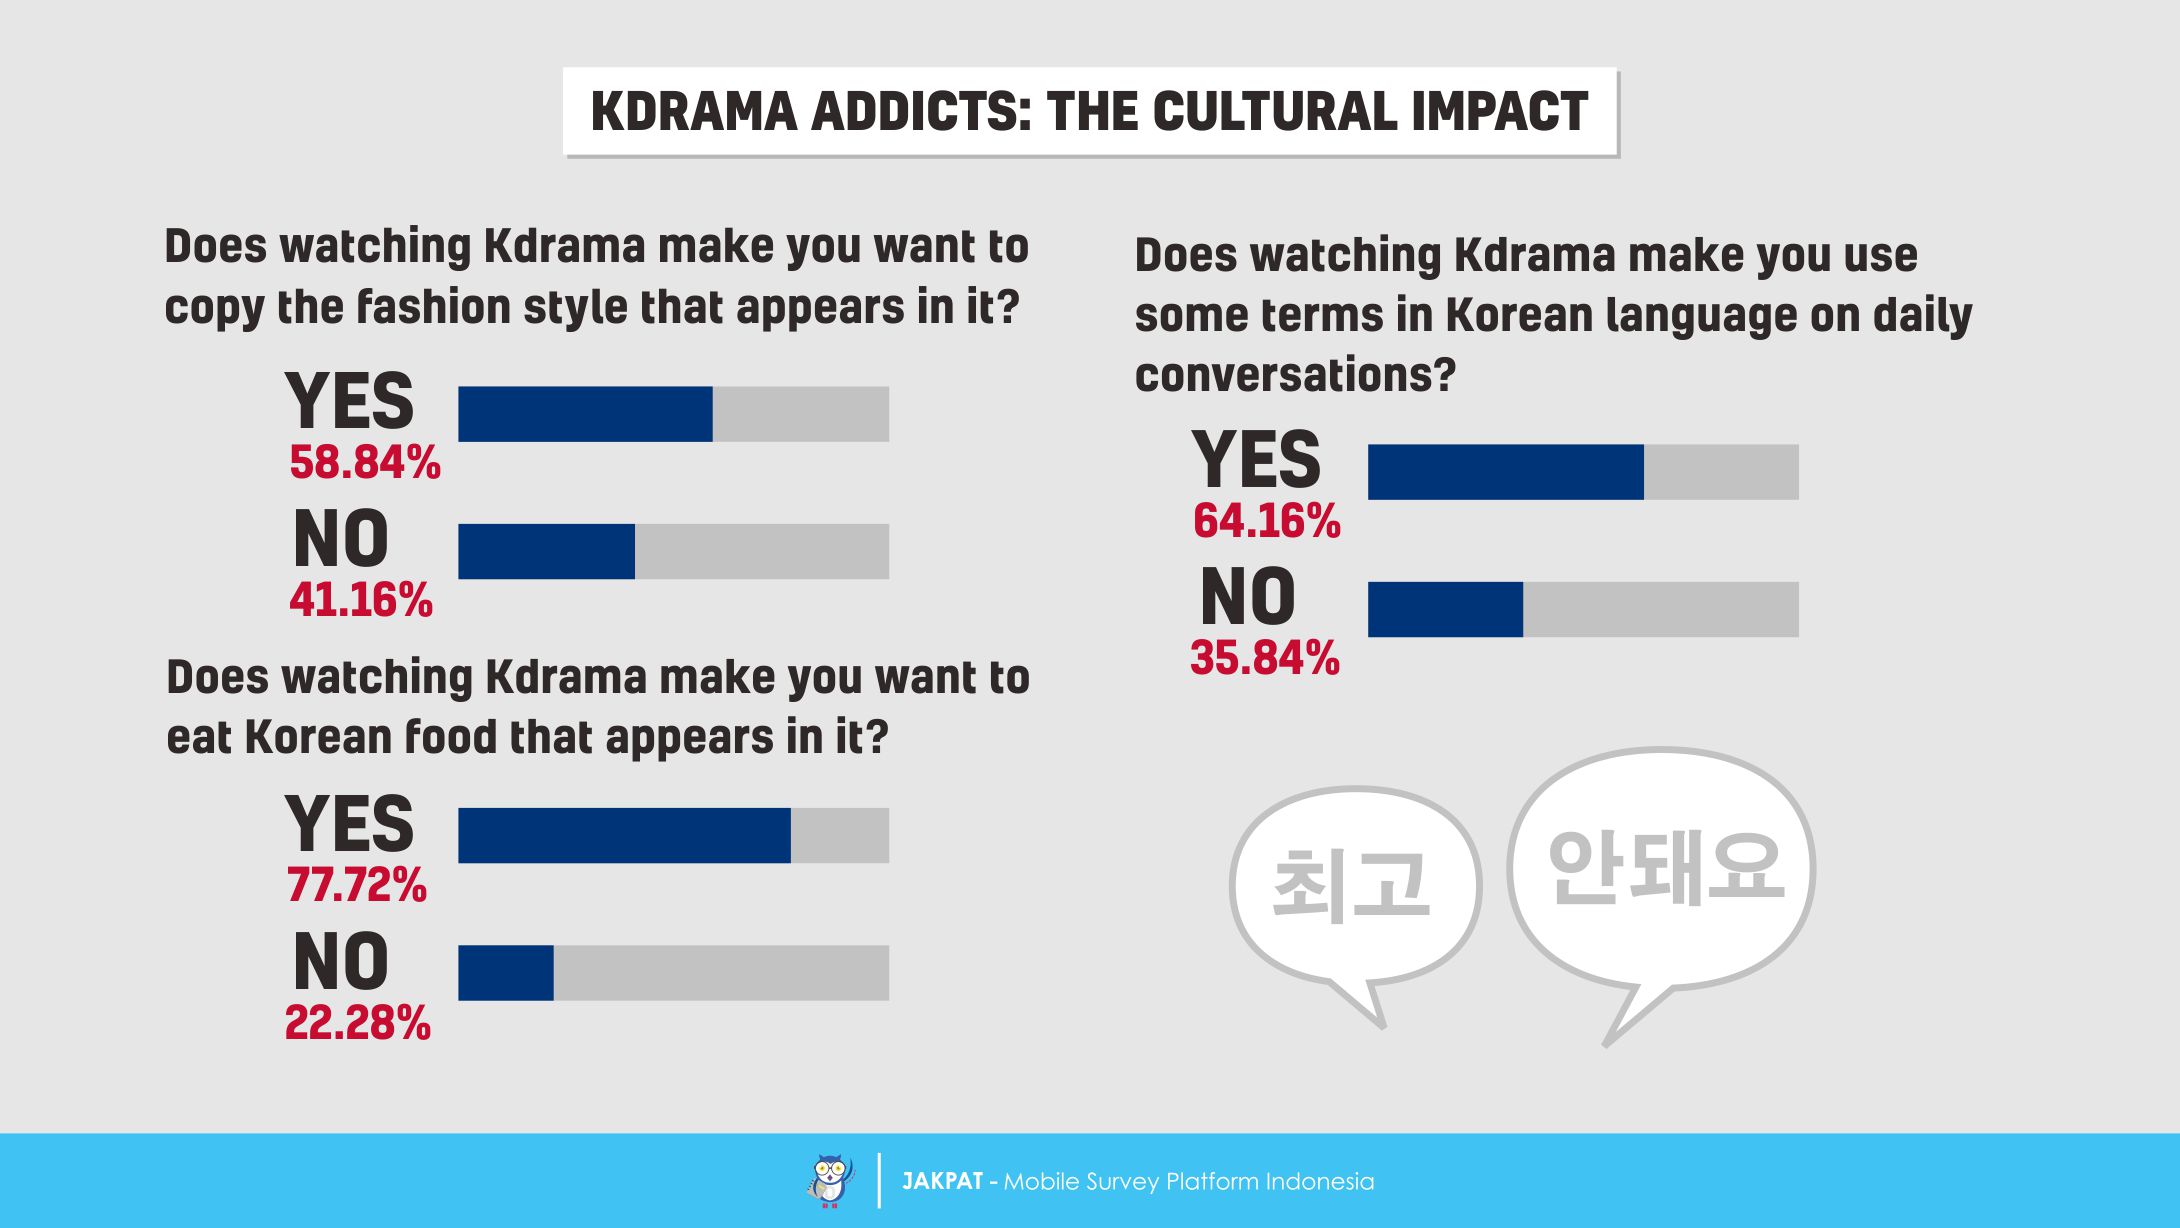
The sixth chapter of this survey report is about the cultural impact of Korean drama towards Kdrama addicts in Indonesia. As a product of culture, it cannot be denied that Korean drama must have some impact toward the cultural conditions of the country where it resides. In this case is how watching Korean drama affects Kdrama addicts in their daily basis activities and routines. More than half of our respondents (58.84%) admit that watching Korean drama makes them want to copy the fashion style that appears in it. Meanwhile, most of our respondents (77.72%) admit that watching Korean drama makes them want to eat Korean food that appears in it. In addition to that, many of our respondents (64.16%) admit that watching Korean drama makes them use some terms in Korean language on daily conversations.
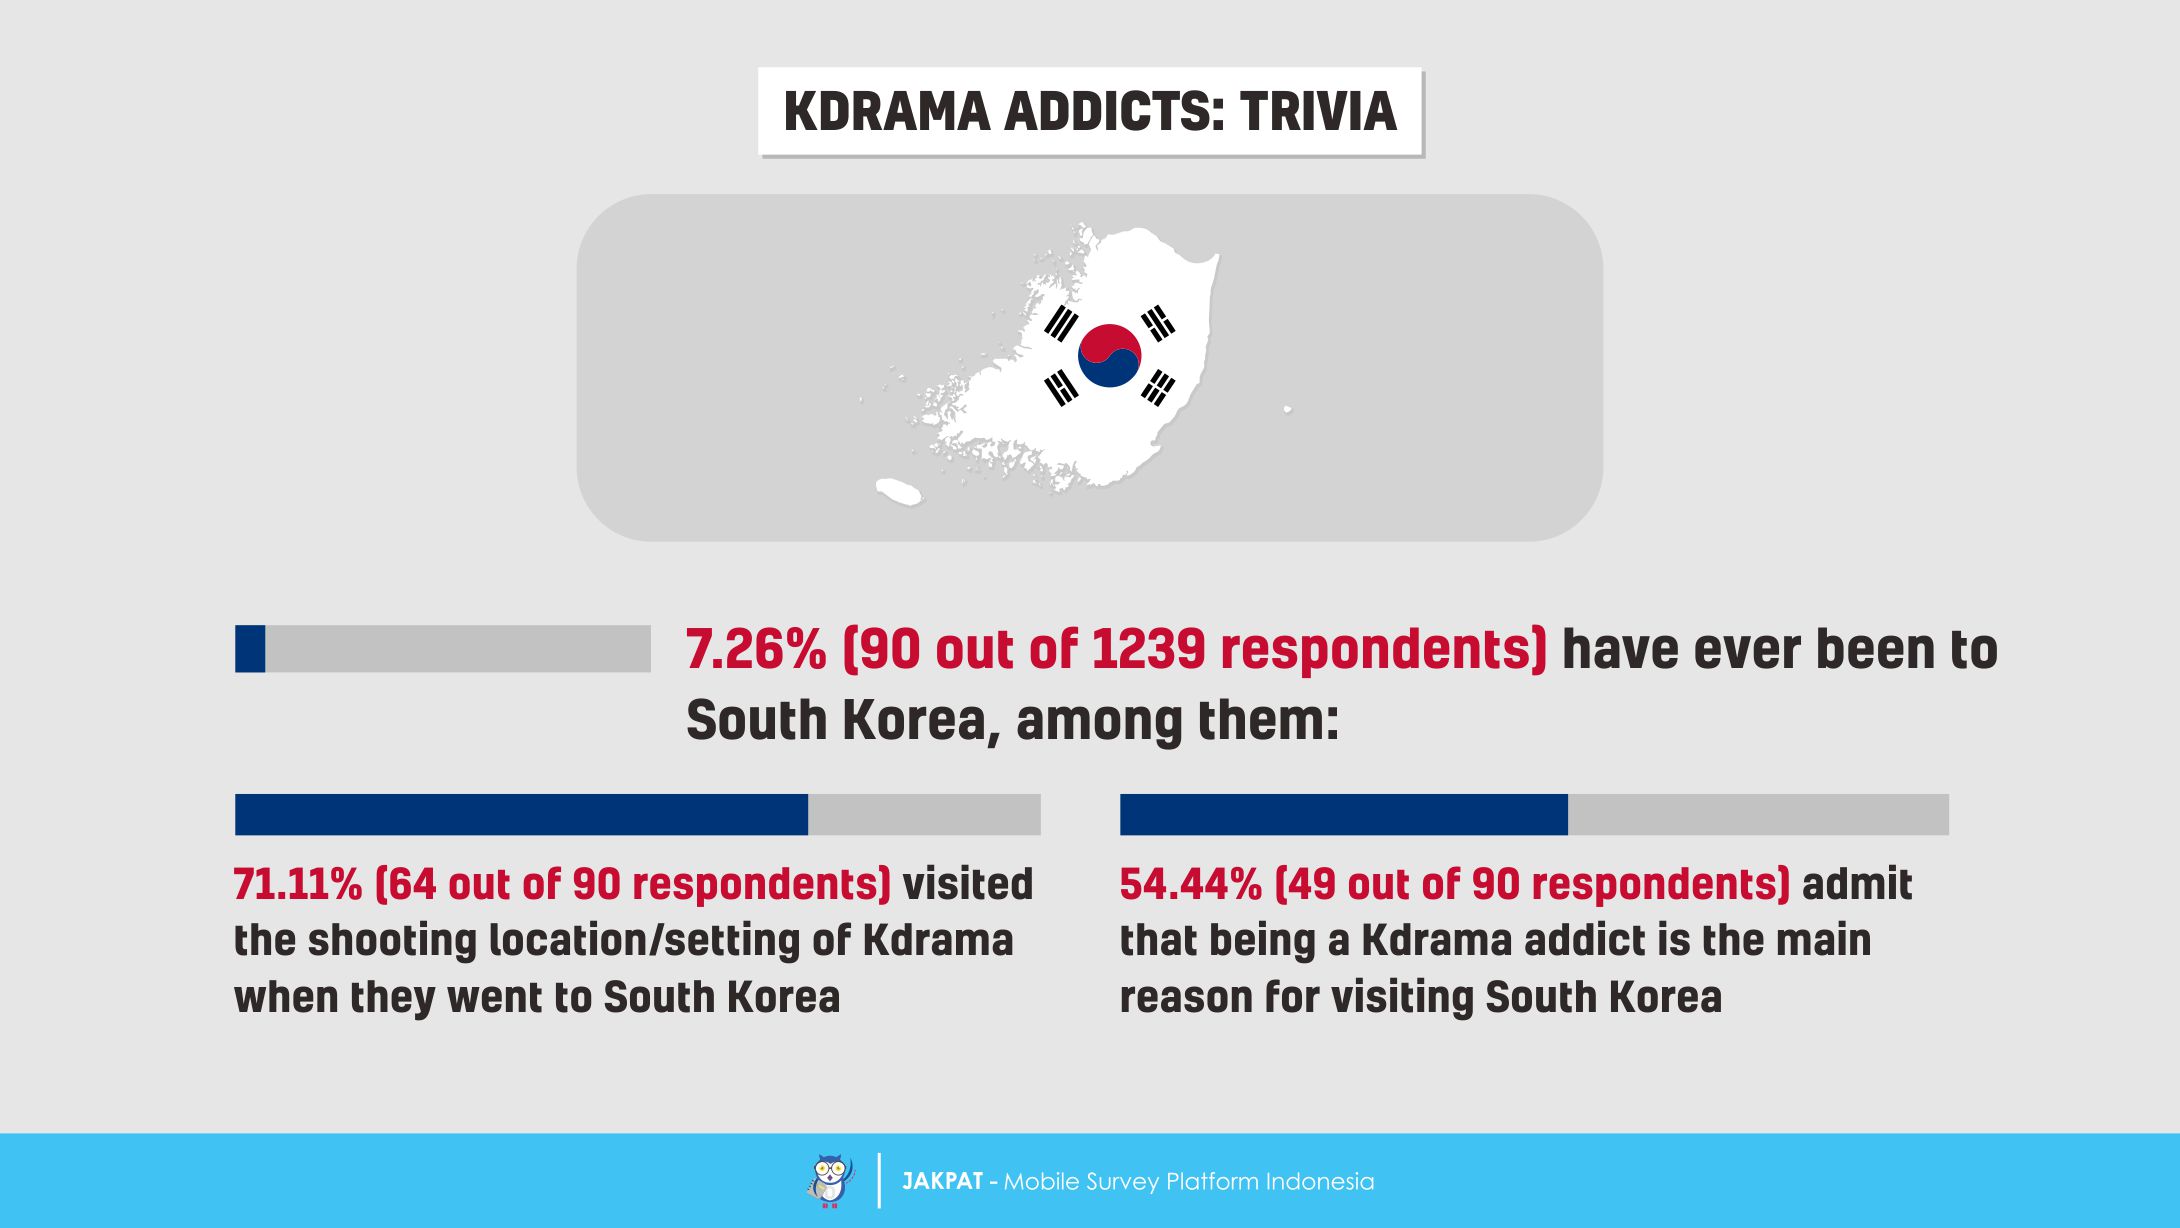
The seventh or the last chapter of this survey report contains some trivia we gather about Kdrama addicts in Indonesia. Apparently, we find that a few of our respondents (7.26%) have ever been to South Korea. Among them, mostly were visiting the shooting location or setting of Korean drama when they were in South Korea (71.11%). Lastly, more than half of them who have visited South Korea (54.44%) admit that being a Kdrama addict is the main reason for them to visit South Korea.
For more detail you can download XLS report at the button below (Bahasa Indonesia). JAKPAT report consists of 3 parts which are 1) Respondent Profile, 2) Crosstabulation for each question and 3) Raw Data. Respondent profile shows you demographic profiles ( gender,age range, location by province, and monthly spending). Cross tabulation enables you to define different demographic segment preference on each answer.
![]()
You can also download PDF here:
![]()

or Get A Sales Quote by filling this form or Call to +622745015293
