

As a consumer you may ever have a bad experience in consuming or using the product. Well, actually you have the right to complain to the brand/product company, precisely to the customer care center of the company. However, when it comes to complain, social media seems to be an effective option to share complaint to the company. The brand presence in social media enable us to directly talk to the company, explaining our complaint, and hope for the best to get a solution from them. This way of complaining even seems to be more effective than writing readers’ letter in mass media, or calling customer care service which sometimes require us to follow the complicated procedure.
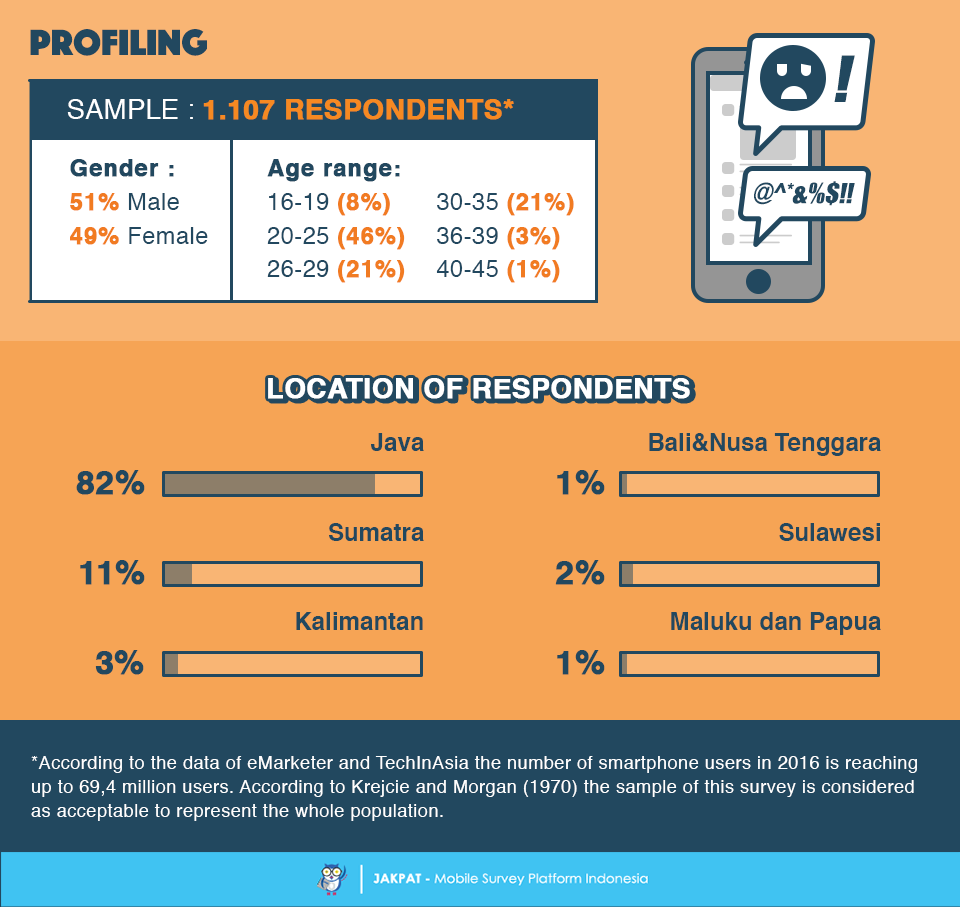
We send a survey to our 1.107 respondents in nationwide to understand their complain behavior on social media. The demographic compositions of our respondents in this survey are 51% male and 49% female. Moreover, the detail information about our panel of respondents who have participated in this survey is shown in the infographic below.
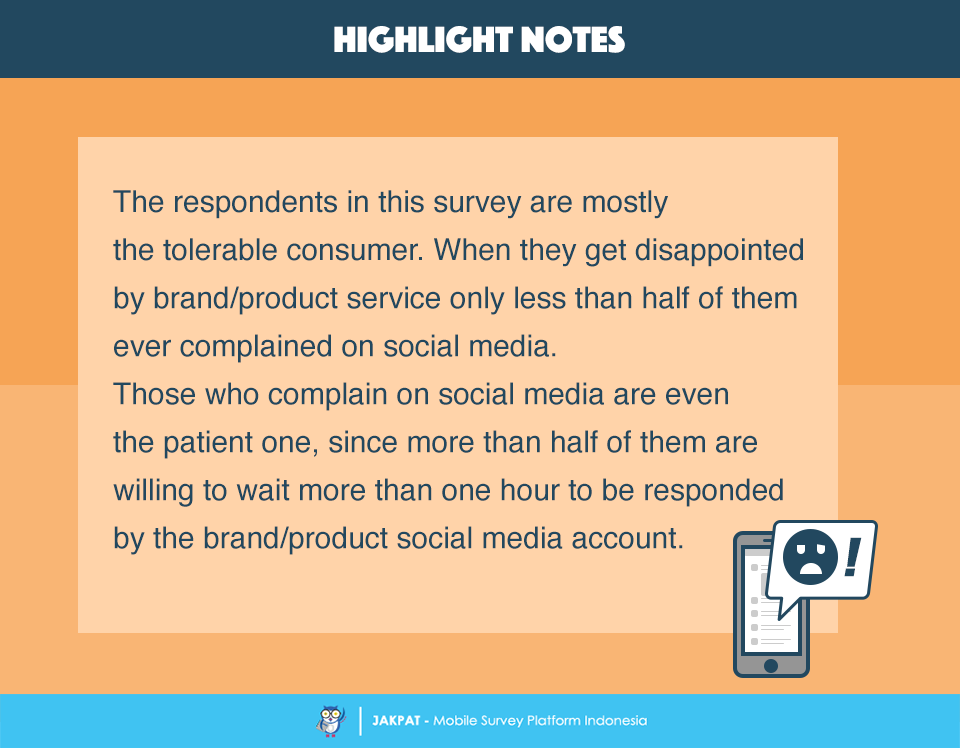
One notable highlight of the finding data in this survey is the characteristic of our respondents in this survey which most of them are considered as the tolerant consumer. Only less than half of them are complaining on social media when they have a bad experience in using product. Moreover, their willingness to receive any response or feedback from company is relatively tolerant as well, since most of them are willing to wait up to more than one hour to be responded.
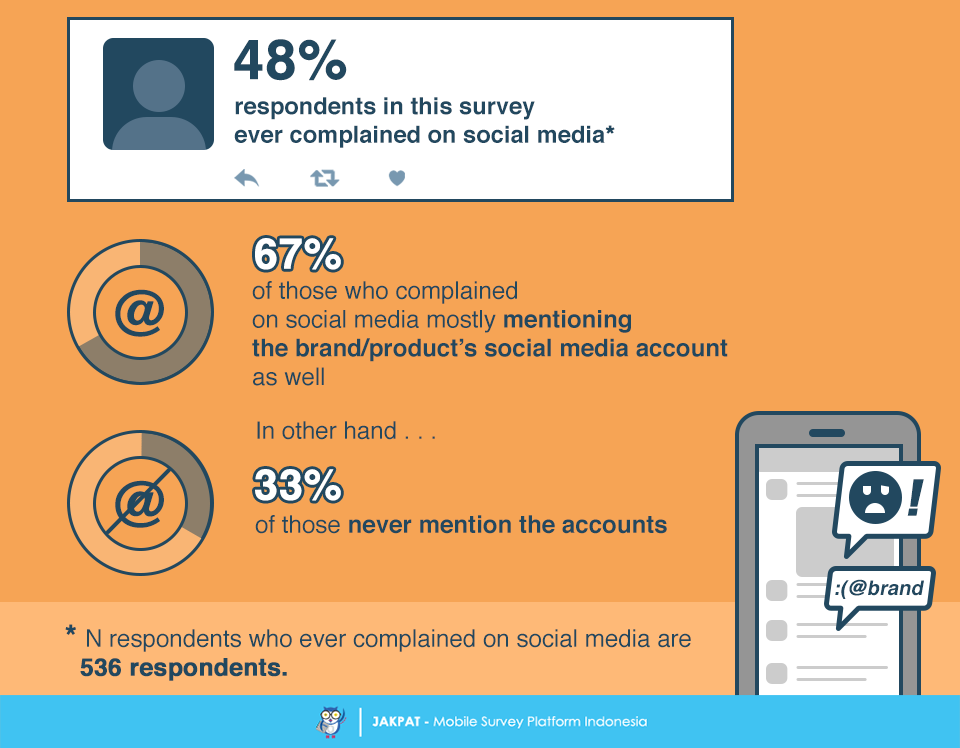
We further examined the respondents who ever complained on social media. From all respondents who ever complained on social media, 67% of them mostly mention the brand/product’s social media account, while 33% of them never mention the accounts.
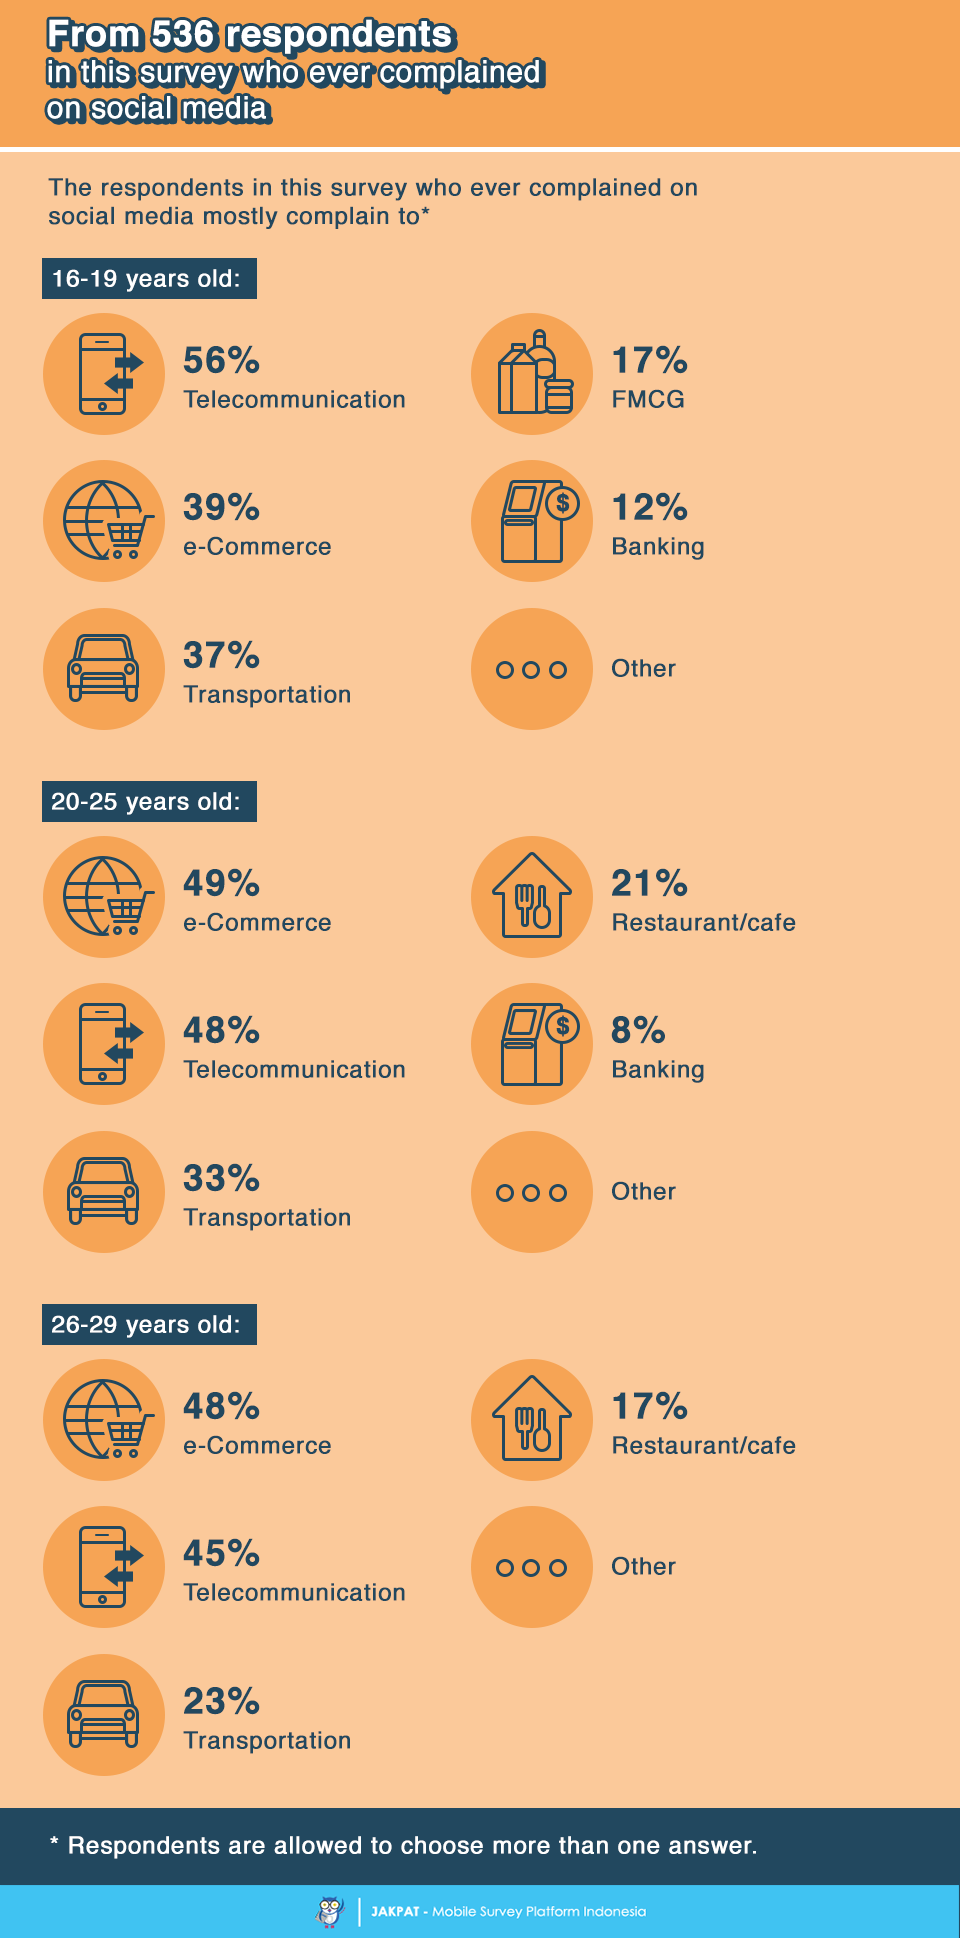
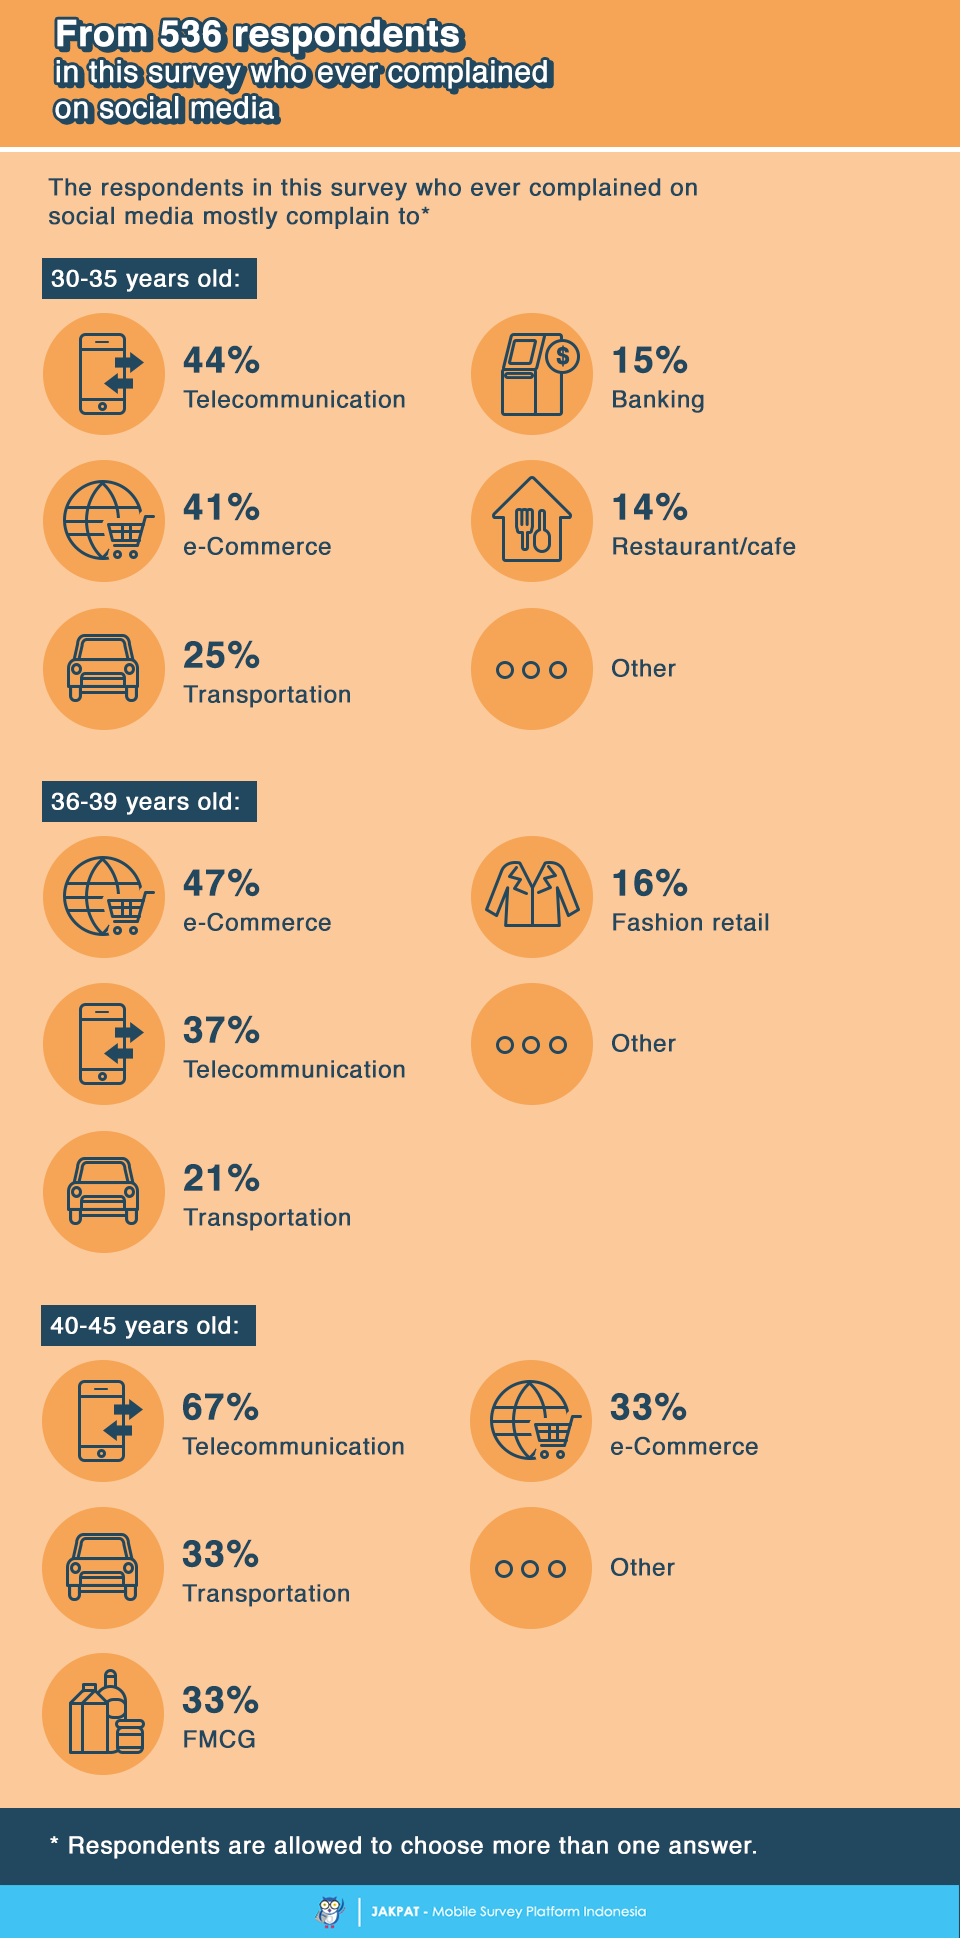
Regarding the field of industry they had been complaining, two industries becomes two most complained corporations by respondents in almost all age segments. To be detailed, telecommunication and e-commerce is the field of industries that receive most complaints from their consumer on social media.
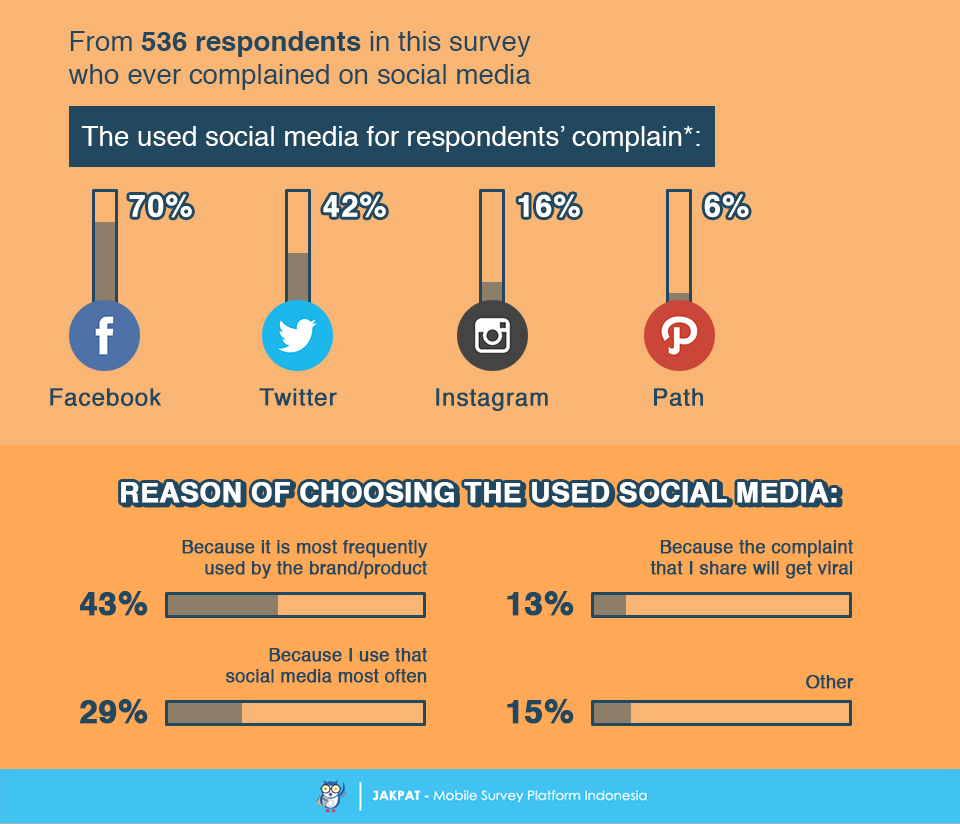
We also map the used social media to communicate respondents’ complain. Facebook and Twitter still becomes the two mostly used social media platform to complain. Moreover, respondents’ preference on choosing the particular medium is mostly affected by the brand presence on the chosen social media.
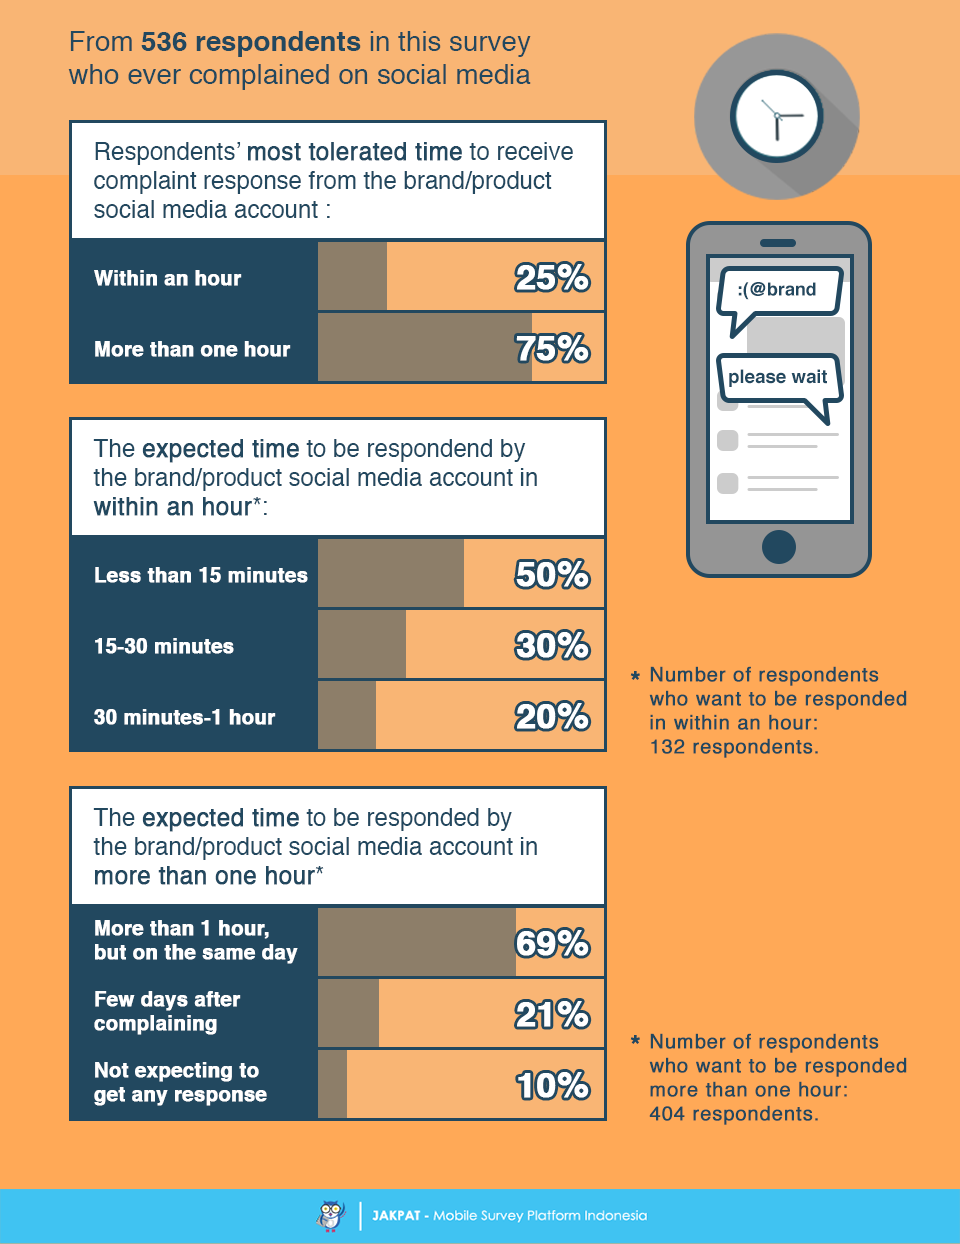
One thing to be considered in facing a complaint is the responsiveness to handle it. Most respondents in this survey are the patient consumer since 75% of them are willing to wait until more than one hour to receive feedback or response from the brand/product’s social media account.
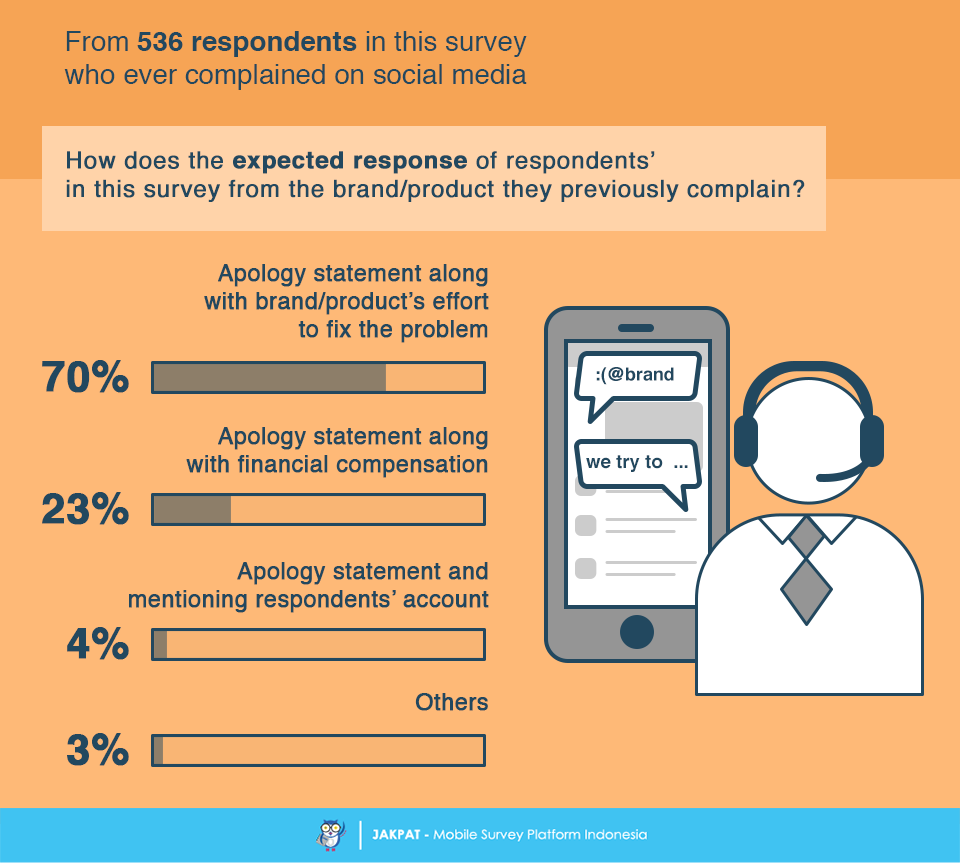
Regarding the expected response from the brand/product they have complained, most respondents in this survey are expecting to receive apology statement along with the effort to overcome the problem. Only 23% of them are expecting to receive financial compensation such as free gift, voucher, and so on.
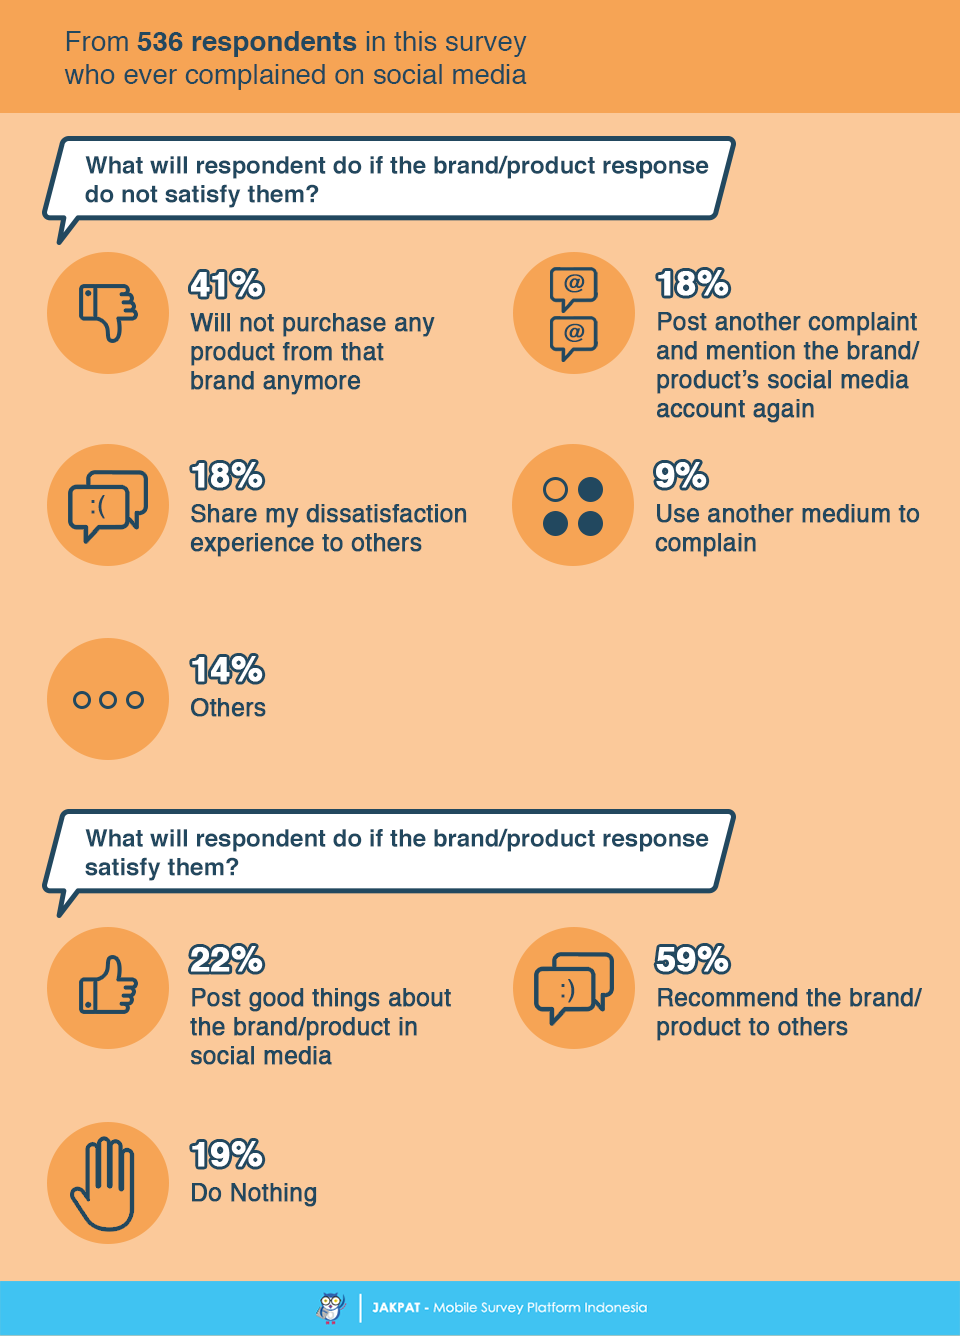
We then ask them about their reaction if the brand/product they once complained gives satisfying response. Most respondents said that they will post a good thing about the brand/product and recommend it to others. In other hand, if they receive dissatisfied response then most of them will not purchase any product from that brand anymore.
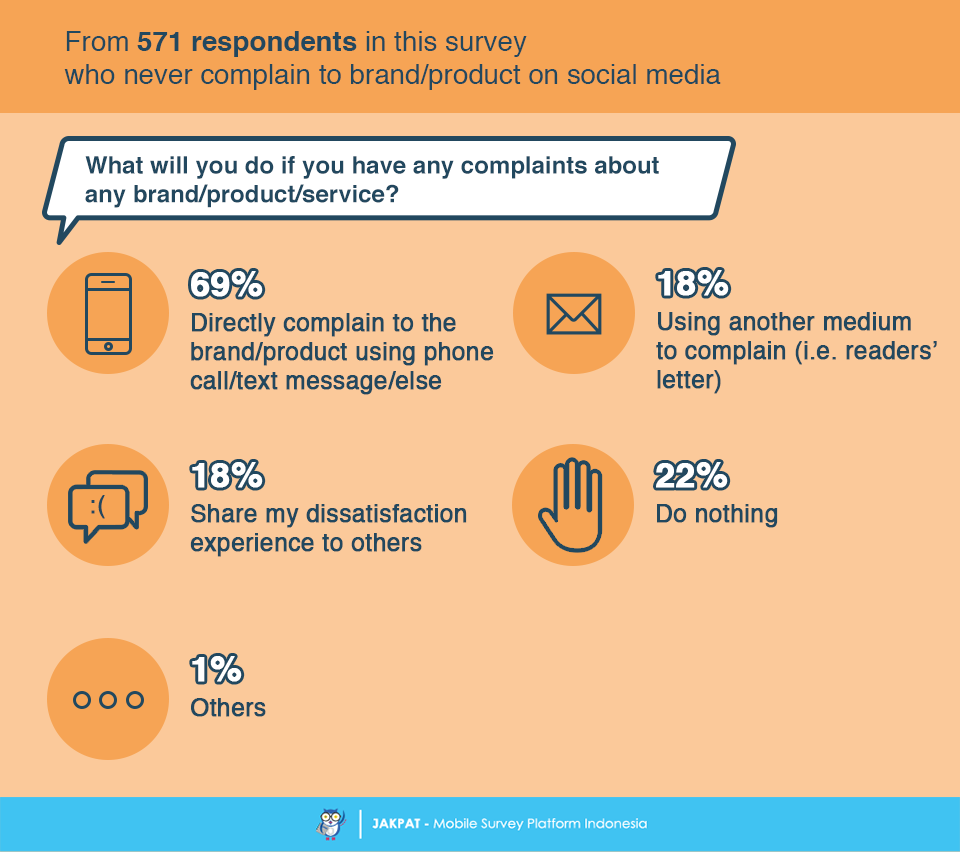
At last, we also ask the 571 respondents in this survey who never complain to any brand/product on social media about their experience of complaining when they face dissatisfying experience in using or consuming the product. Apparently, most of them are directly complaining to the brand/product using phone call or text message other than social media. In fact, there are also 22% of our respondents who do nothing when they have any complaints about the brand/product dissatisfying service.
For more detail you can download XLS report at the button below (bahasa). JAKPAT report consists of 3 parts which are 1) Respondent Profile, 2) Crosstabulation for each question and 3) Raw Data. Respondent profile shows you demographic profiles ( gender,age range, location by province, and monthly spending). Cross tabulation enables you to define different demographic segment preference on each answer.
![]()
You can also download PDF here:
![]()

or Get A Sales Quote by filling this form or Call to +622745015293
