

There are many known ways of how to allow ourselves to feel relaxed or to have a quality time. It is safe to say that one of the ways is by hanging in a café or coffee shop. As cafés seem to have been growing bigger in number, people have gotten used to visiting one just to relax for a certain period of time. This survey, handed out to as many as 1021 respondents, will try to reveal some questions or curiosities about the habit or lifestyle of spending time in a café.
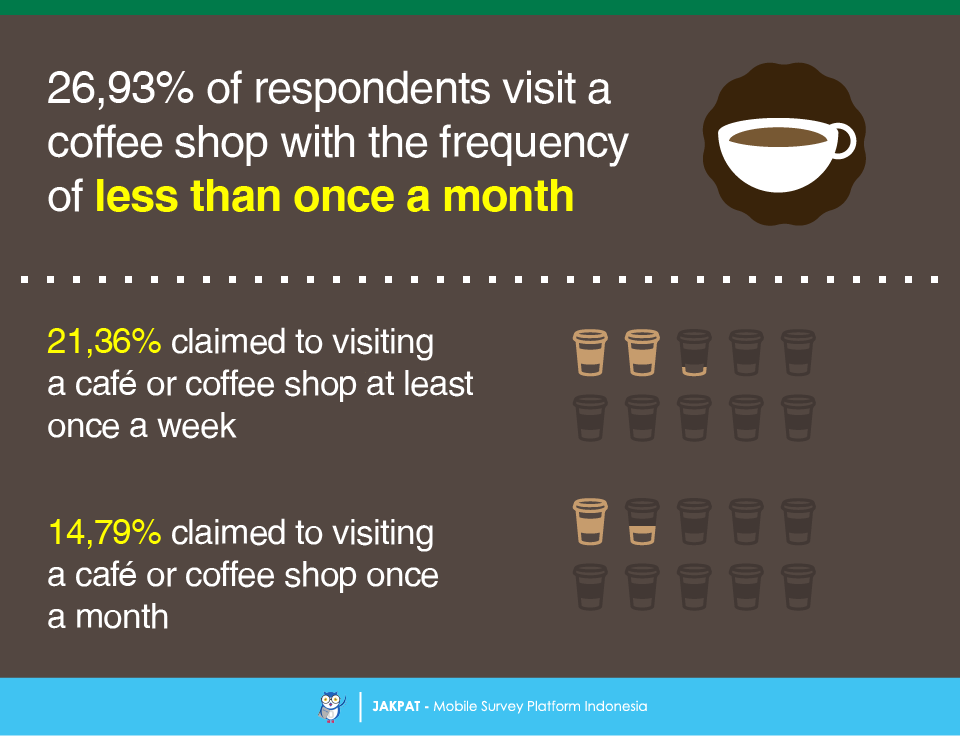
We found out that most of the respondents (26,93%) visit a café not so often. The fact shows they do it less than once a month. A different group of people (21,36%) claimed to visiting a café at least once a week. While another 14,79% do it once a month.
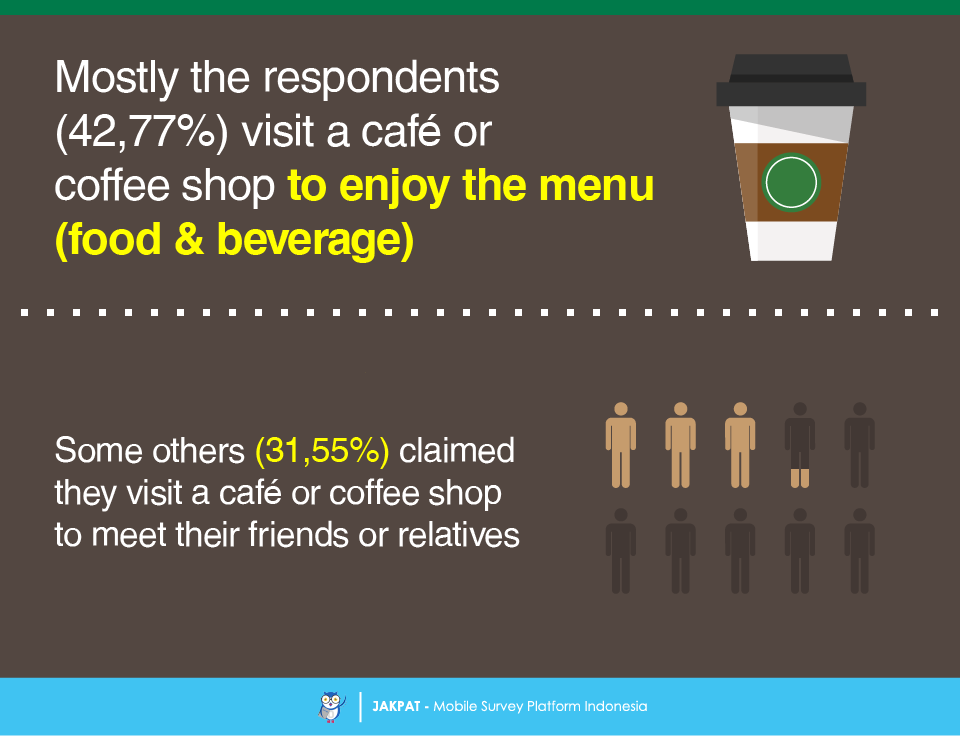
What do the people look for exactly in a café when they are visiting one? The favorite answer is to enjoy the menu (food & beverage), as claimed by 42,77% of the respondents. A lower number of people, 31,55%, claimed they visit a café to have a meeting with their friends or relatives.
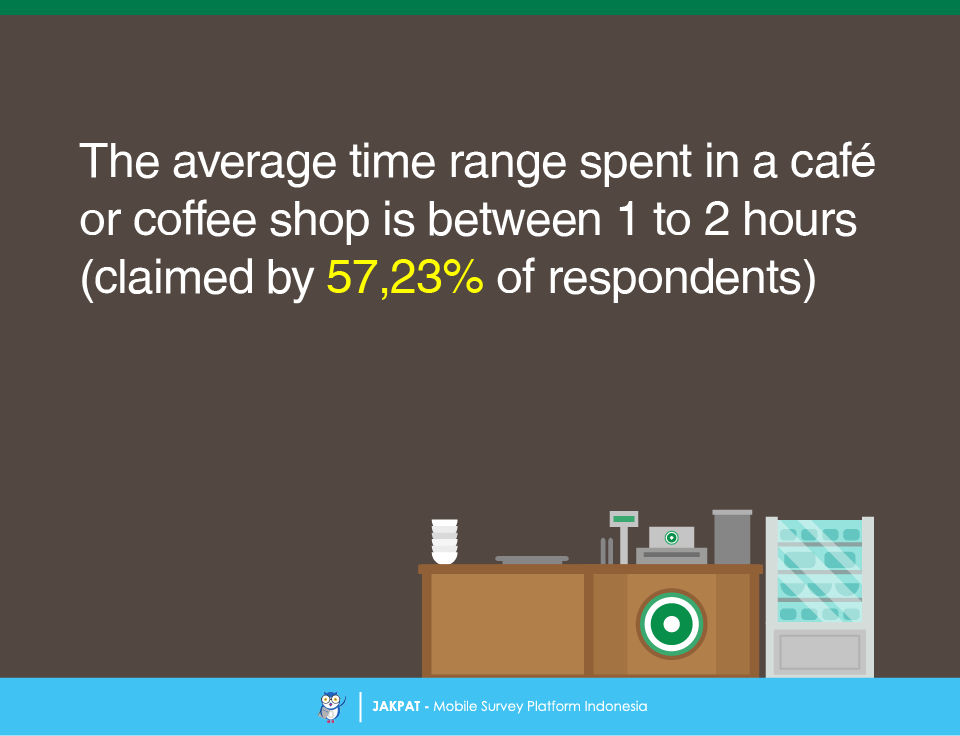
It can take hours to spend in a café especially when the moment with the friends is too fun to end. But do the majority of the respondents spend so many hours in a café? We found that the average time range spent in a café is between 1 to 2 hours, according to 57,23% of respondents.
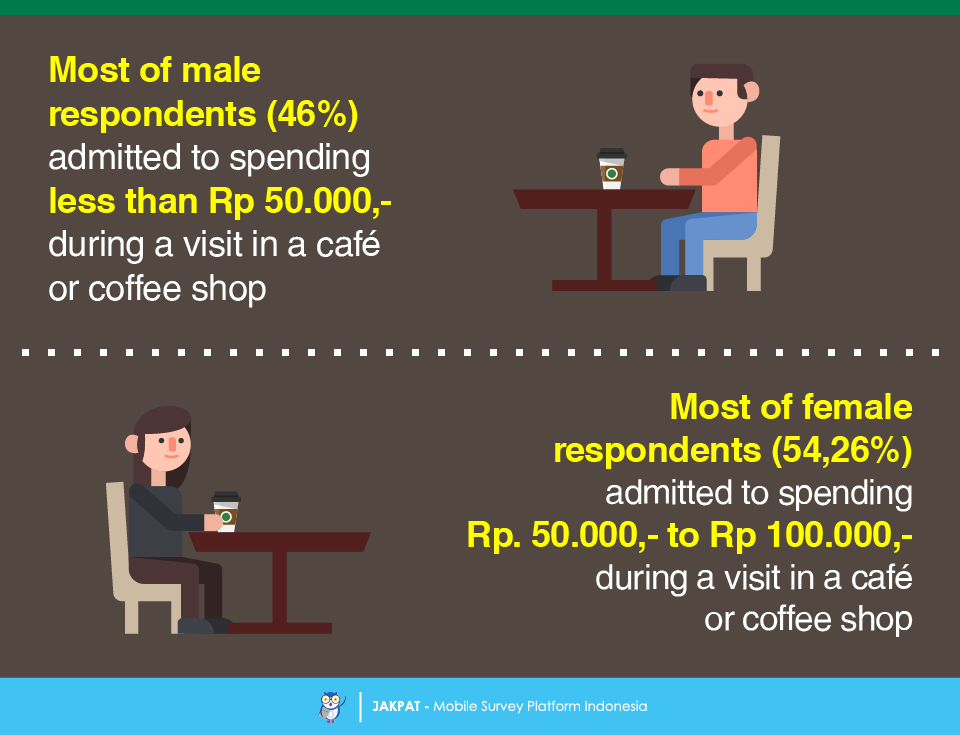
How about the money spent? Interestingly, as we went through the survey result, male and female respondents are in fact spending averagely a different amount of money during one visit in a café. The male respondents (46%) admitted to spending less than Rp 50.000,- per visit. While the female group (54,26%) admitted to spending between Rp 50.000,- and Rp 100.000,- per visit.
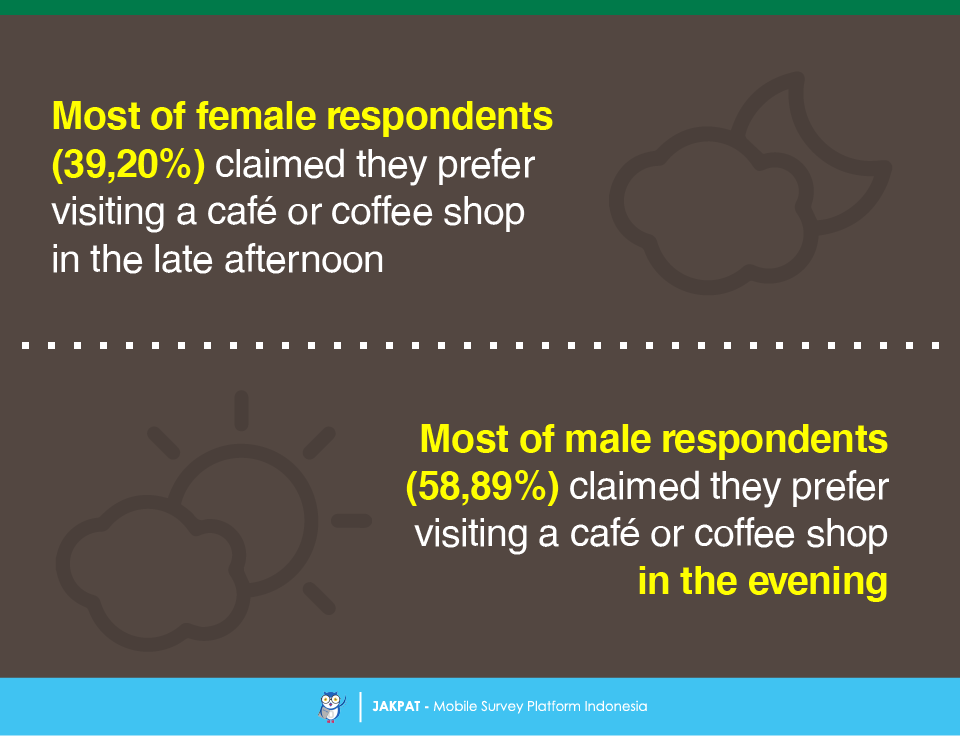
Another different finding caused by different genders is about when the respondents visit a café. Our female respondents (39,20%) claimed that they visit a café in the late afternoon. That is between 3 – 6 PM. Meanwhile, our male respondents (58,89%) claimed to preferring visiting a café in the evening (after 6 PM).
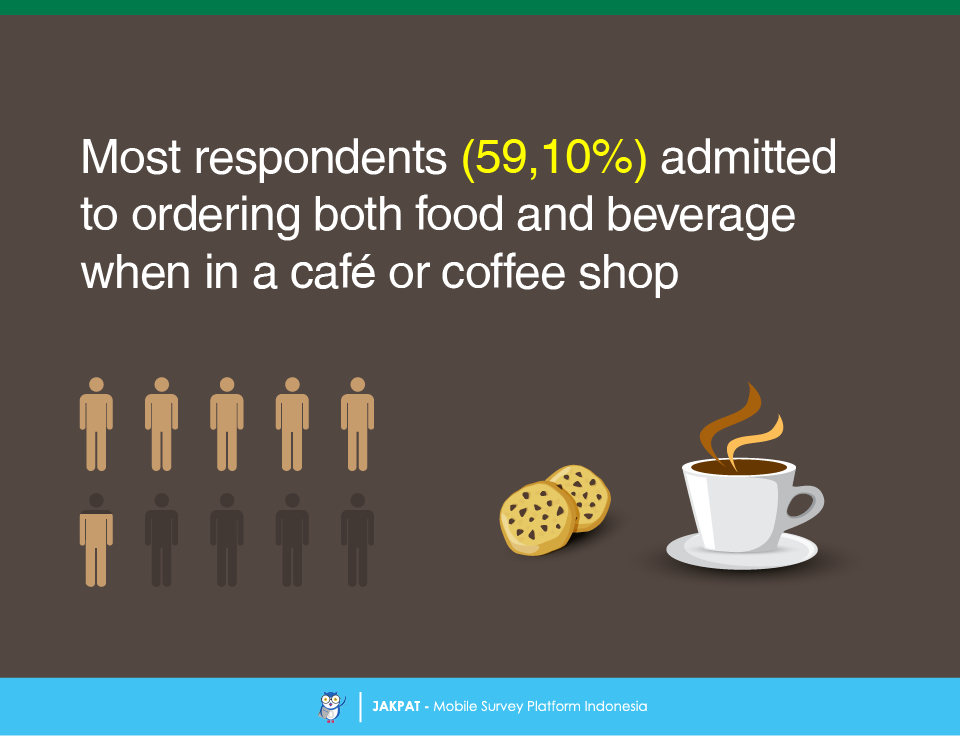
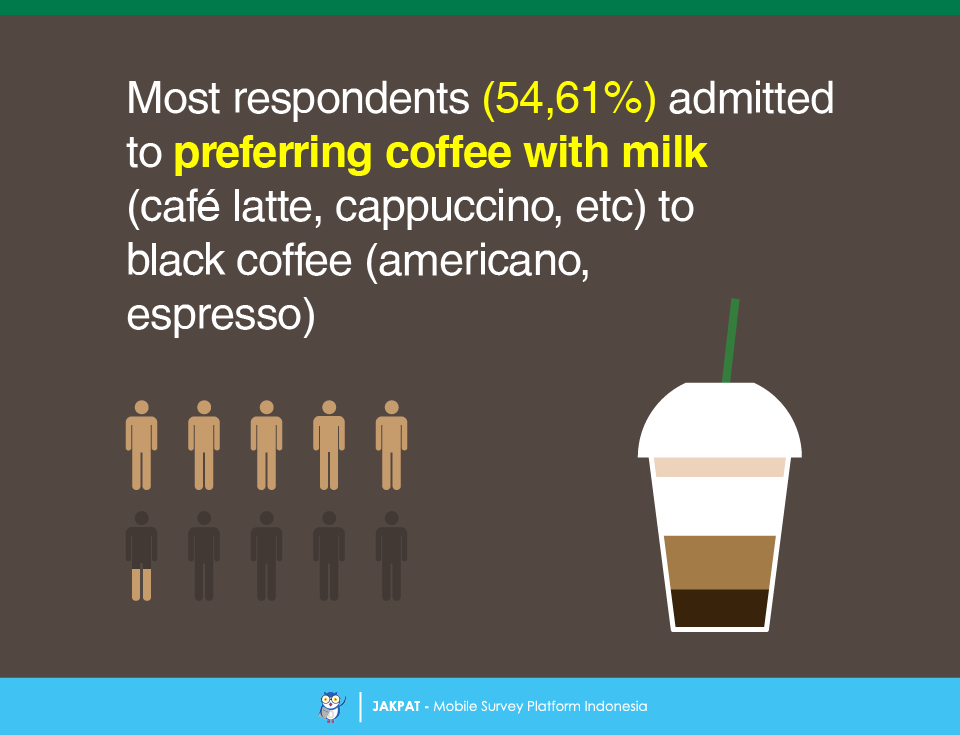
When asked what is ordered during the time in a café, most respondents (59,10%) admitted at average that they order both food and beverage at the same time, as opposed to ordering food or beverage only. And when asked more specifically about what kind of coffee they most often order, 54,61% respondents said they prefer coffee with milk to black coffee.
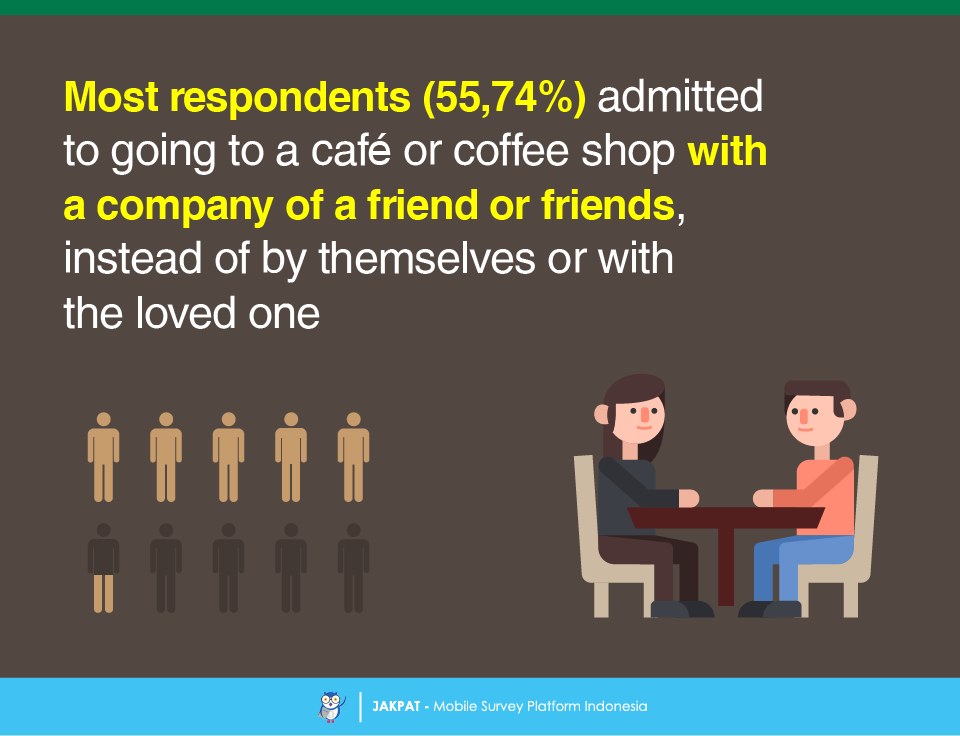
Our finding shows that it seems to be common that having a relaxing time in a café does not have to be done alone or even with the loved one because 55,74% of our respondents admitted that they visit a café with a company of a friend or friends. Only a small number of people chose the option of doing it by themselves or alone (6,86%) and with the loved one (13,47%). To us it was an interesting finding because we might want to know if not to a café, where they would spend a quality time with the loved one or by themselves.
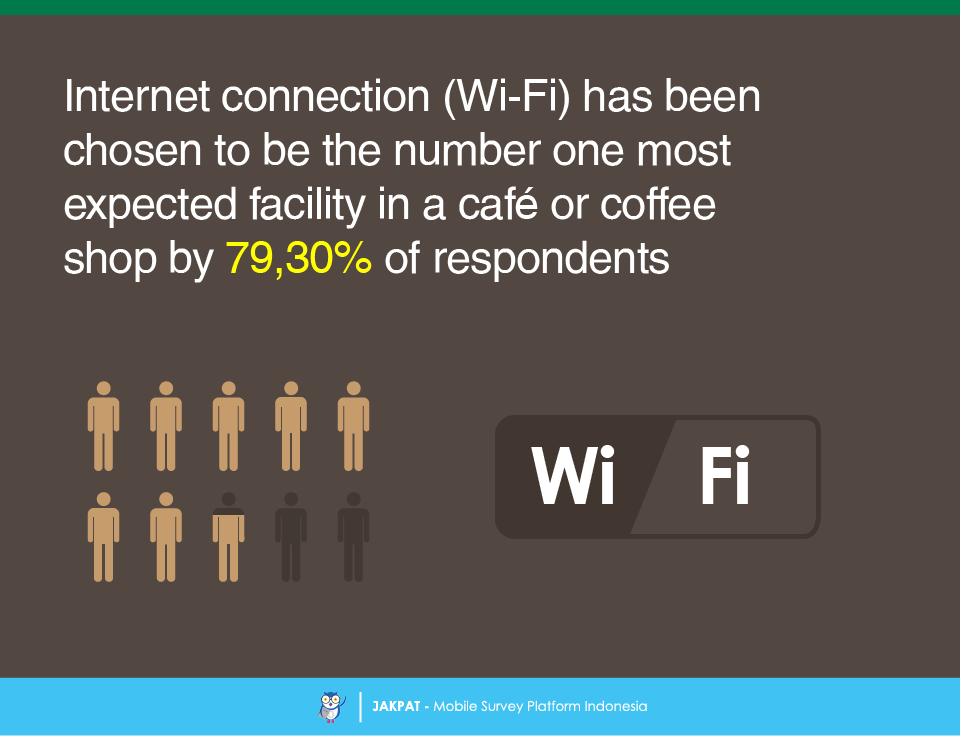
Of a list of facilities commonly found in a café, the availability of the Internet connection sits at number one top most expected by 79,30% of the respondents when they are spending time in a café. The second most expected by 45,39% of the respondents is the air conditioner.
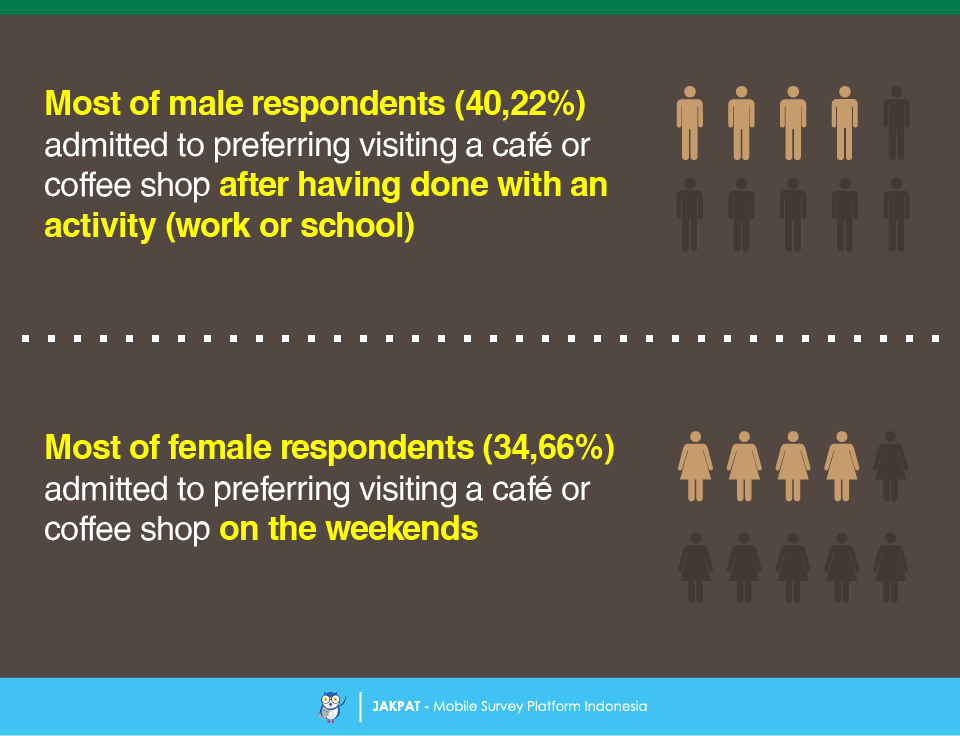
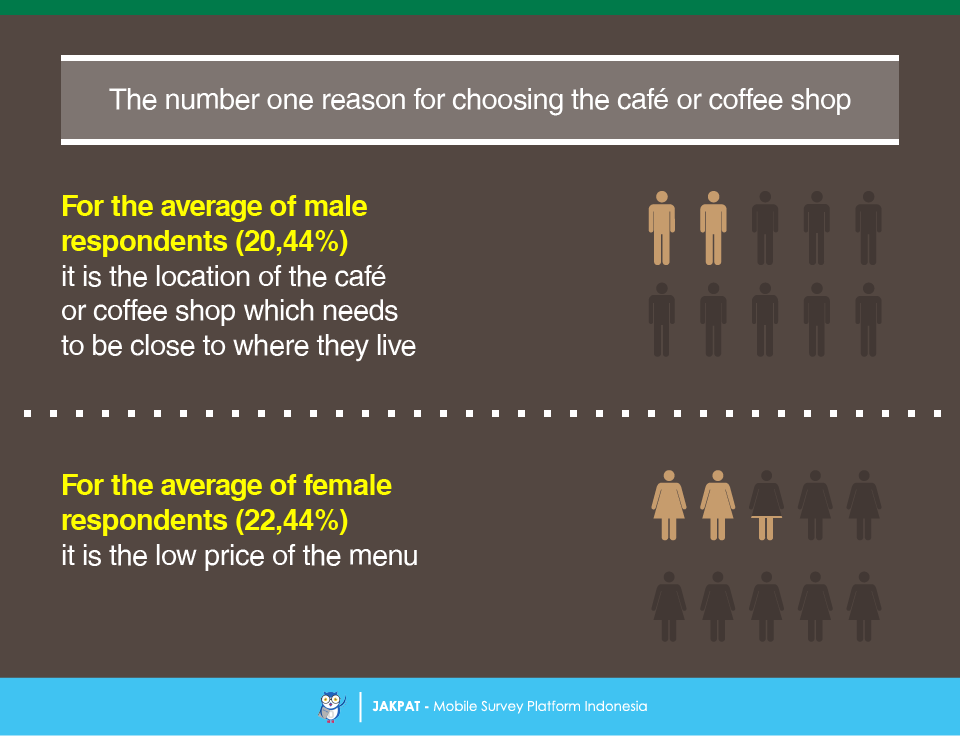
The average 40,22% of male respondents admitted that they tend to visit a café after having done with an activity. It is either after work or school. And, in addition to that, 20,44% of the male respondents tend to choose a café based on its location, which is preferably closer to where they live. Meanwhile, the average 34,66% of female respondents have a tendency of going to a café on the weekends and the choice of the café is based on the price of the menu –the lower, the more preferable.
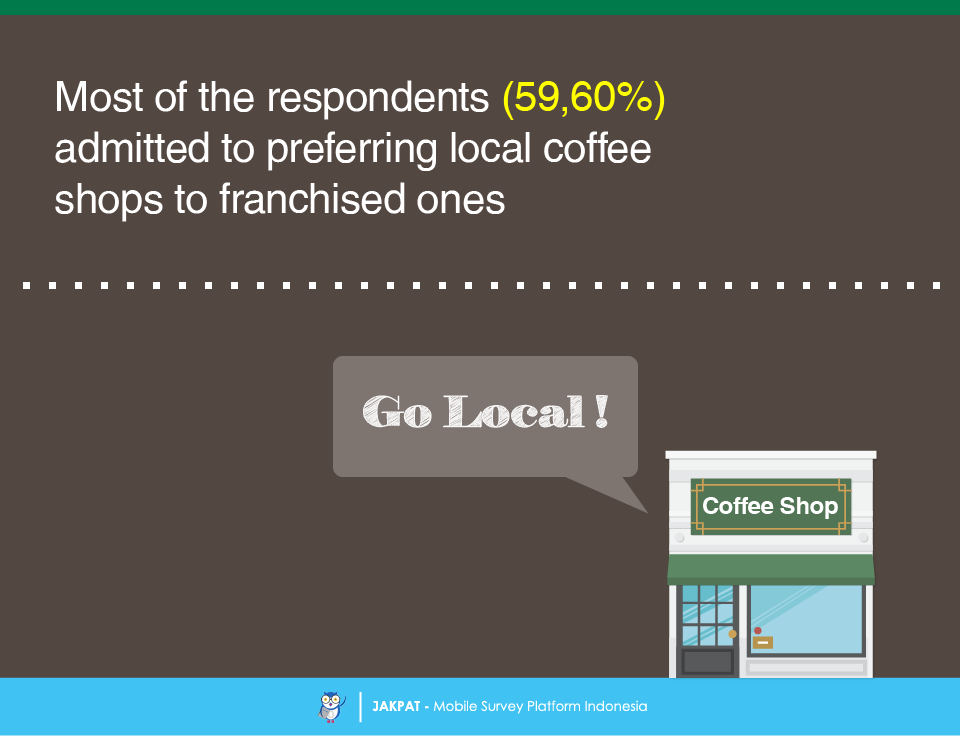
Local cafés or coffee shops are following the trend through their existence. Opposed to franchised cafés like Starbucks and Coffee Bean, majority of the respondents (59,60%) said that they preferred going to local cafés or coffee shops. That might be a sign of why the menu price seems to be an important aspect since franchised cafés are known to offer high prices in their menu.
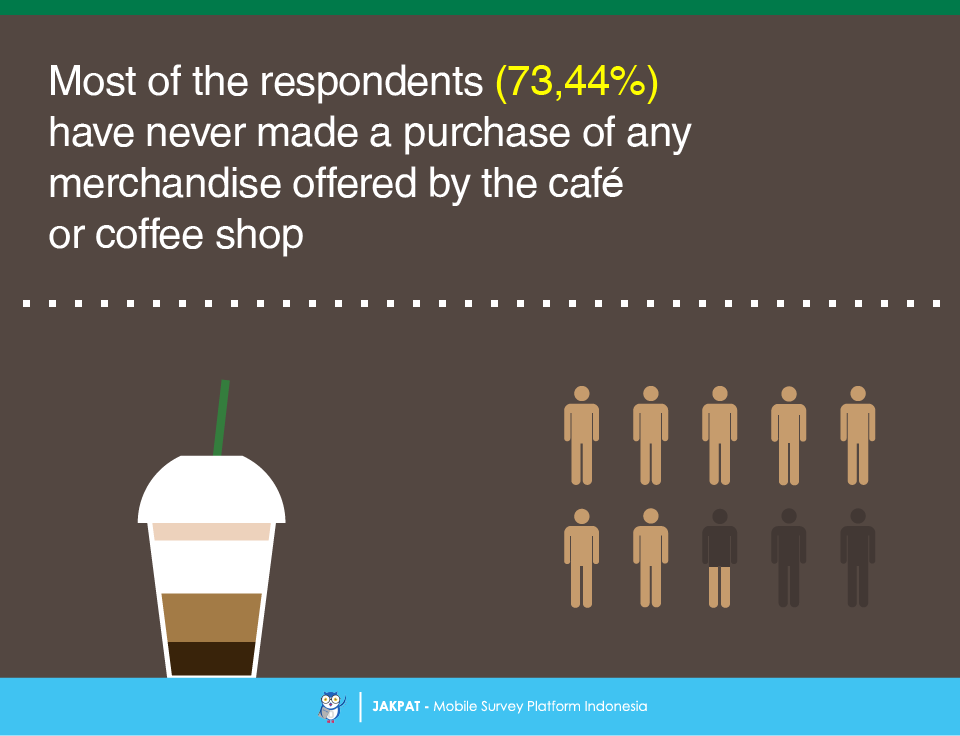
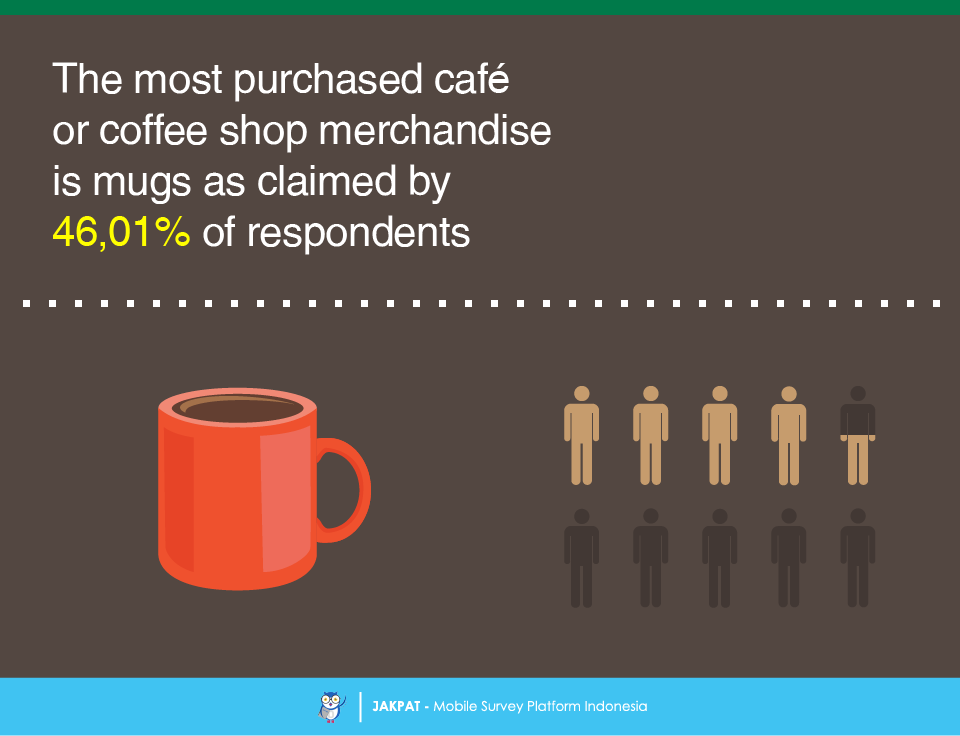
Lastly, we asked about whether the respondents have made a purchase of any merchandise normally offered on display by a café. We found that 73,44% of the respondents said they have never made such a purchase. But, for those who have, mugs merchandise sits at number one being the favorite café merchandise, as claimed by 46,01% of the respondents.
For more detail you can download XLS report at the button below (bahasa). JAKPAT report consists of 3 parts which are 1) Respondent Profile, 2) Crosstabulation for each question and 3) Raw Data. Respondent profile shows you demographic profiles ( gender,age range, location by province, and monthly spending). Cross tabulation enables you to define different demographic segment preference on each answer.
![]()
You can also download PDF here:
![]()

or Get A Sales Quote by filling this form or Call to +622745015293
