

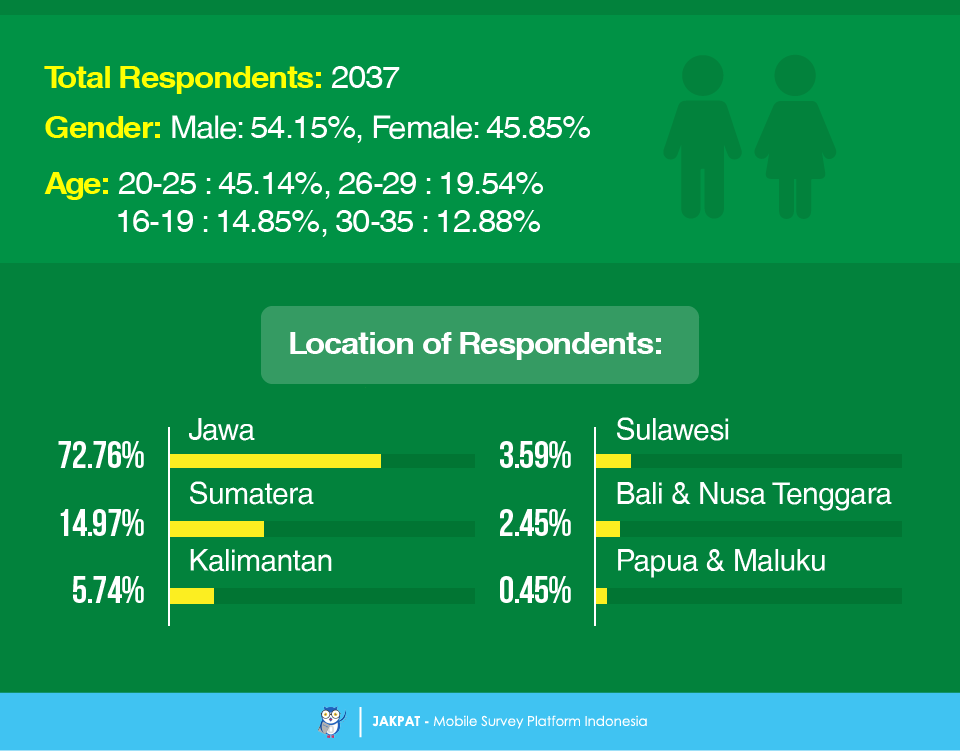
There are many banking services or companies that offer different programs to people who are looking to keep their money and trust in them. Choosing from the many choices that are out there can be a challenge. Therefore through this survey we would like to deliver information about favorite national banking services, reasons for the choice, and some other related details. We managed to ask as many as 2037 respondents throughout Indonesia. Of those respondents, we have 1103 male respondents and 934 female respondents, mostly in the age range of 20-25 (45.14%) and mostly located in East Java (26.07%). Such information only shows the majority of the respondents who answered this survey, without underestimating other groups of respondents from other age ranges or locations.
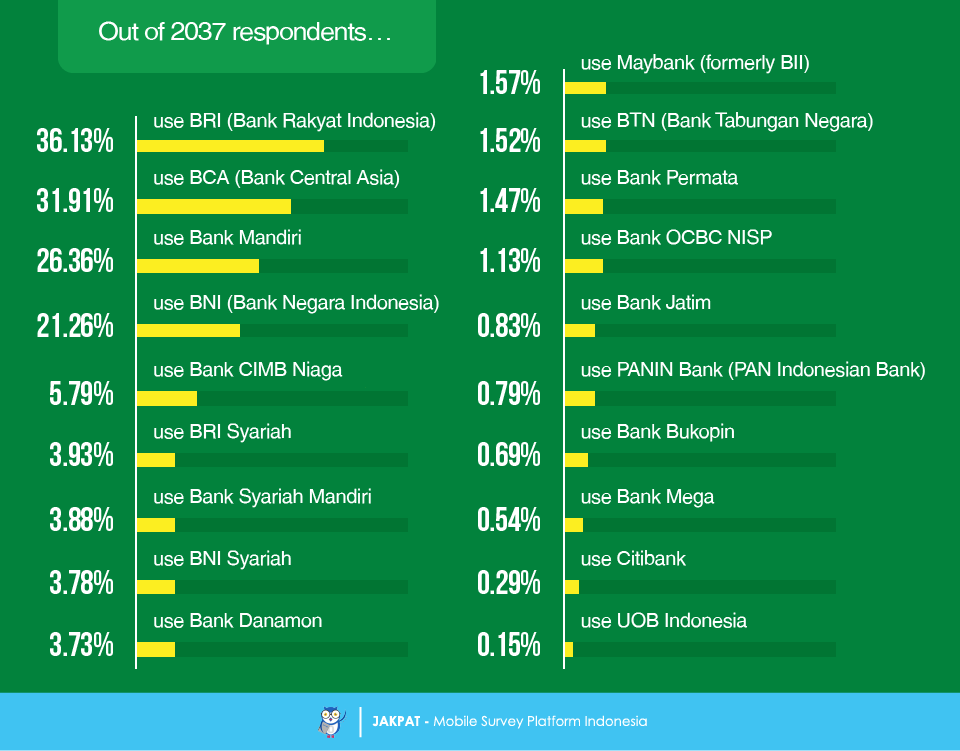
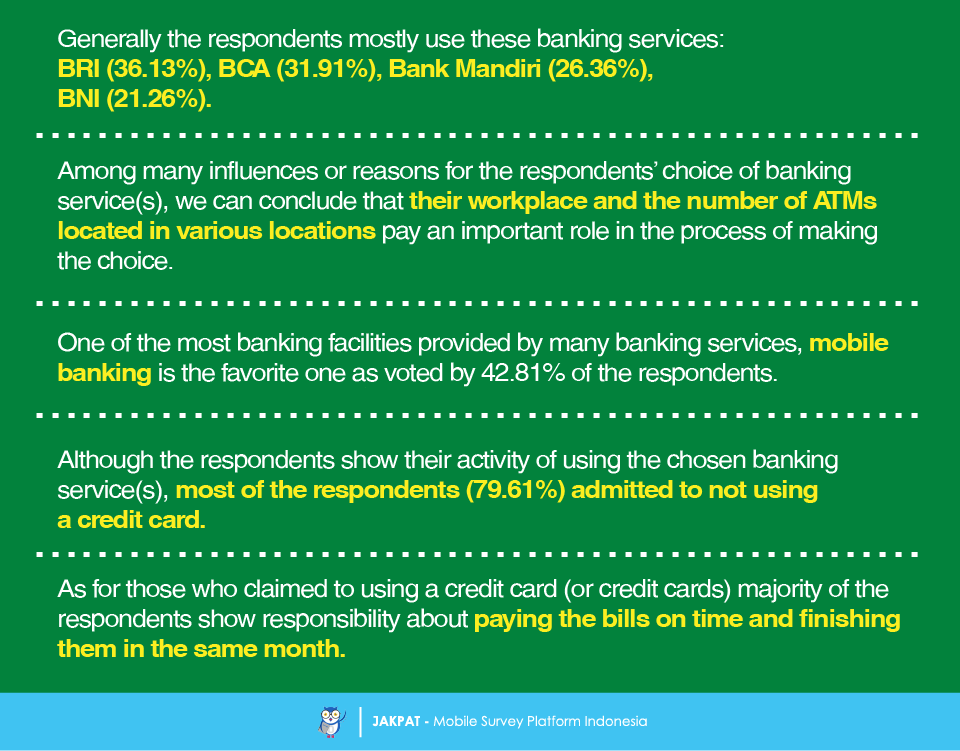
We tried to include most banking services or companies in Indonesia and asked our respondents which ones they use. From being most popular to being less popular, here is the finding: BRI (36.13%), BCA (31.91%), Bank Mandiri (26.36%), BNI (21.26%), Bank CIMB Niaga (5.79%), BRI Syariah (3.93%), Bank Syariah Mandiri (3.88%), BNI Syariah (3.78%), Bank Danamon (3.73%), Maybank (1.57%), BTN (1.52%), Bank Permata (1.47%), Bank OCBC NISP (1.13%), Bank Jatim (0.83%), PANIN Bank (0.79%), Bank Bukopin (0.69%), Bank Mega (0.54%), Citibank (0.29%), and UOB Indonesia (0.15%).
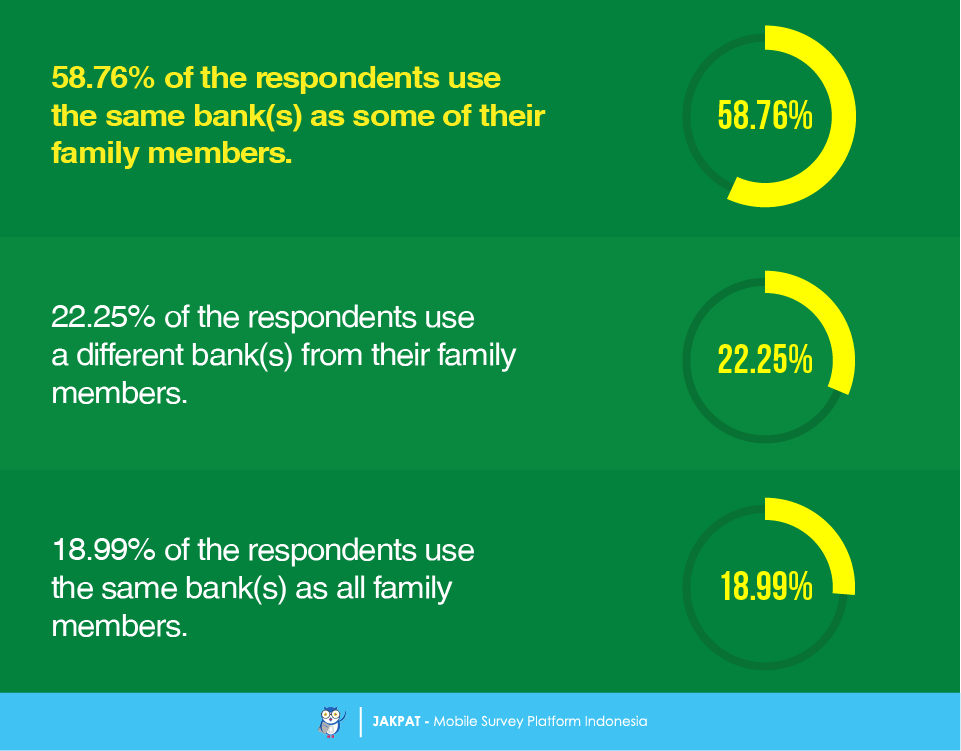
Sometimes our choice of using a certain banking service is influenced by what some our family members use. This survey supports that idea. As many as 58.76% of the respondents use the same bank(s) as some of their family members. Only 22.25% of the respondents use a different banking service.
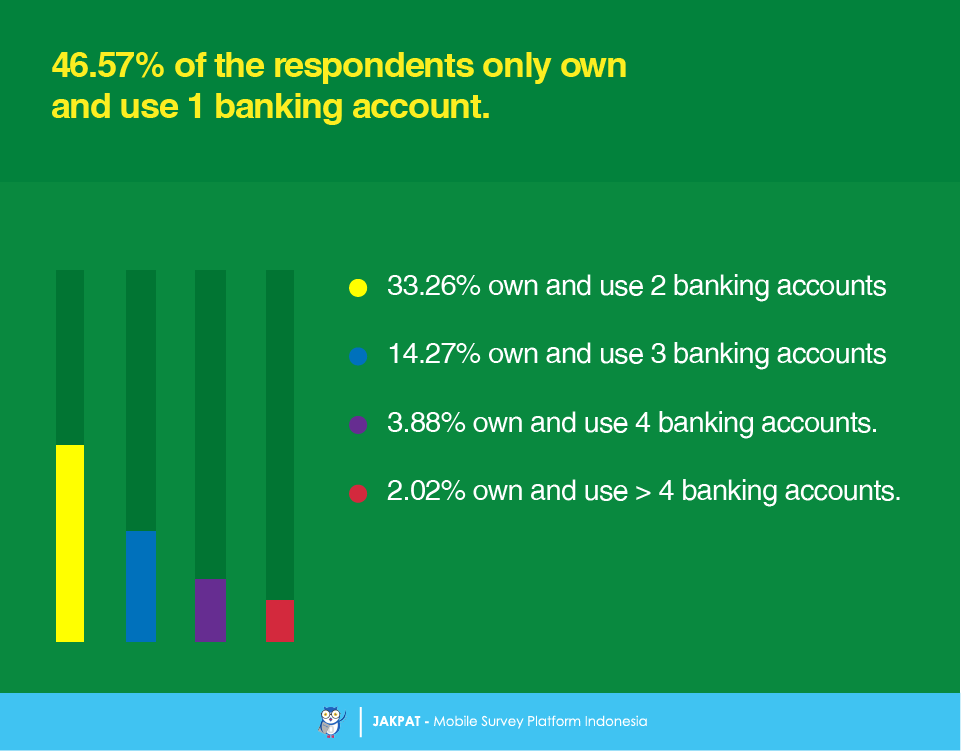
It is not a strange thing for someone to have and actively use more than one banking accounts. However, we found that 46.57% of the respondents only own and use one banking account. Here are our findings for those who use more than one banking accounts: using two banking accounts (33.26%), using three banking accounts (14.27%), using four banking accounts (3.88%), and using more than four accounts (2.02%).
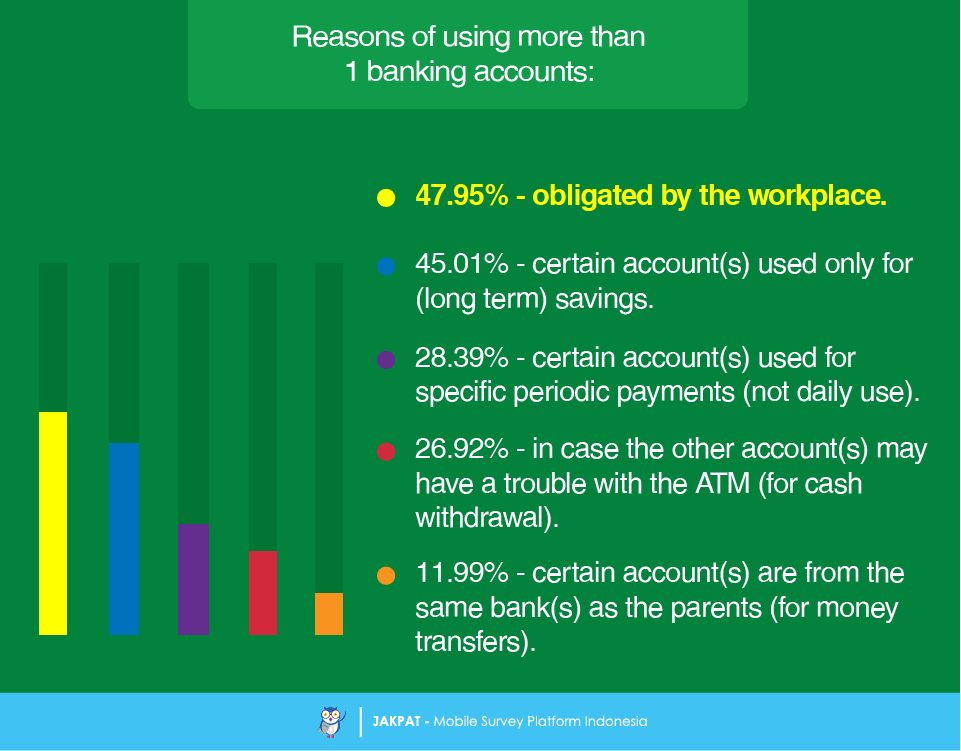
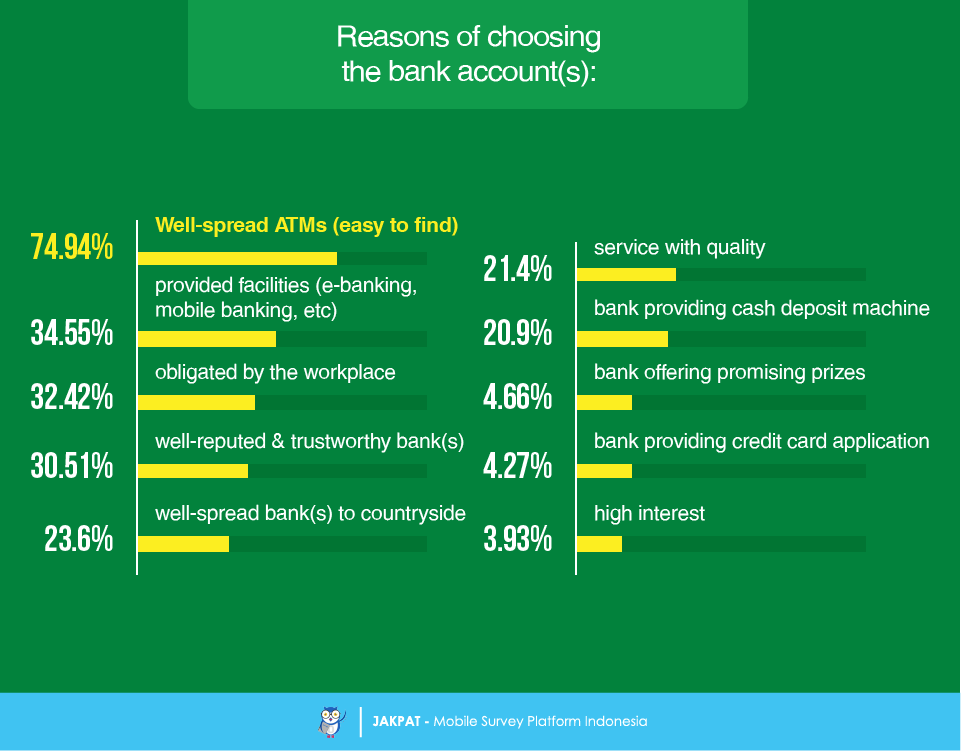
We then asked our respondents who claimed to having and using more than one banking accounts, about their reasons. We found an interesting finding. Majority of the answers said that 74.94% of the respondents think that ATMs need to be found easily and well spread in many areas. Other influential aspects include provided facilities (34.55%) such as e-banking and mobile banking, obligation from the workplace (32.42%), reputation of the banking company (30.51%), easy-to-find banking centers in countryside (23.6%), quality of the service (21.4%), bank providing cash deposit machine (20.9%), promising prizes (4.66%), credit card application (4.27%), and interest rate (3.93%).
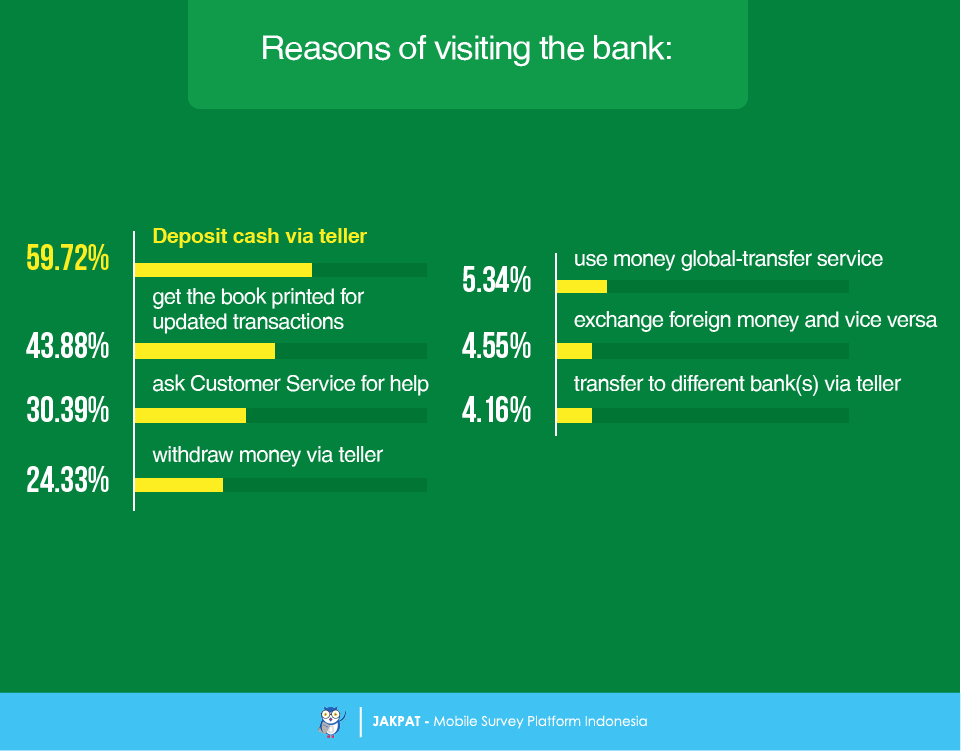
We were curious what our respondents do when visiting a bank. The top answer to the reason of the visit is to deposit cash via teller in the bank (59.72%). Here are some other reasons: to get the book printed for updated transactions (43.88%), to ask Customer Service for help (30.39%), to withdraw cash via teller (24.33%), to use money global-transfer service (5.34%), to exchange foreign money and vice versa (4.55%), and to transfer money to a different bank via teller (4.16%).
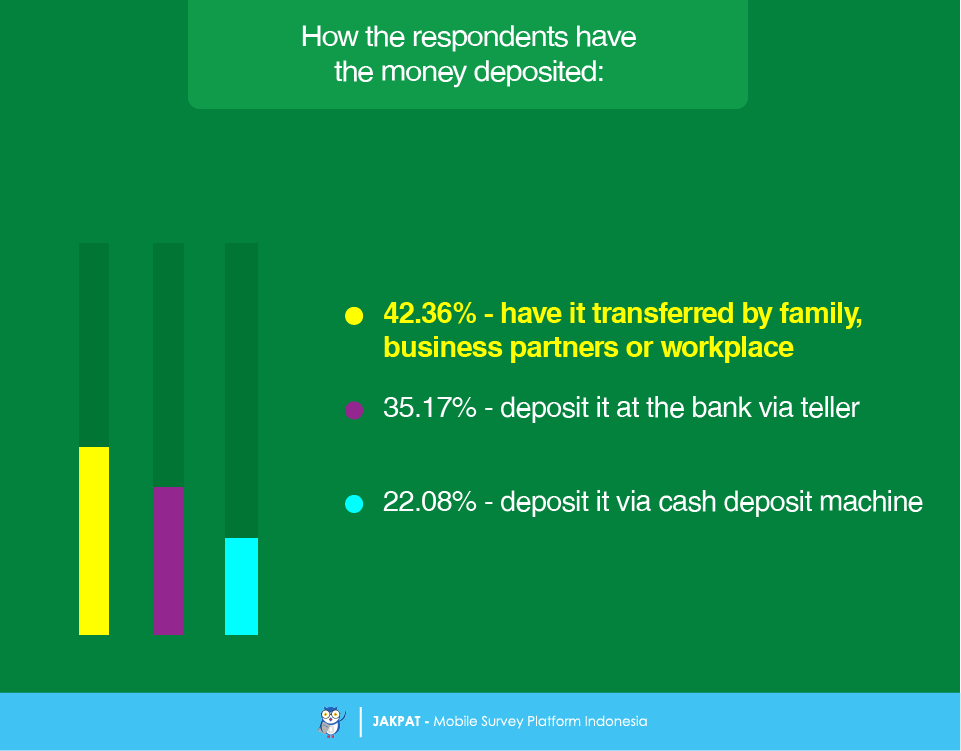
How do our respondents get the money deposited to their banking account? We found that 42.36% of the respondents claimed to have the money deposited by their family, business partners or workplace by transferring it. Other means include depositing the money via a teller in the bank (35.17%), and depositing the money using a cash deposit machine (22.08%).
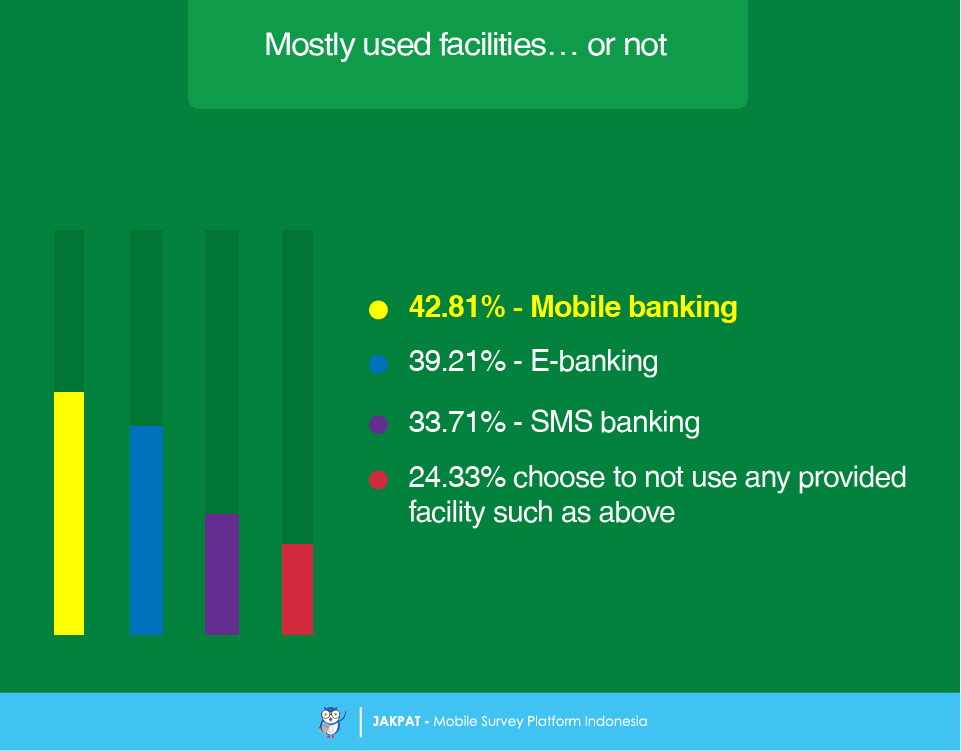
To do a banking transaction we do not always need to go to a bank. We can do it from our hand using a phone. In the context of such facilities, 42.81% of the respondents claimed to like using mobile banking the most. 39.21% use e-banking service. Then 33.71% use SMS banking service. However, there are as many as 24.33% of the respondents who admitted to not using any provided facility such as mentioned above.
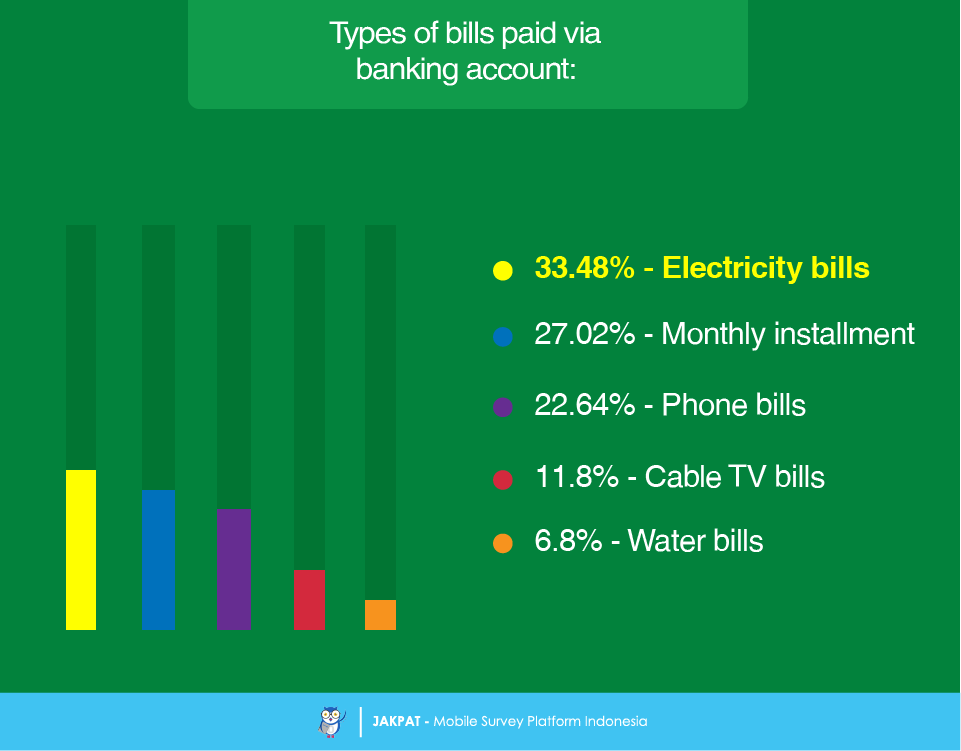
Sometimes we use our banking account to pay the bills. The number one type of bills to pay using a banking account is electricity (33.48%). Following that are monthly installment (27.02%), phone bills (22.64%), cable TV (11.8%), and water bills (6.8%).
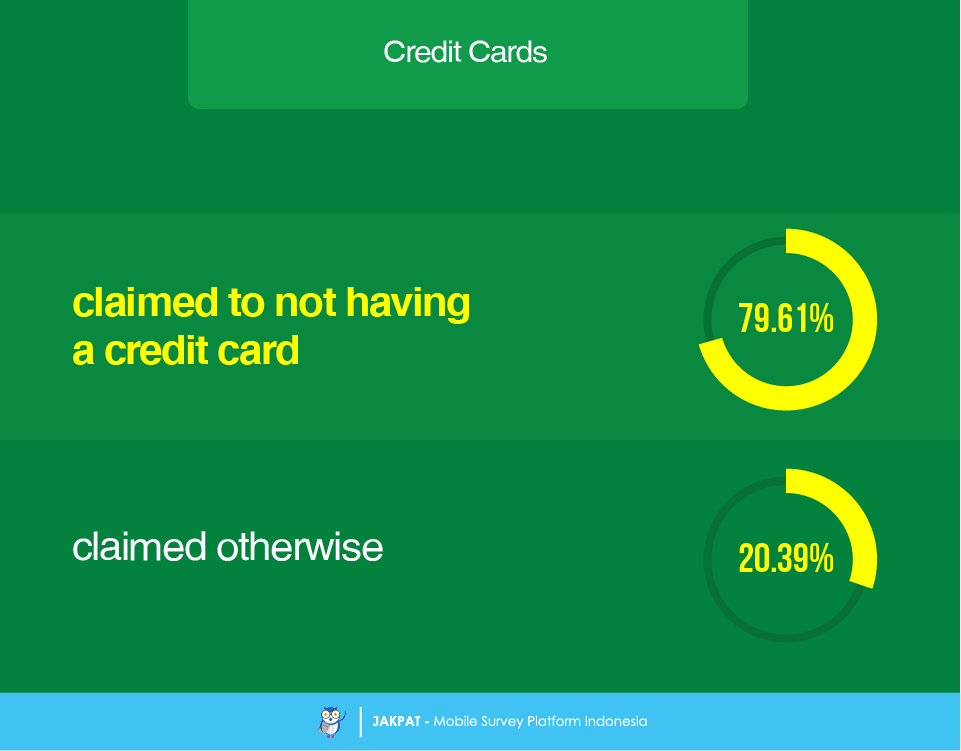
Our next step in the survey was asking our respondents about whether they use a credit card. 79.61% said that they do not have use a credit card. We then focused on those who use a credit card (20.39%).
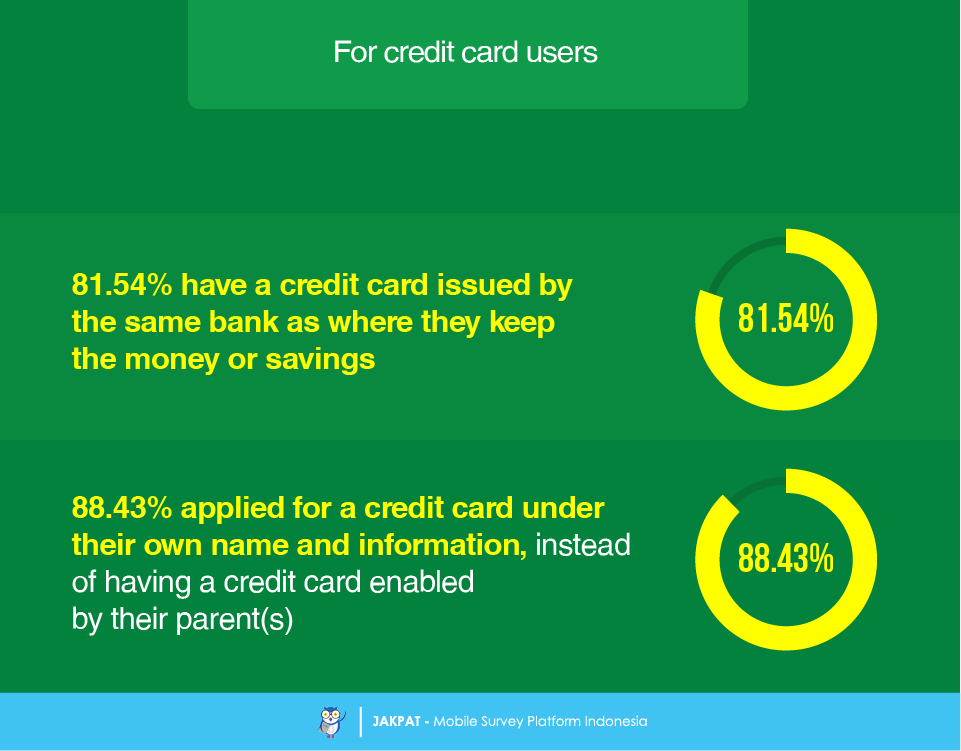
For the respondents admitting to using a credit card, 81.54% of them use a credit card that is issued by the same bank as where they keep their money or savings. And, 88.43% of them applied for a credit card in the first place under their own name and information, instead of being enabled by their parent(s).
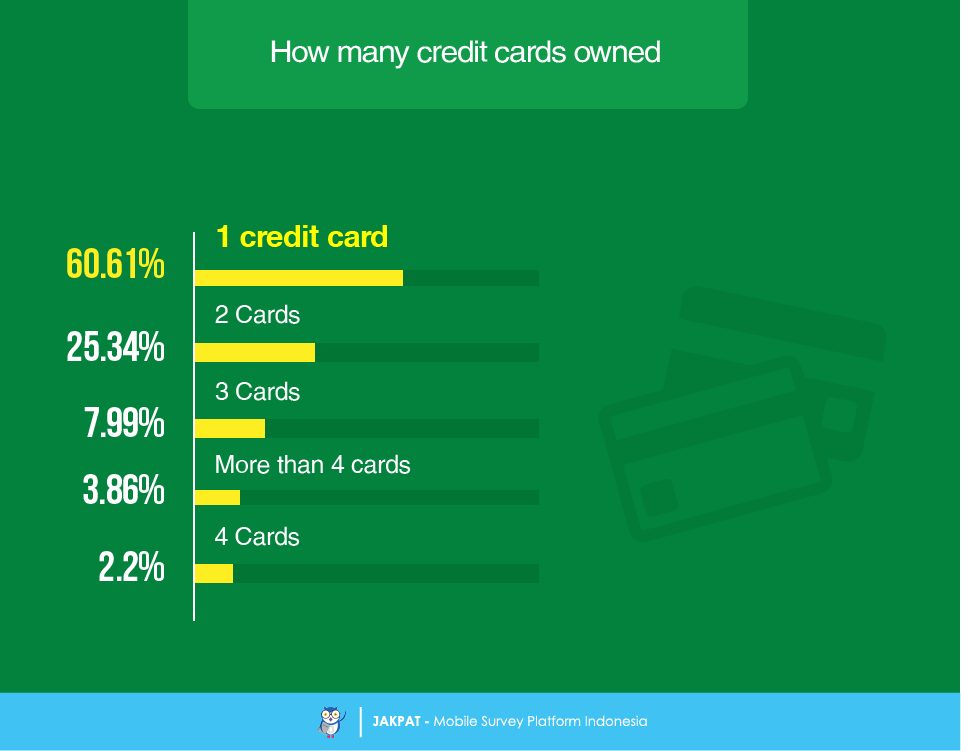
Most of the credit card owning respondents only use one credit card (60.61%). 25.34% use two credit cards. 7.99% use three credit cards. 3.86% use more than four credit cards. Lastly, only 2.2% use four credit cards.
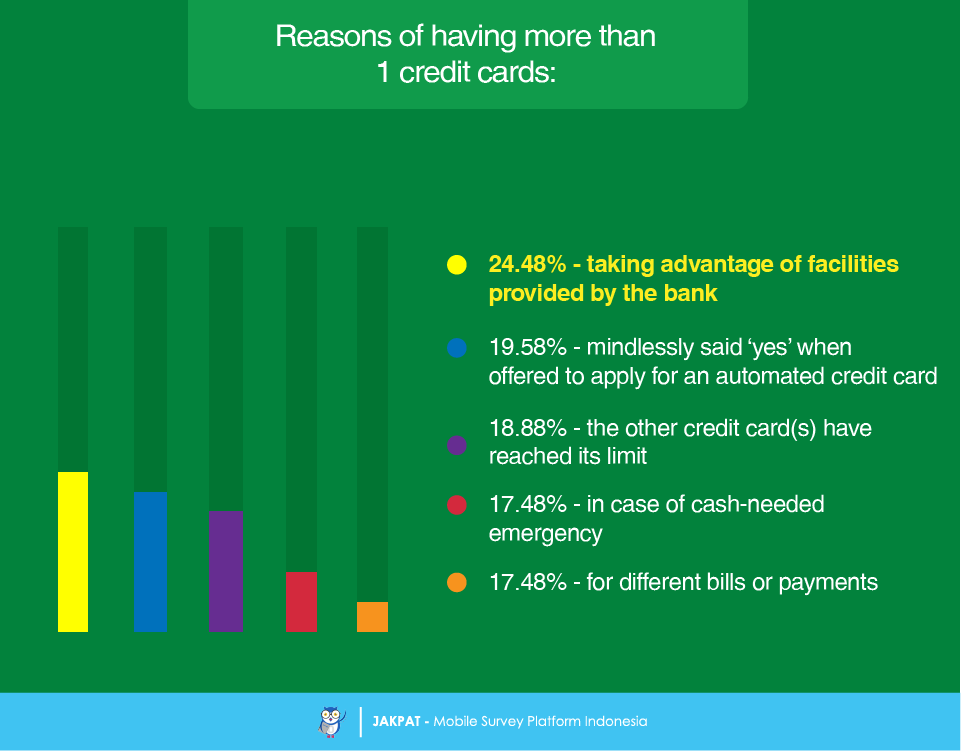
We then went deeper with the question especially for those who admitted to having more than one credit card. The number one reason is to take advantage of the facilities that are provided and offered by the bank services (24.48%). 19.58% admitted to using more than one card because they mindlessly said ‘yes’ when offered to apply for a credit card. 18.88% admitted that they need a new credit card because the other card has reached its limit. 17.48% admitted that they might need cash in an emergency situation. Lastly, 17.48% admitted that they needed to pay different bills or payments using a different card (or cards).
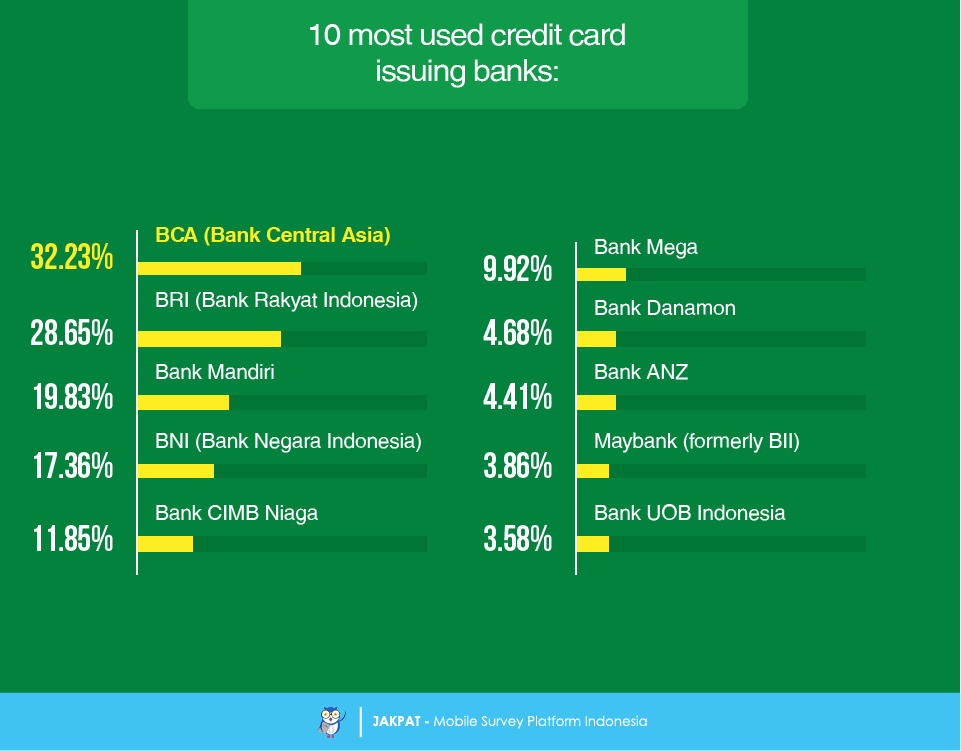
In the beginning we talked about top most used banking services for keeping their money. This time we asked our respondents with a credit card which banking services they use. BCA sits on the top of the favorite ranking, as voted by 32.23%. Following BCA are BRI (28.65%), Bank Mandiri (19.83%), BNI (17.36%), Bank CIMB Niaga (11.85%), Bank Mega (9.92%), Bank Danamon (4.68%), Bank ANZ (4.41%), Maybank (3.86%), and Bank UOB Indonesia (3.58%).
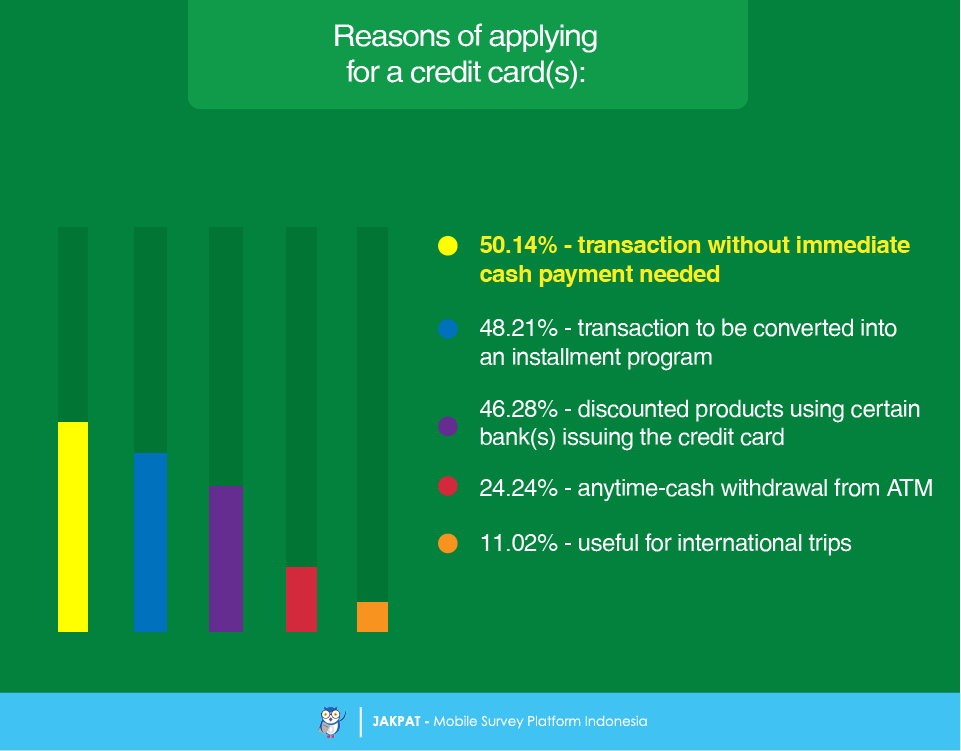
Why do our respondents need a credit card? Here is the top answer to that: 50.14% admitted that they could pay a transaction without using cash. Other answers include: transaction can be converted into an installment program (48.21%), products come discounted using certain banks that issue the credit card (46.28%), cash can be withdrew from the ATM (24.24%), and a credit card can be useful on international trips (11.02%).
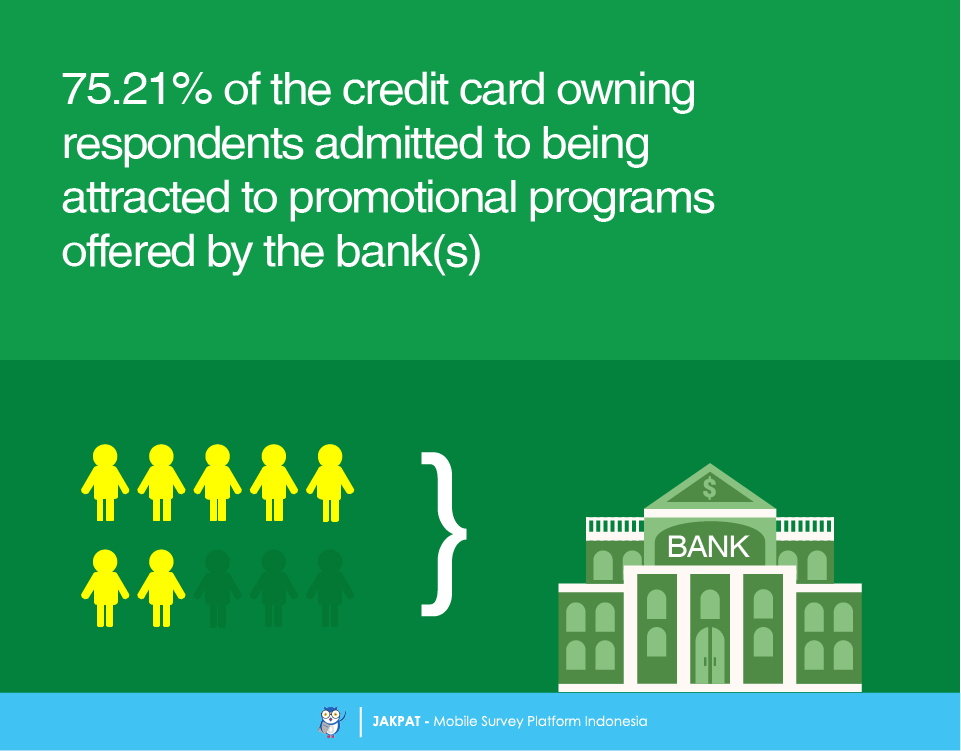
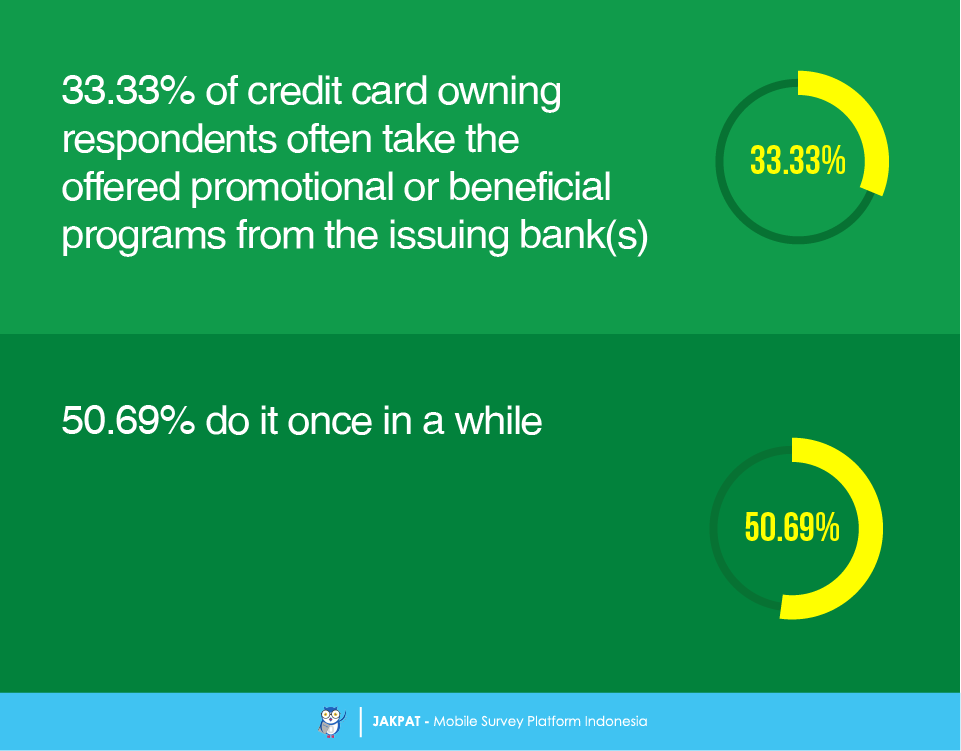
As much as we might think that there are too much information about promotional programs offered by banking services issuing credit cards, we found that 75.21% of the respondents admitted to being attracted to such promotional programs. And, out of that interest or attraction, 33.33% of the respondents often take or use the offered promos.
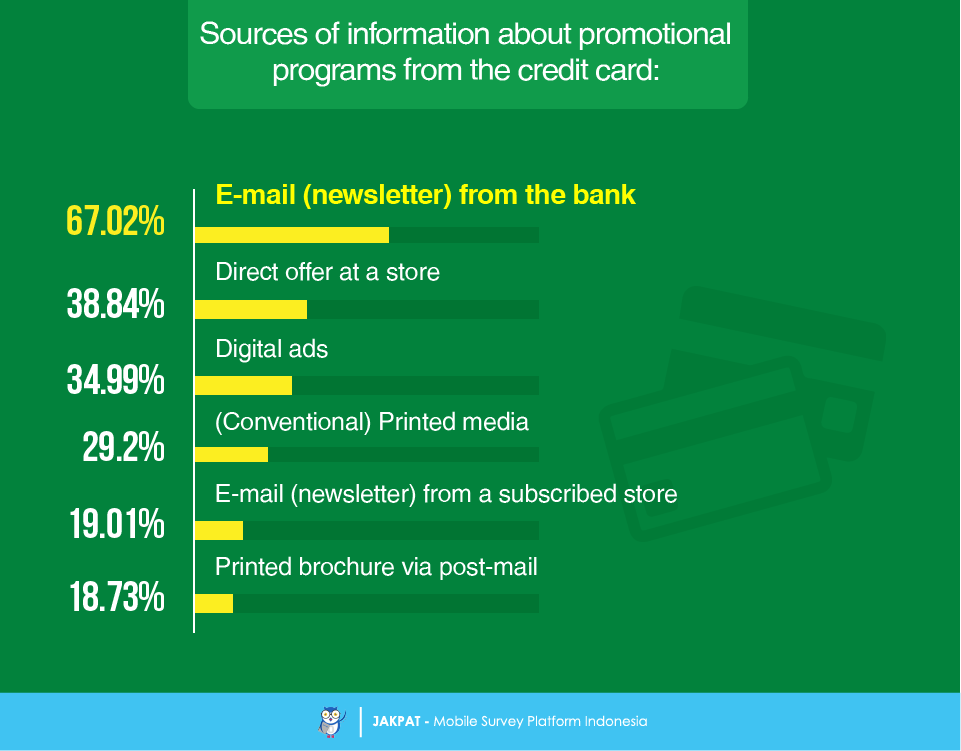
Speaking of promos, we wanted to know how our respondents knew about them. E-mail through newsletter sent by the banking company is the number one source of promos information (67.02%). Other sources include direct offers at a store (38.84%), digital ads (34.99%), printed media (29.2%), e-mail through newsletter sent by a subscribed store (19.01%), and printed brochure sent via post mail (18.73%).
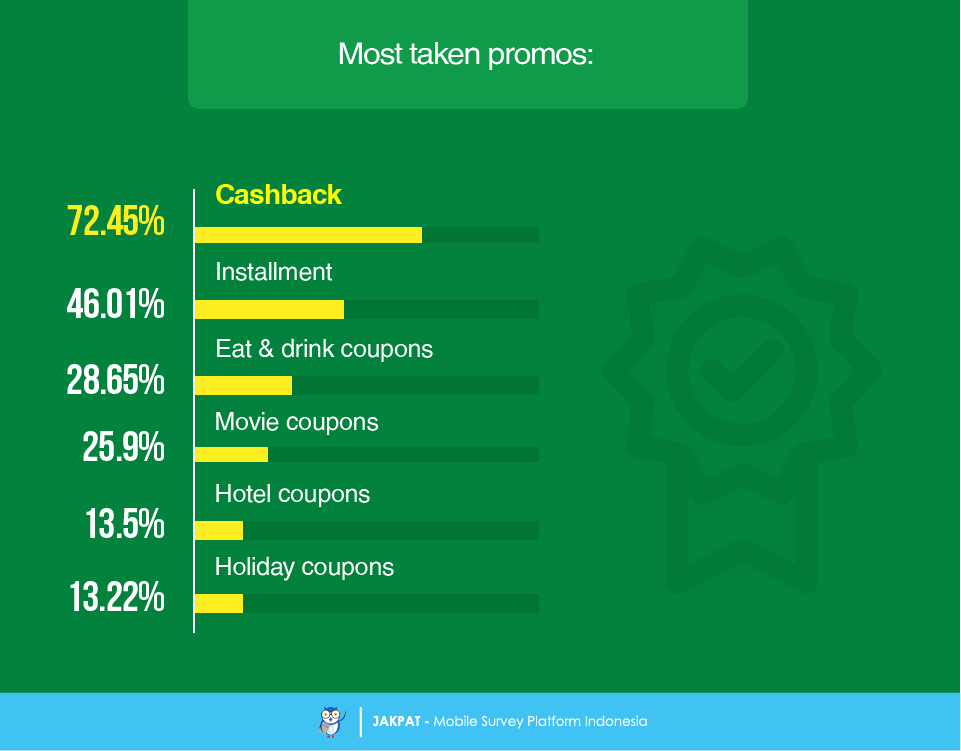
Out of many promos offered out there, we found that cash back program is the number one favorite program (72.45%). Following that here are other promos ordered by how they are preferred by our respondents: installment program (46.01%), eat and drink coupons (28.65%), movie coupons (25.9%), hotel coupons (13.5%), and holiday coupons (13.22%).
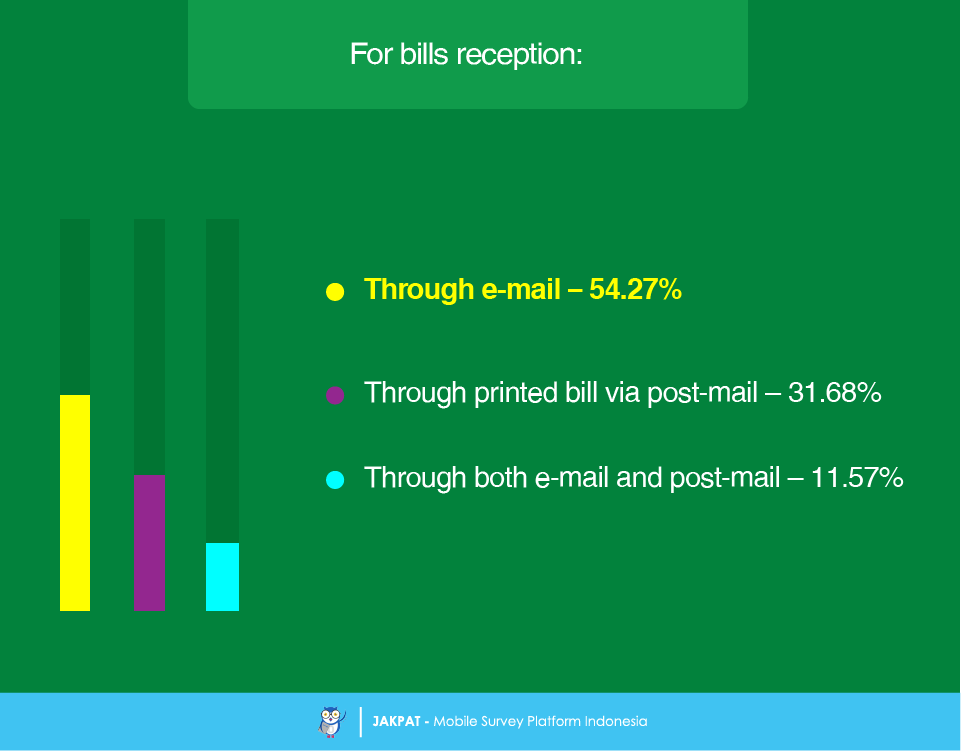
How do our respondents receive their bills? We found out that 54.27% of the respondents claimed that they receive the bills through e-mail service. 31.68% receive them through post mail. And, 11.57% receive their bills through both e-mail and post mail.
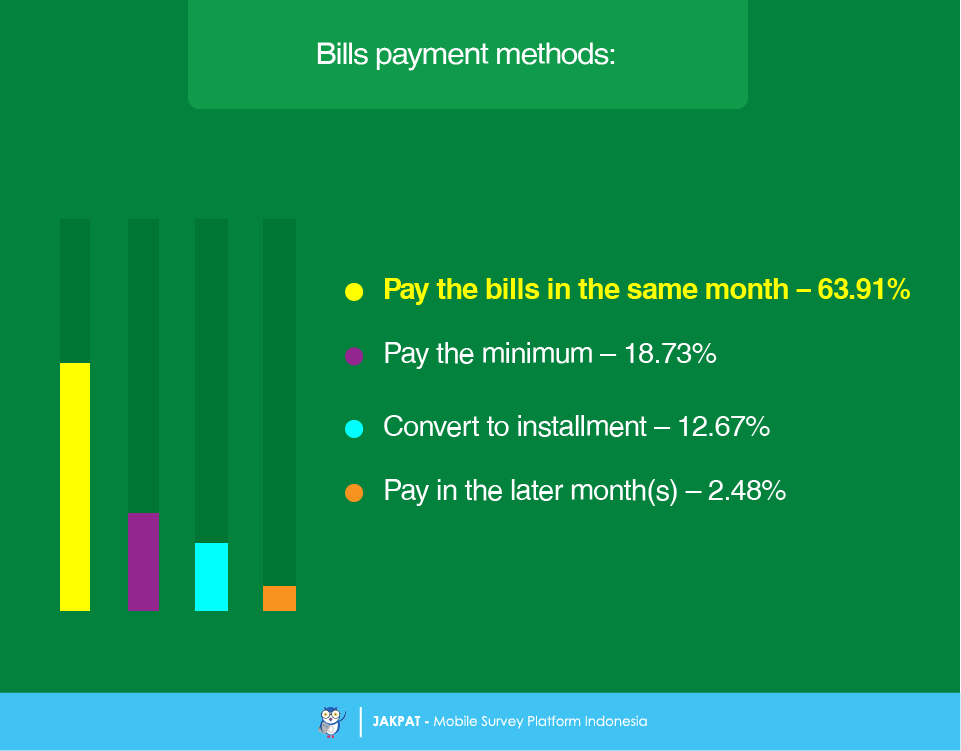
We then wanted to know the habit of our respondents when they pay their credit card bills. Most of our respondents (63.91%) admitted that they pay the bills in the same month as when they used the credit card. 18.73% pay the minimum. 12.67% convert their usage into installment. And, only 2.48% pay the bills in the later month(s). We are glad that our findings show a healthy habit of credit card usage.
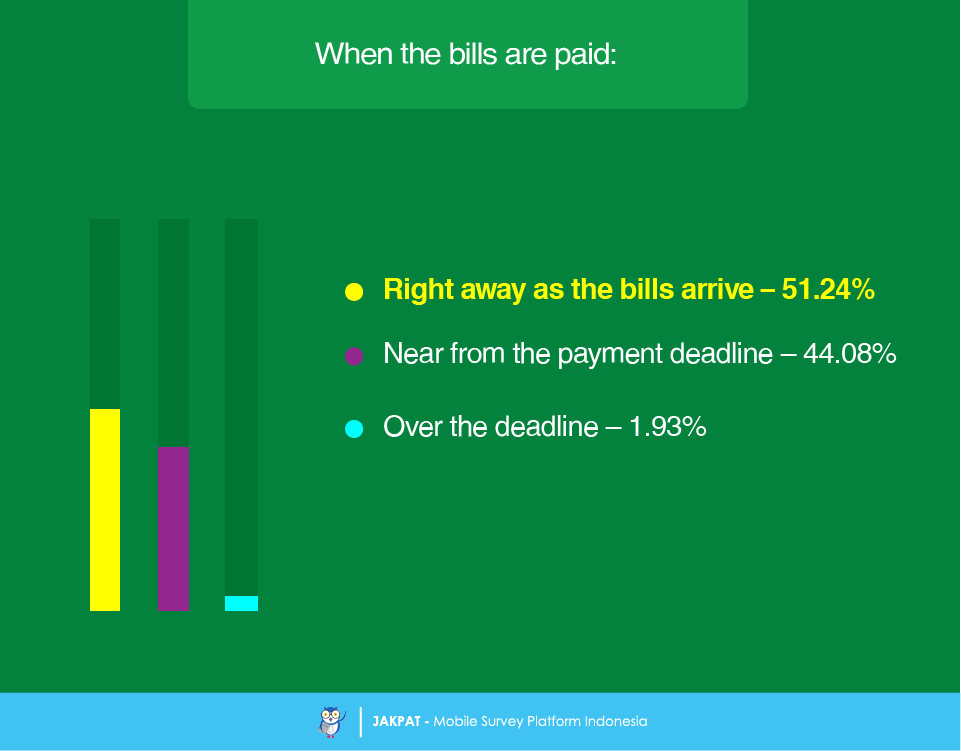
Next and last question was when our respondents pay the bills. It is also good news as in a healthy indication of credit card usage. Most of our respondents using a credit card admitted that they pay the bills right away when they arrive at them. 44.08% pay the bills near the payment deadline. And, only 1.93% pay the bills over the deadline.
For more detail you can download XLS report at the button below (bahasa). JAKPAT report consists of 3 parts which are 1) Respondent Profile, 2) Crosstabulation for each question and 3) Raw Data. Respondent profile shows you demographic profiles ( gender,age range, location by province, and monthly spending). Cross tabulation enables you to define different demographic segment preference on each answer.
![]()
You can also download PDF here:
![]()

or Get A Sales Quote by filling this form or Call to +622745015293
