


Indonesia has several universities and their equivalent, consisting of universities, vocational studies, polytechnics and academies in different provinces. Based on information gathered from dikti.go.id, total university and its equivalent in Indonesia are 4,265 universities, including private or state owned universities. This fact shows us that Indonesia also has a large number of college students. In DKI Jakarta, for example, there are 803,225 active college students, in which only 310 universities and their equivalent are located in DKI Jakarta. Thus, we can imagine how many college students in Indonesia are, in which they can reach more than 1,000,000.
Therefore, here, JAKPAT conducted a survey concerning Indonesian college student dietary habits. The purpose of this survey is to know how Indonesian college students keep their body health reflected by their dietary habits. In this survey, we chose college students living and studying in DKI Jakarta, Bandung and DIY Yogyakarta as our respondents because we considered those cities have more universities than other provinces and cities. Majority of our respondents live with their parents (328 respondents) and the rest live in boarding house (172 respondents).

Firstly, we wanted to know their daily food consumption frequency, and we found an interesting fact here by comparing Q3 (live with parents or not) with Q1 (how many times they eat for a day).
STUDENTS LIVING WITH THEIR PARENTS TEND TO EAT REGULARLY BUT THOSE LIVING IN BOARDING HOUSE TEND TO EAT ONLY TWICE A DAY
| Q1 (single answer) : how many times do you eat for a day? | Q3 (single answer) : do you live with your parents or family? | |
| yes, i live with my parents | no, i live in boarding house | |
| Option 1 : once a day | 14 | 7 |
| 4,27% | 4,07% | |
| Option 2 : twice a day | 116 | 92 |
| 35,37% | 53,49% | |
| Option 3 : 3 times a day | 179 | 67 |
| 54,57% | 38,95% | |
| Option 4 : more than 3 times a day | 19 | 6 |
| 5,79% | 3,49% | |
| Total | 328 | 172 |
| 100,00% | 100,00% | |
It shows that parents might play significant role towards their children daily food consumption. Therefore, students living in boarding house pay less attention to their food consumption and only eat twice a day (53.49%).
ONLY 25%+ OF RESPONDENTS CONSUME VEGETABLES AND FRUIT ROUTINELY
| Q2 (single answer) : do you always consume vegetables or fruit every day? | Total | Gender | |
| Male | Female | ||
| Option 1 : yes, i eat vegetables and fruit every day | 127 | 57 | 70 |
| 25,40% | 25,79% | 25,09% | |
| Option 2 : yes, but i just eat vegetables, seldom eat fruit | 231 | 101 | 130 |
| 46,20% | 45,70% | 46,59% | |
| Option 3 : yes, but i just eat fruit, seldom eat vegetables | 82 | 31 | 51 |
| 16,40% | 14,03% | 18,28% | |
| Option 4 : no, i do not consume both vegetables and fruit | 60 | 32 | 28 |
| 12,00% | 14,48% | 10,04% | |
| Total | 500 | 221 | 279 |
| 100,00% | 100,00% | 100,00% | |
Afterwards, we wanted to know about college students’ vegetables and fruit consumption, and we found that majority of Indonesian college students rarely eat vegetables and fruit everyday. Almost half of respondents prefer eating vegetables to fruit (46.20%). Thus, we can conclude that Indonesian college students’ daily fruit consumption is low.
60%+ OF RESPONDENTS RARELY DRINK MILK
| Q4 (single answer) : do you drink a glass of milk regularly? | Total | Gender | Q3 (single answer) : do you live with your parents or family? | ||
| Male | Female | yes, i live with my parents | no, i live in boarding house | ||
| Option 1 : yes, i drink it regularly (everyday at least one glass) | 86 | 38 | 48 | 60 | 26 |
| 17,20% | 17,19% | 17,20% | 18,29% | 15,12% | |
| Option 2 : no, i drink it rarely (1-3 times in a week) | 317 | 142 | 175 | 209 | 108 |
| 63,40% | 64,25% | 62,72% | 63,72% | 62,79% | |
| Option 3 : no, i do not drink milk | 97 | 41 | 56 | 59 | 38 |
| 19,40% | 18,55% | 20,07% | 17,99% | 22,09% | |
| Total | 500 | 221 | 279 | 328 | 172 |
| 100,00% | 100,00% | 100,00% | 100,00% | 100,00% | |
When we asked about milk consumption, majority of respondents rarely drink milk (63.40%). Whether they are male or female, live with parents or not, they tend to not drinking milk regularly.
GENERALLY, 65%+ OF RESPONDENTS DO NOT CONSUME VITAMIN OR FOOD SUPPLEMENTS
| Q5 (single answer) : do you consume vitamin supplement or other food supplement? | Total | Gender | Q3 (single answer) : do you live with your parents or family? | ||
| Male | Female | yes, i live with my parents | no, i live in boarding house | ||
| Option 1 : yes | 154 | 67 | 87 | 97 | 57 |
| 30,80% | 30,32% | 31,18% | 29,57% | 33,14% | |
| Option 2 : no | 346 | 154 | 192 | 231 | 115 |
| 69,20% | 69,68% | 68,82% | 70,43% | 66,86% | |
| Total | 500 | 221 | 279 | 328 | 172 |
| 100,00% | 100,00% | 100,00% | 100,00% | 100,00% | |
Nevertheless, majority of respondents do not consume vitamin or food supplements, based on our cross tabulation, we found that students living in boarding house have higher tendency to consume vitamin or food supplements than those living with their parents. It might show us that students living in boarding house are aware of their nutrition lack.
50%+ OF STUDENTS LIVING IN BOARDING HOUSE GO OUT FOR DINING EVERYDAY
| Q6 (single answer) : do you go out for dining? | Total | Q3 (single answer) : do you live with your parents or family? | |
| yes, i live with my parents | no, i live in boarding house | ||
| Option 1 : yes, i go out for dining everyday | 151 | 49 | 102 |
| 30,20% | 14,94% | 59,30% | |
| Option 2 : yes, i go out for dining sometimes | 349 | 279 | 70 |
| 69,80% | 85,06% | 40,70% | |
| Total | 500 | 328 | 172 |
| 100,00% | 100,00% | 100,00% | |
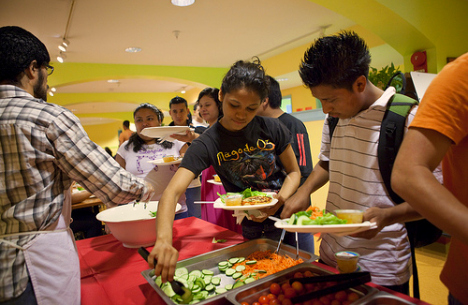
In spite of the fact that 69.80% of respondents sometimes go out for dining, those living in boarding house go out for dining everyday (59.30%). We also wanted to know about their preferences for destination restaurant, thus we asked them to tell us their priorities in choosing a restaurant. We offered them five reasons: price; cleanliness of place; food hygiene; food taste and coziness. Then, it turned out that price is still the strongest reason in choosing a restaurant. Taste, food hygiene, cleanliness of restaurant and coziness are the second, third, fourth and fifth reasons respectively in choosing a restaurant.
GENERALLY, COLLEGE STUDENTS EAT JUNK FOOD RARELY
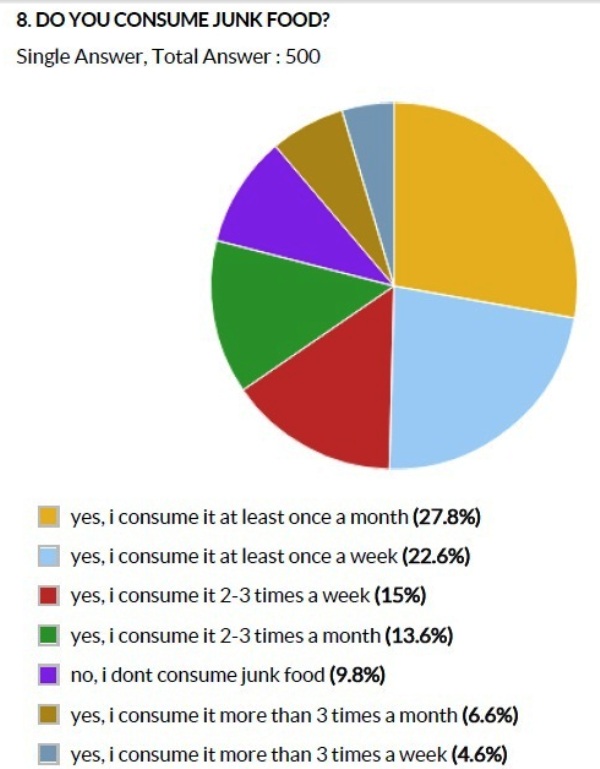
According to the survey result, Indonesian college students rarely eat junk food. As we can see on the graph above, only 22.6% of students eat junk food one a week and 27.8% of students eat junk food once a month. No high percentage found on 2-3 times or more than 3 times of junk food consumption in a week and month.
50% OF MALE COLLEGE STUDENTS EXERCISE MORE REGULARLY THAN FEMALE COLLEGE STUDENTS
| Q9 (single answer) : do you exercise (running, jogging, workout, etc) | Total | Gender | |
| Male | Female | ||
| Option 1 : yes, i exercise regularly (at least once a week) | 181 | 113 | 68 |
| 36,20% | 51,13% | 24,37% | |
| Option 2 : yes, i exercise rarely (1-3 times a month) | 247 | 85 | 162 |
| 49,40% | 38,46% | 58,06% | |
| Option 3 : no, i do not exercise (never) | 72 | 23 | 49 |
| 14,40% | 10,41% | 17,56% | |
| Total | 500 | 221 | 279 |
| 100,00% | 100,00% | 100,00% | |
As showed on the table above, 51.13% of male collage students pay more attention to their body health, thus they exercise regularly; while the female college students pay less attention to their body health, 58.06% of them exercise rarely.
Reference(s):
http://forlap.dikti.go.id/perguruantinggi/homegraphpt
For more detail you can download XLS report at the button below. JAKPAT report consists of 3 parts which are 1) Respondent Profile, 2) Crosstabulation for each question and 3) Raw Data. Respondent profile shows you demographic profiles ( gendr,age range, locationby province, and monthly spending). Cross tabulation enables you to define different demographic segment preference on each answer.
![]()
Click the icon to download XLS report
And also PDF Report here:
If you’re interested to do survey on retail and consumer goods field toward our respondents, we have over 23,000 mobile respondents ranged from age 17-50 years old, smartphone active users, and located in all regions of Indonesia that has installed our app and readily answering your survey. Those 23,000 respondents has been verified, profiled, and continuously tracked to make sure you get the updated profiles of them. Our respondents has been profiled based on their demographic (age,gender,location, spending level, profession,religion), lifestyle habit (smoking/non, gamers/non, wearing glasses/non, frequent flyer/non, online shopper/non), and also brand consumption level ( brand A users, brand B users in FMCG, Retail, E-commerce,etc).
If you want to do research toward our respondent, please signup here and directly create your survey there. Or directly contact our Bizdev - Chrisprastika at +62-878-3908-9833. To non-Indonesian client, we offer free translation from foreign languages includes English, Chinese,Hindi,etc.