

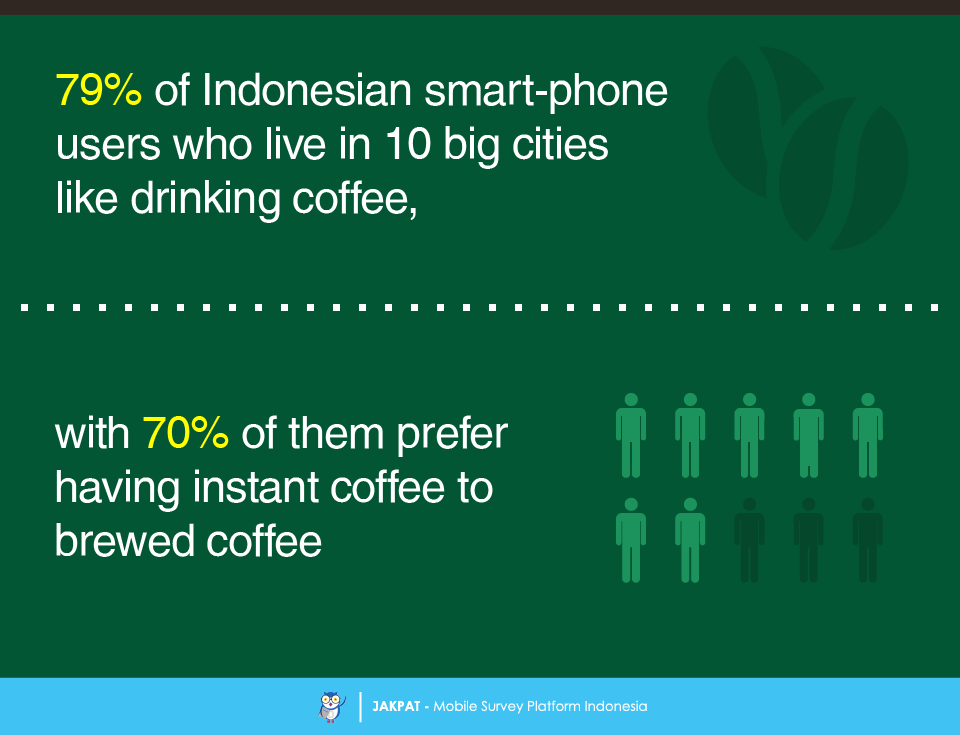
In September 2015, Jakpat conducted a survey in order to see Indonesian’s Coffee Drinking Habit[1], in consideration that drinking coffee is not only merely about meeting the needs of body fluids, but also has become a part of nowadays lifestyle. Based on that survey, we would like to see how the Indonesian’s habit of drinking coffee in 2016. Therefore, recently Jakpat has conducted a survey in order to see Indonesian’s preferences and habit when they drink coffee, with some changes have been made from the previous survey regarding to the questions. This survey involved 414 respondents who currently live in 10 big cities of Indonesia, including Jakarta, Bandung, Semarang, Yogyakarta, Surabaya, Bali, Lombok, Medan, Balikpapan, and Makassar. For the further notes, Jakpat’s respondents in this survey are Indonesian smart-phone users with a range of age from 18 to 40 year-old. Regarding to this survey, first of all, we found that most of our respondents (79%) like drinking coffee, with many of them (70%) admit that they prefer drinking instant coffee to brewed coffee. We actually asked about which instant coffee brand they frequently consume. However, due to some technical problems, unfortunately we didn’t get a valid result for that question.
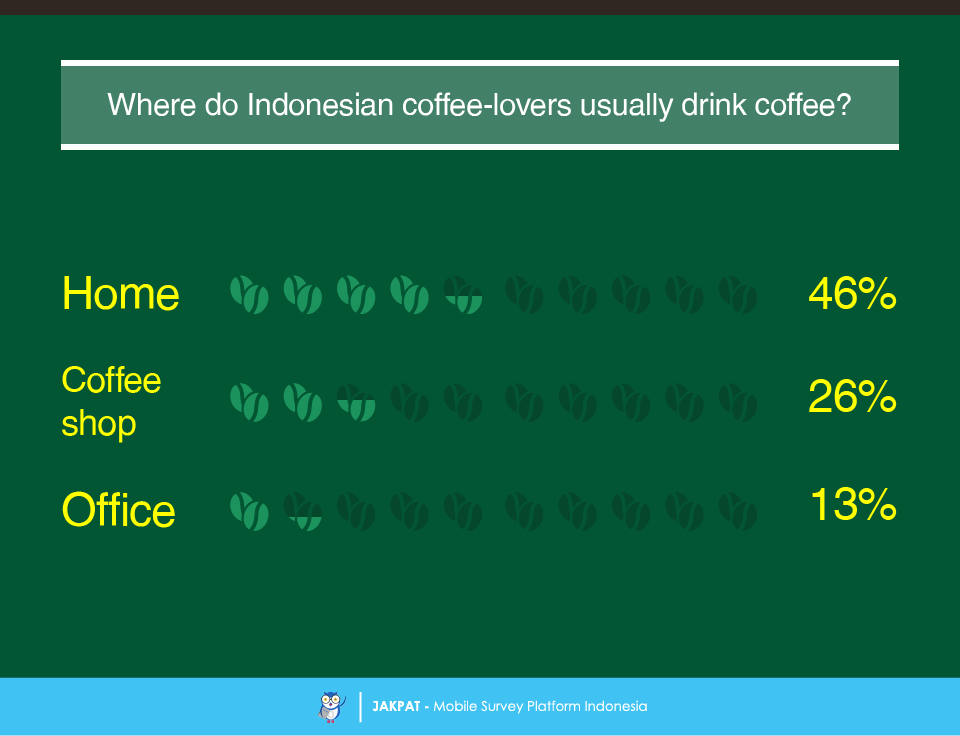
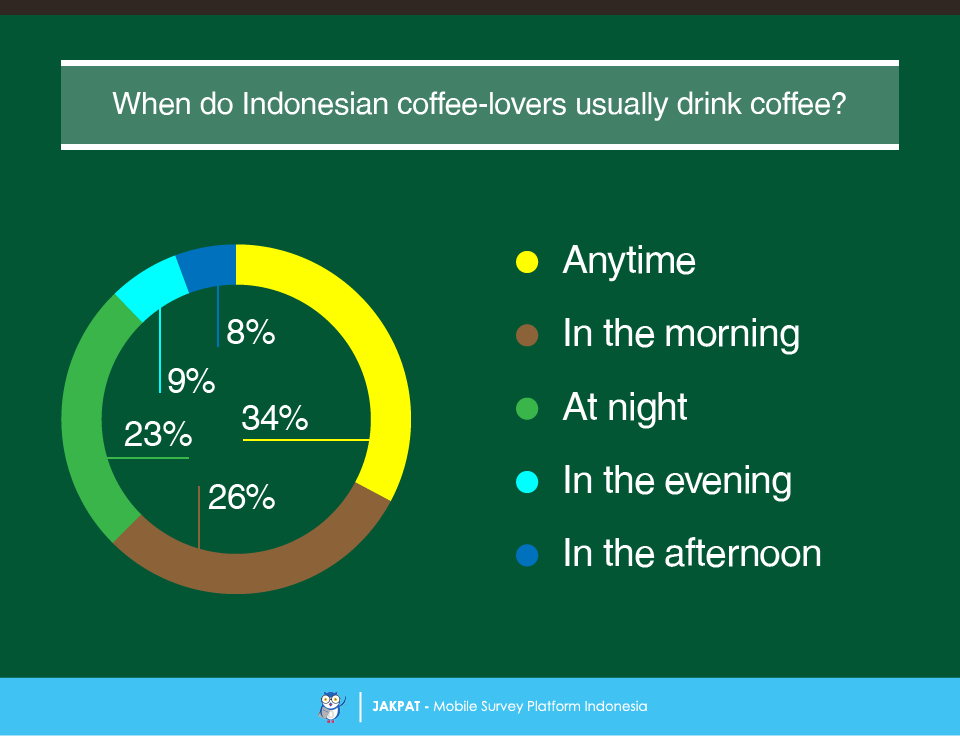
Next, regarding to the place where they frequently drink coffee, almost half of our respondents (46%) admit that they usually drink coffee at their own house. There are also 26% of them who regularly go to coffee shop in order to drink coffee. Meanwhile, there are 13% of them who admit that they usually have coffee at their working place. Subsequently, regarding to the time when they usually drink coffee, apparently some of them drink coffee anytime in a day (34%), in the morning (26%), and at night (23%). There are also 9% of them who admit that they drink coffee in the evening, and also 8% of them who drink coffee in the afternoon.
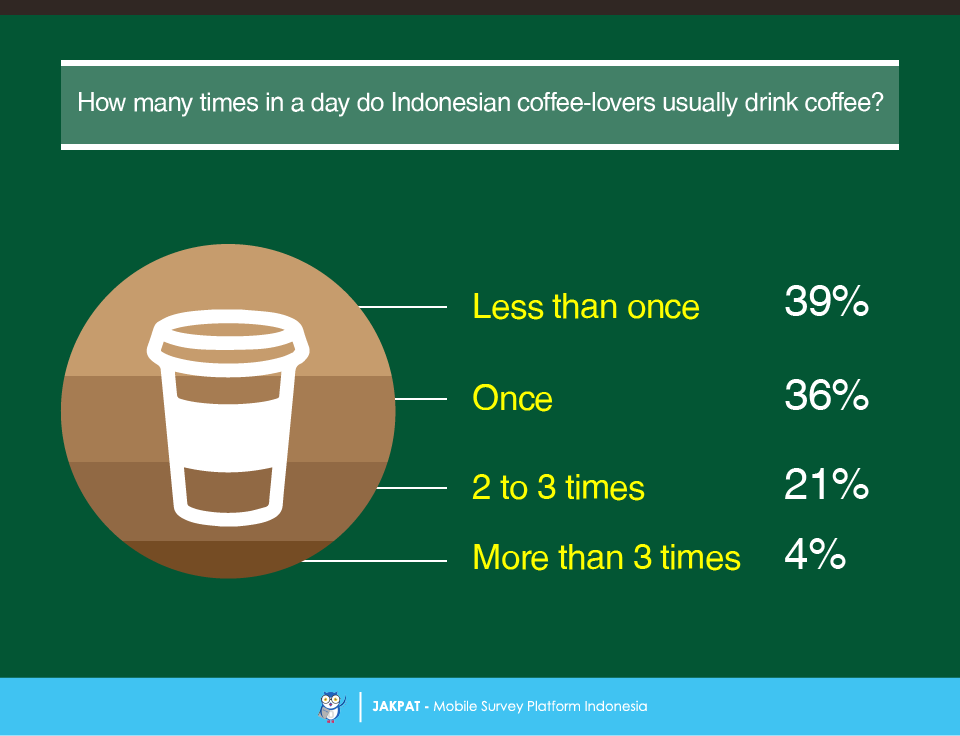
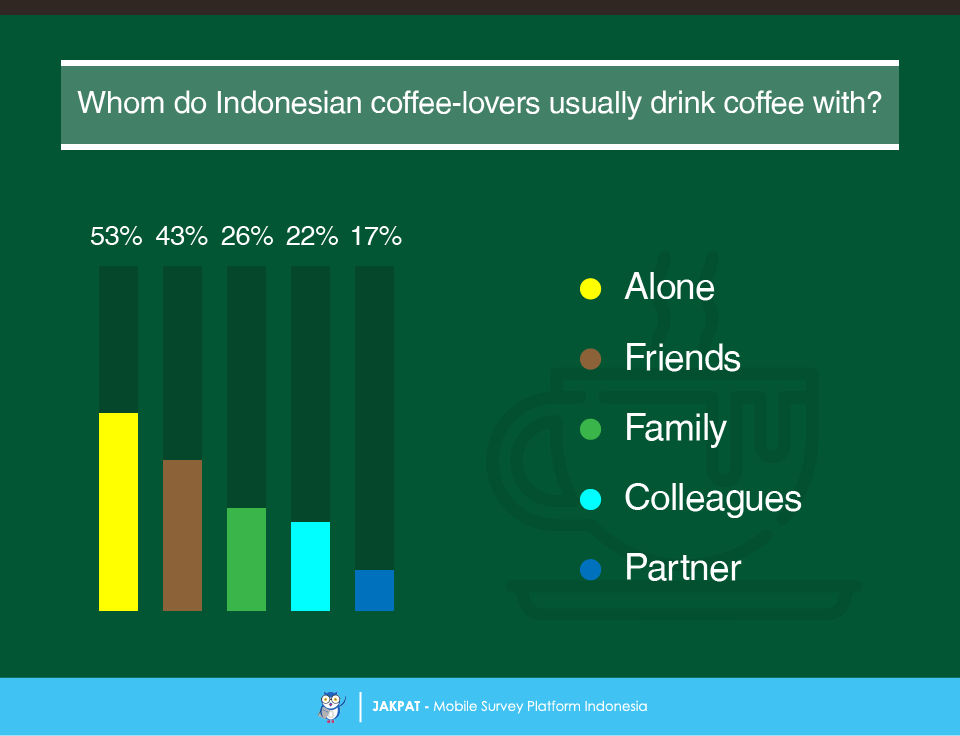
When asked about how often they drink coffee in a day, most of our respondents answered that they drink coffee less than once a day (39%) and also once a day (36%) at the very least. There are also 21% of them who admit that they usually drink coffee for about 2 to 3 times in a day. Meanwhile, there are only 4% of them who frequently drink coffee for more than 3 times in a day. Regarding to whom they drink coffee with, apparently more than half of them (53%) admit that they like to enjoy drinking coffee alone by themselves. However, there are also 43% of them who like to have coffee with their friends. Moreover, there are also some of them who usually drink coffee with their family (26%), colleagues (22%), and partners (17%).
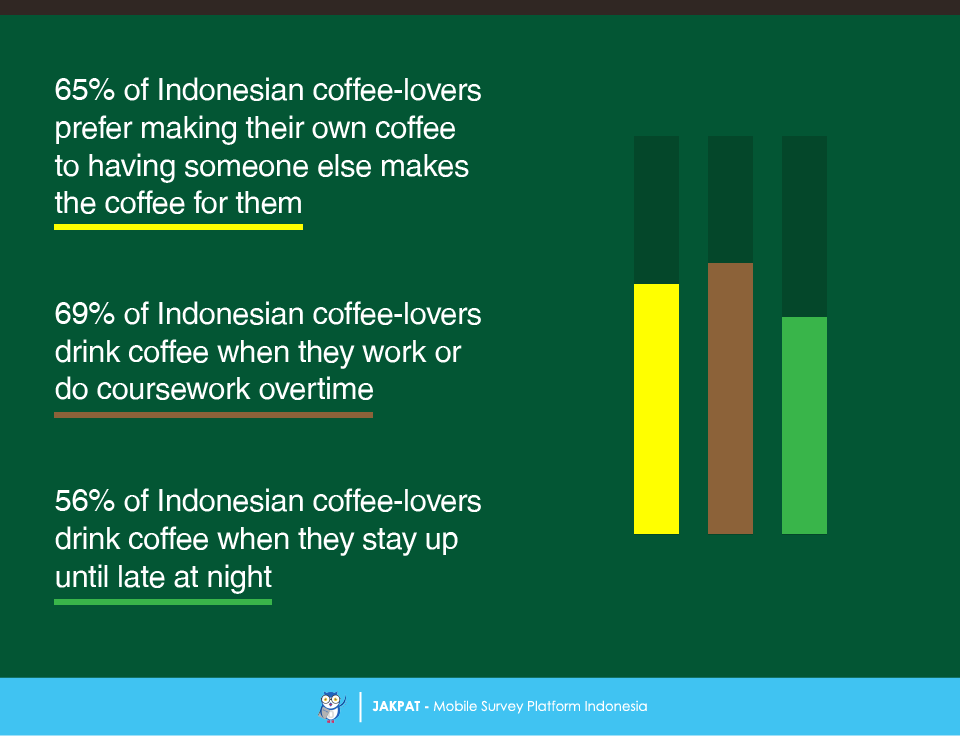
Furthermore, we found that many of our respondents (65%) prefer making their own coffee to having someone else makes the coffee for them. Regarding to the habit of drinking coffee, many of them (69%) admit that they usually drink coffee when they do some work overtime, especially ones related to office work or college coursework. Henceforth, more than half of them (56%) admit that they usually drink coffee when they have to stay up until late at night to do some activities such as neighborhood night watch, watching the football game, watching movies, etc.
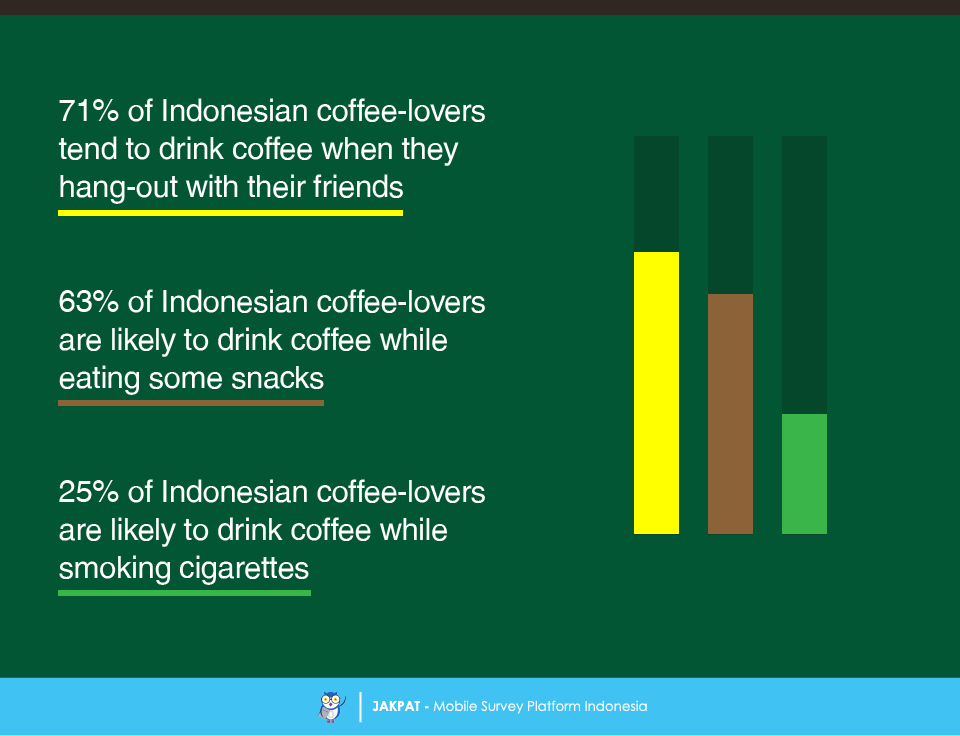
Still related to the drinking coffee habit, apparently most of our respondents (71%) admit that they tend to choose coffee as their drink when they hang-out with friends. Concurrently, many of them (63%) state that they are likely to drink coffee while eating some snacks or having some light meals. Lastly, we found out that there are only 25% of them who admit that they are likely to drink coffee while smoking cigarettes. Thus, we have learnt further from this survey about some habits that our respondents have regarding to drinking coffee.
[1] See the survey report at http://blog.jakpat.net/indonesian-coffee-drinking-habit-survey-report/
For more detail you can download XLS report at the button below (bahasa). JAKPAT report consists of 3 parts which are 1) Respondent Profile, 2) Crosstabulation for each question and 3) Raw Data. Respondent profile shows you demographic profiles ( gender,age range, location by province, and monthly spending). Cross tabulation enables you to define different demographic segment preference on each answer.
![]()
You can also download PDF here:
![]()

or Get A Sales Quote by filling this form or Call to +622745015293
