

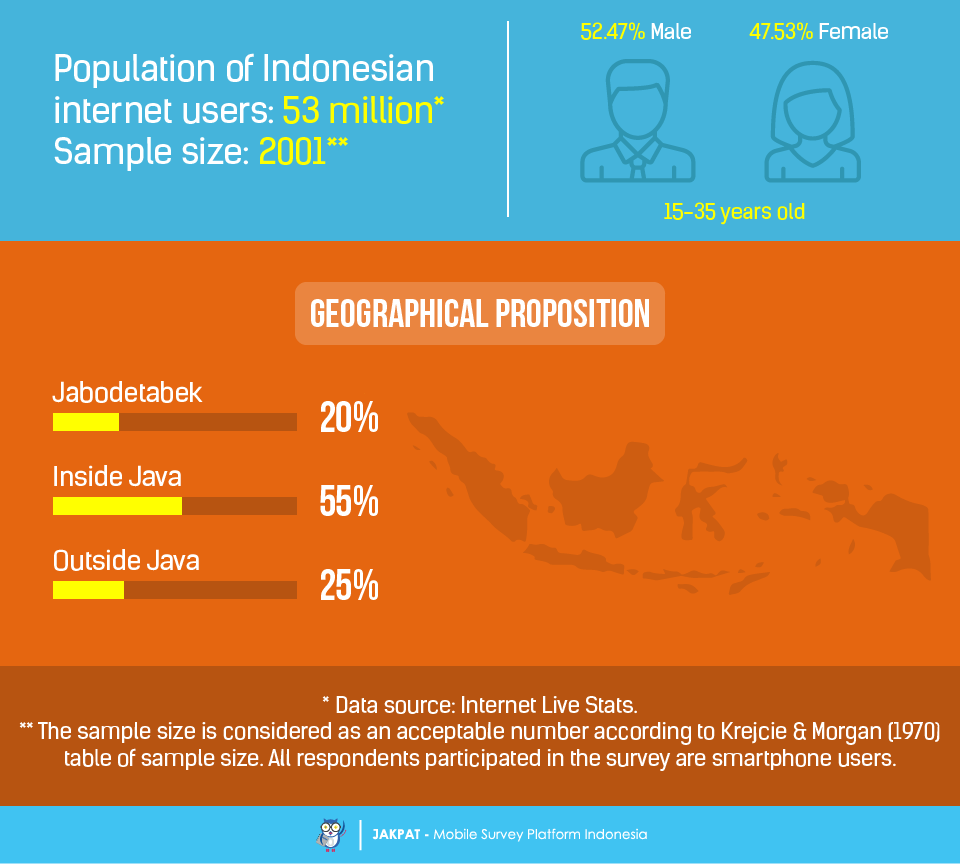
Active and always craving for new experiences are two characteristics that well represent the youth. In particular, when it comes to their hobby or interest, youth will never doubt to engage themselves in any kind of activity, including joining a community. Therefore, regarding to this matter, recently Jakpat has conducted a survey in order to see the distribution of hobbies and interests based youth community in Indonesia. This survey involved 2001 youngster respondents from across Indonesia. For the further notes, Jakpat’s respondents in this survey are Indonesian smart-phone users, with a range of age from 15 to 35 year-old, in which still considered as ‘youth’. Though the United Nation has defined youth as the age cohort of 15 to 24[1], we intentionally span the range of age since youth is the stage of constructing the self-concept. Hence, the self-concept of youth is influenced by several variables such as peers, lifestyle, gender, and culture.[2] For it is the time of a person’s life in which they make choices which will affect their future, therefore for this survey, we define youth as the age cohort of 15 to 35.
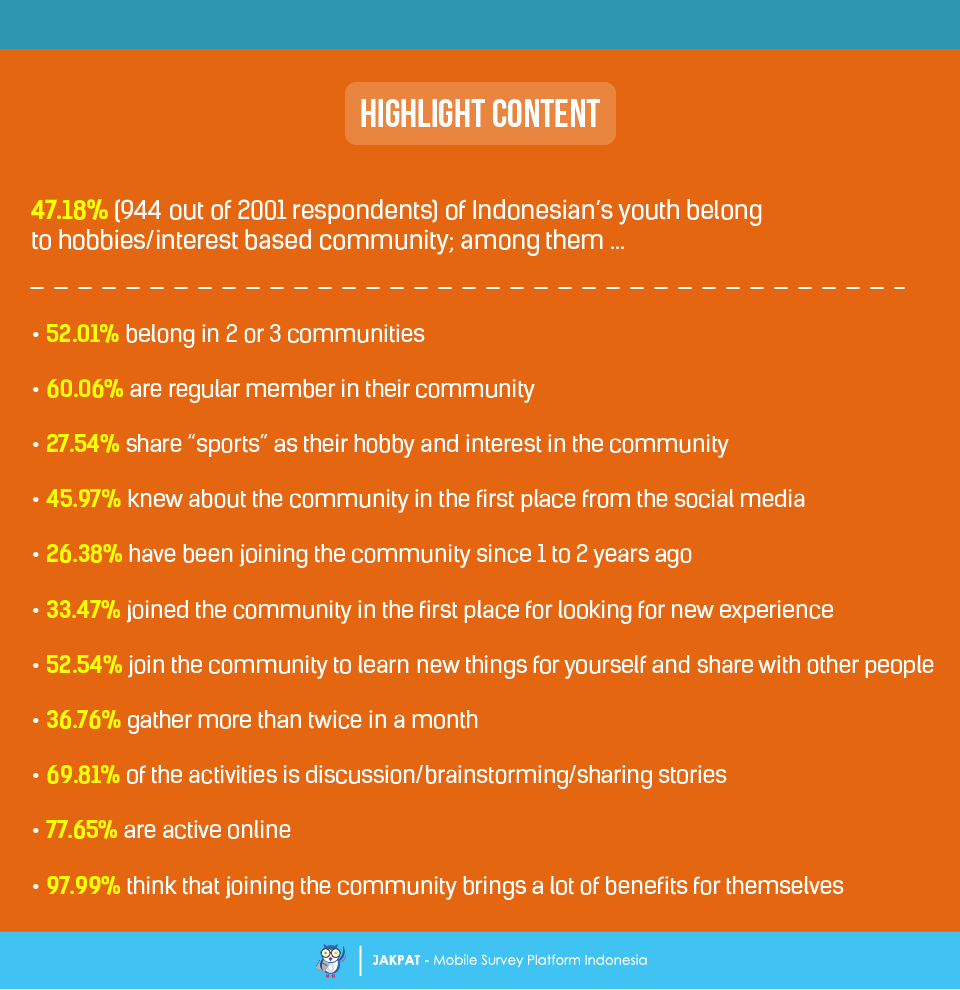
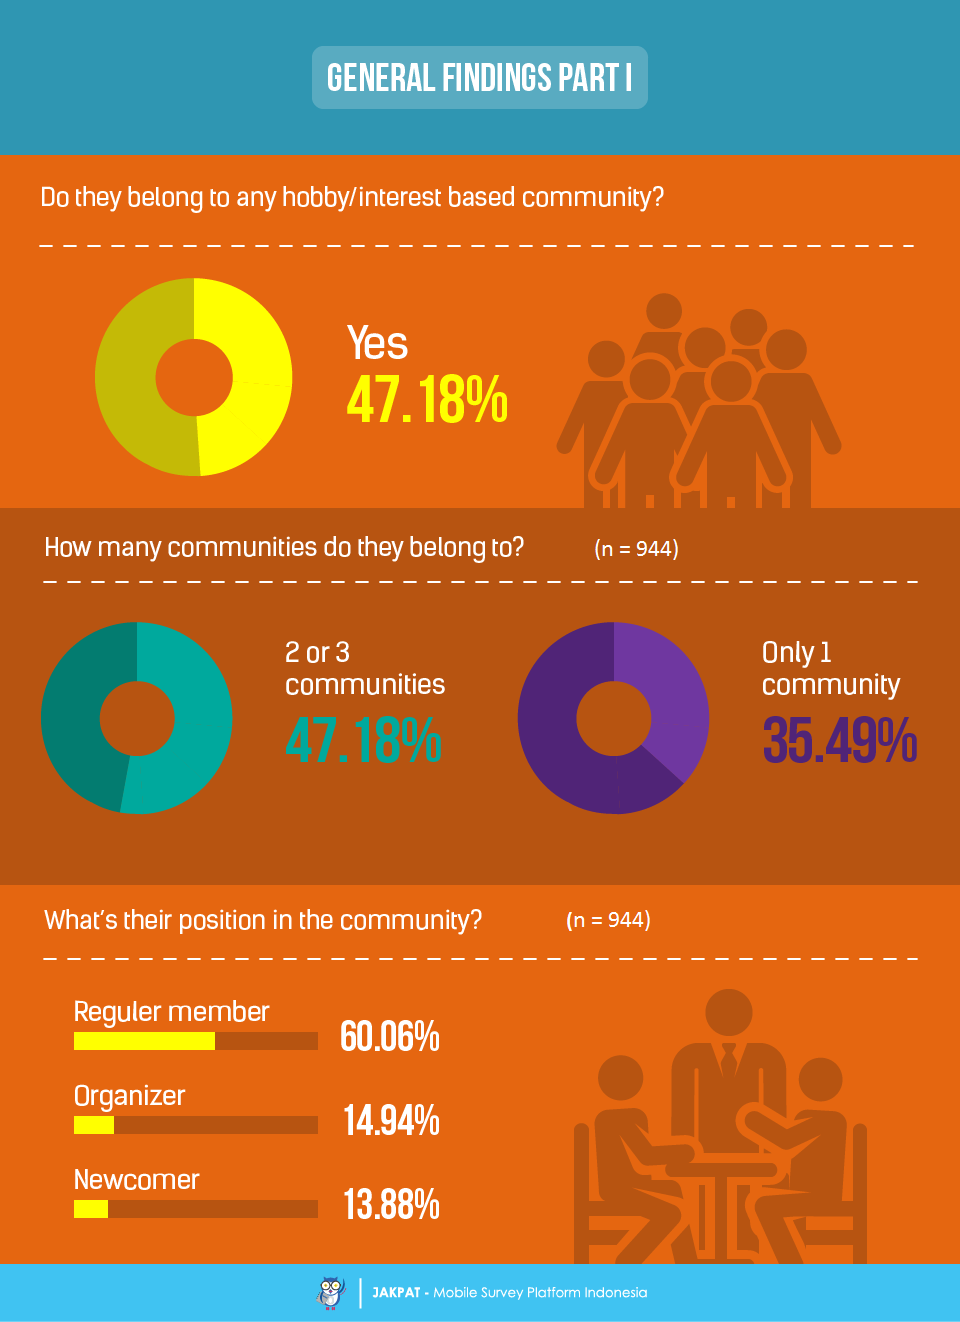
This survey report is divided into six chapters. First of all, the first chapter is about general findings from the survey. Apparently, we find that almost half of our total respondents (47.18%) join in hobby or interest based community. Hence, more than half of them (52.01%) belong in 2 or 3 communities at the same time, while some of them (35.49%) belong in only 1 community. Regarding to the position they have in their community, many of them (60.06%) are regular member in the community, while some of them are the organizer (14.94%) and newcomer (13.88%) in the community.
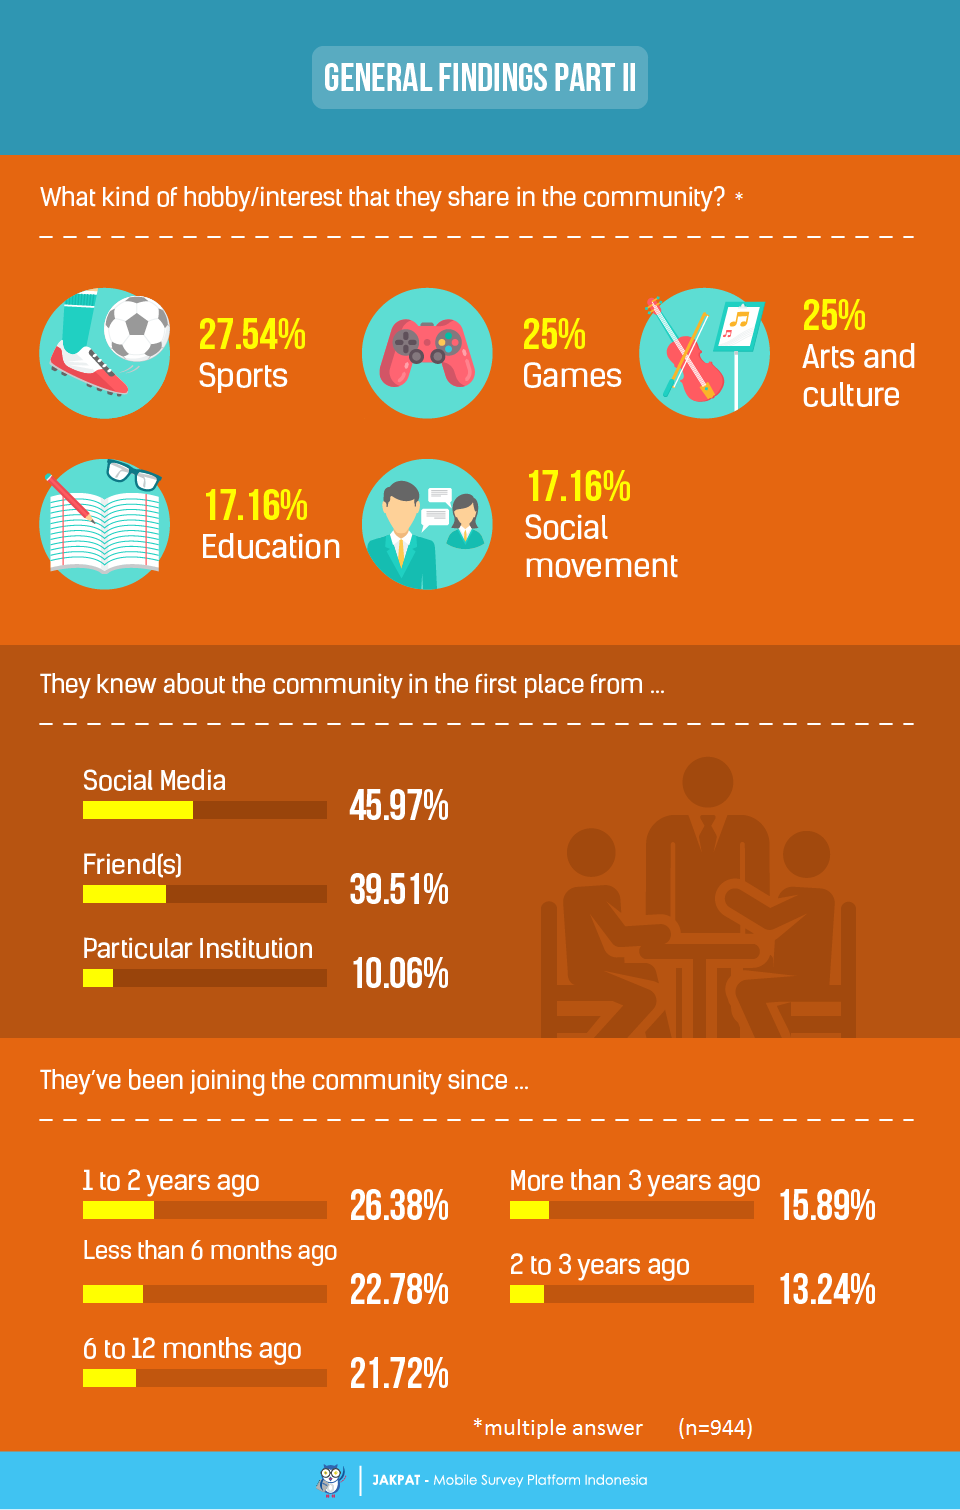
The second chapter is still about general findings we get from the survey. There are five hobbies or interests that are most popular to be shared in the community, which are: (1) sports, as chosen by 27.54%; (2) games, as chosen by 25%; (3) arts and culture, as chosen by 22.78%; (4) education, as chosen by 17.16%; and (5) social movement, as chosen by 16.95%. Regarding to the source of information about the community they join in, almost half of them (45.97%) admit that they knew about the community in the first place from the social media, while some of them (39.51%) knew it from their friends, and a few of them (10.06%) from some particular institution. Apparently, some of our respondents have been joining the community since 1 to 2 years ago (26.38%), less than 6 months ago (22.78%), from 6 to 12 months ago (21.72%), more than 3 years ago (15.89%), and even since 2 to 3 years ago (13.24%).
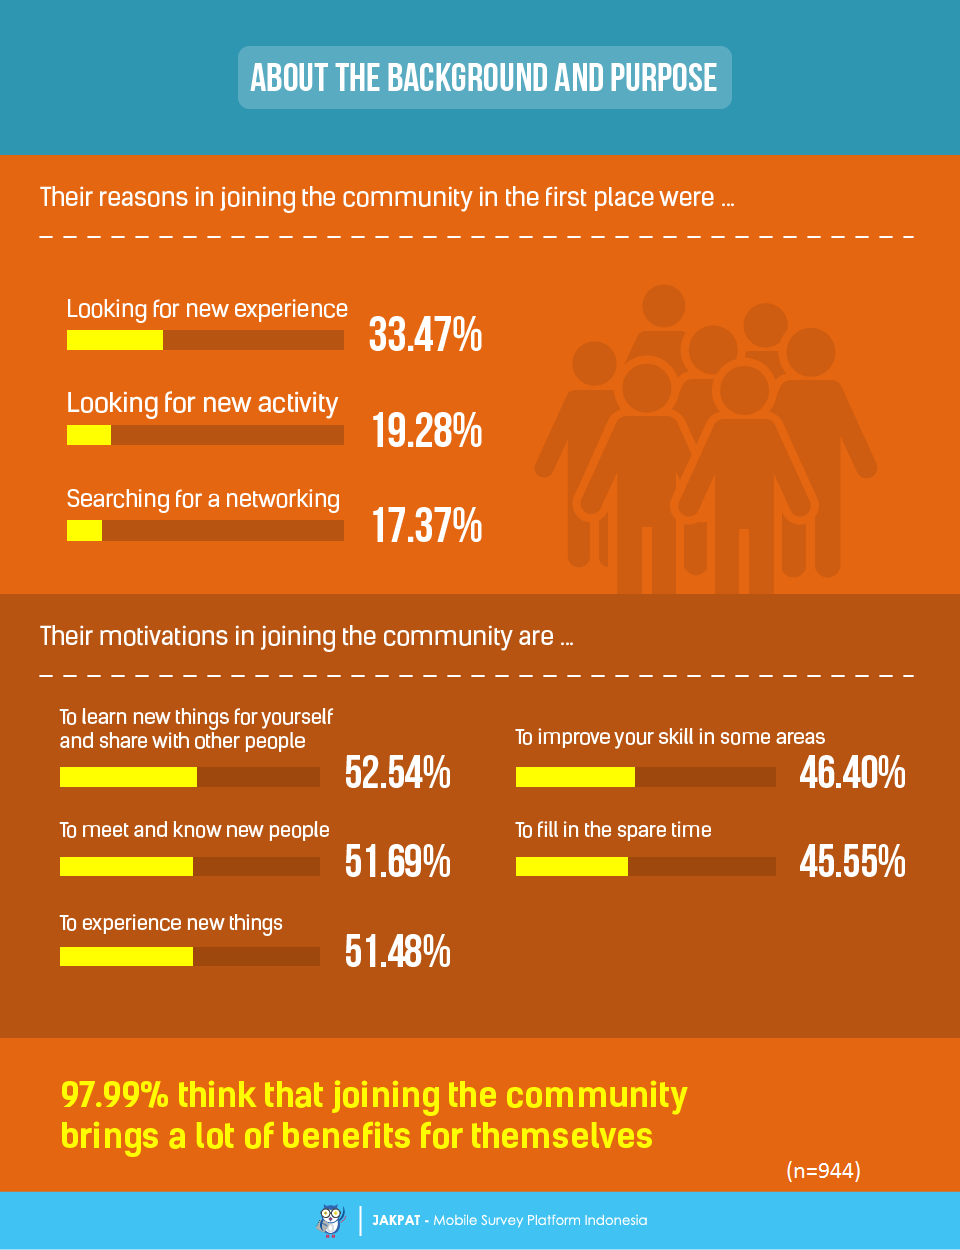
The third chapter is about the background and purpose for joining hobby or interest based community. Many of our respondents (33.47%) joined the community in the first place in order to look for new experience, while some of them admit that they joined the community in the first place in order to look for new activity (19.28%) and search for a networking to build (17.37%). Hence, more than half of our respondents join the community for learning new things for themselves and sharing it with other people (52.45%), for meeting and knowing new people (51.69%), and for experiencing new things (51.48%). Meanwhile, many of our respondents also have motivations in joining the community for improving their skill in some areas (46.40%), and for filling in their spare time (45.55%). Furthermore, almost all of our respondents (97.99%) think that joining the community brings a lot of benefits towards them.
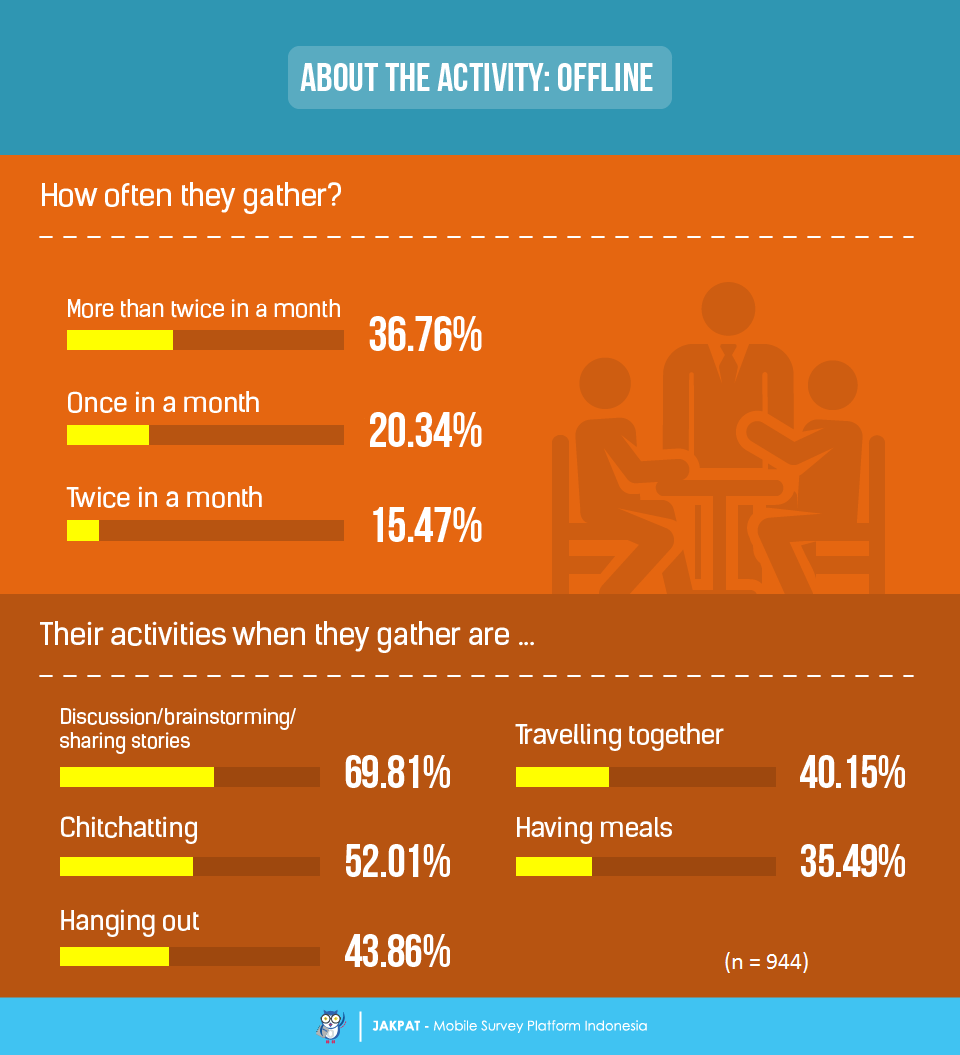
The fourth chapter is about the activity of their community, particularly the offline activity. Apparently, their activities include: (1) discussion or brainstorming or sharing stories, as chosen by 69.81%; (2) chitchatting, as chosen by 52.01%; (3) hanging out, as chosen by 43.86%; (4) travelling together, as chosen by 40.15%; and (5) having meals, as chosen by 35.49%. Henceforth, many of their communities (36.76%) are gathered more than twice a month, while some of them are gathered only once a month (20.34%) or twice a month (15.47%).
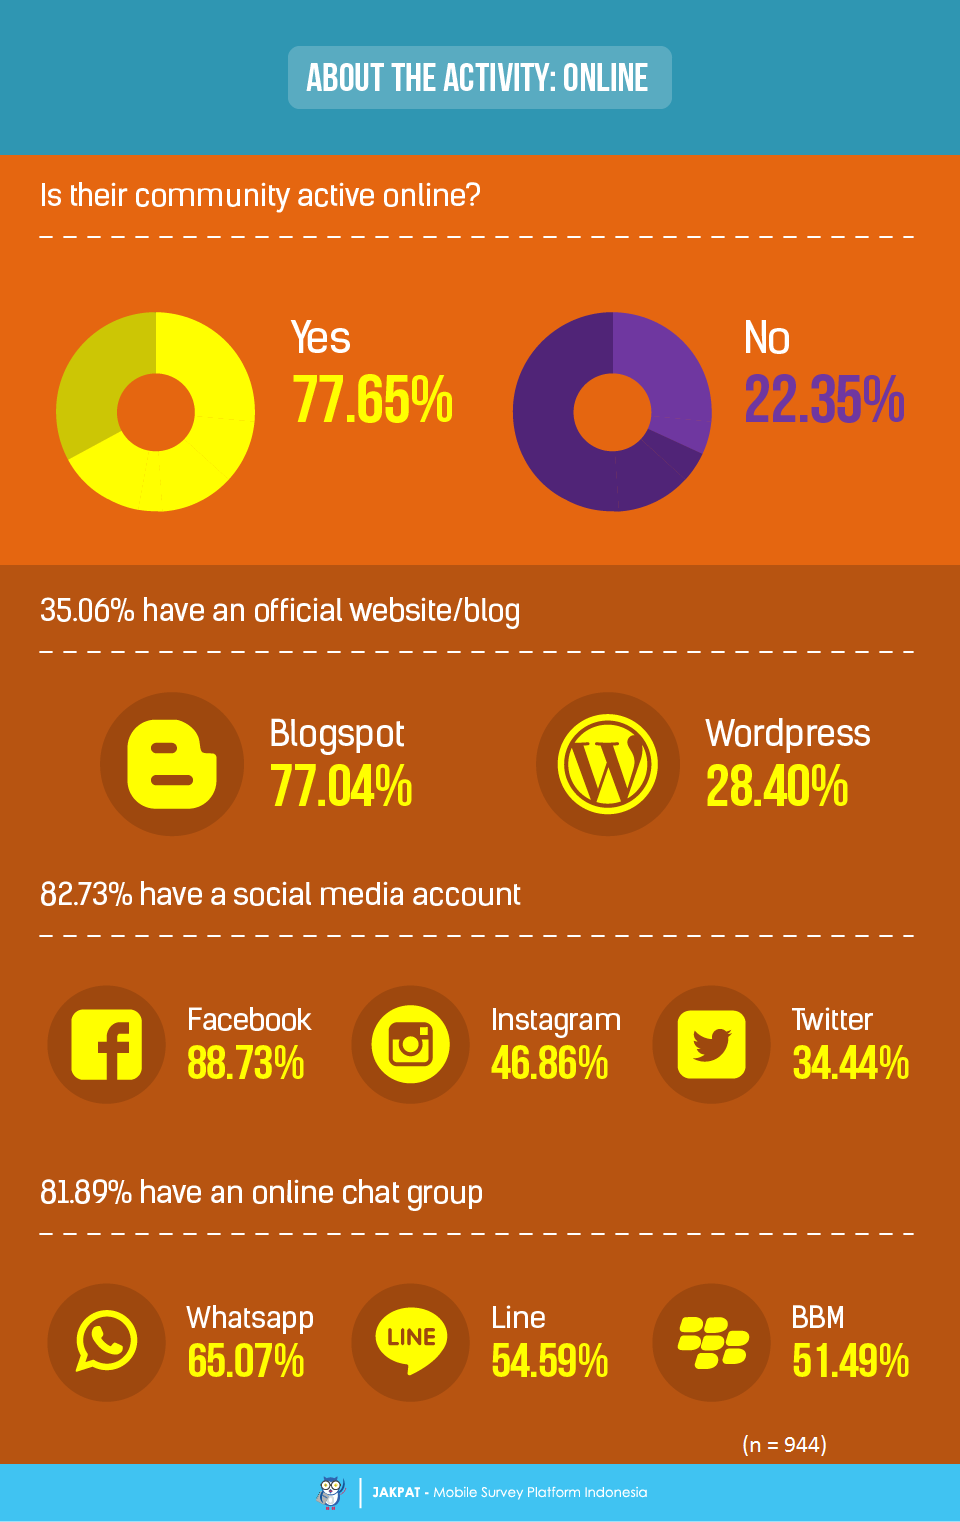
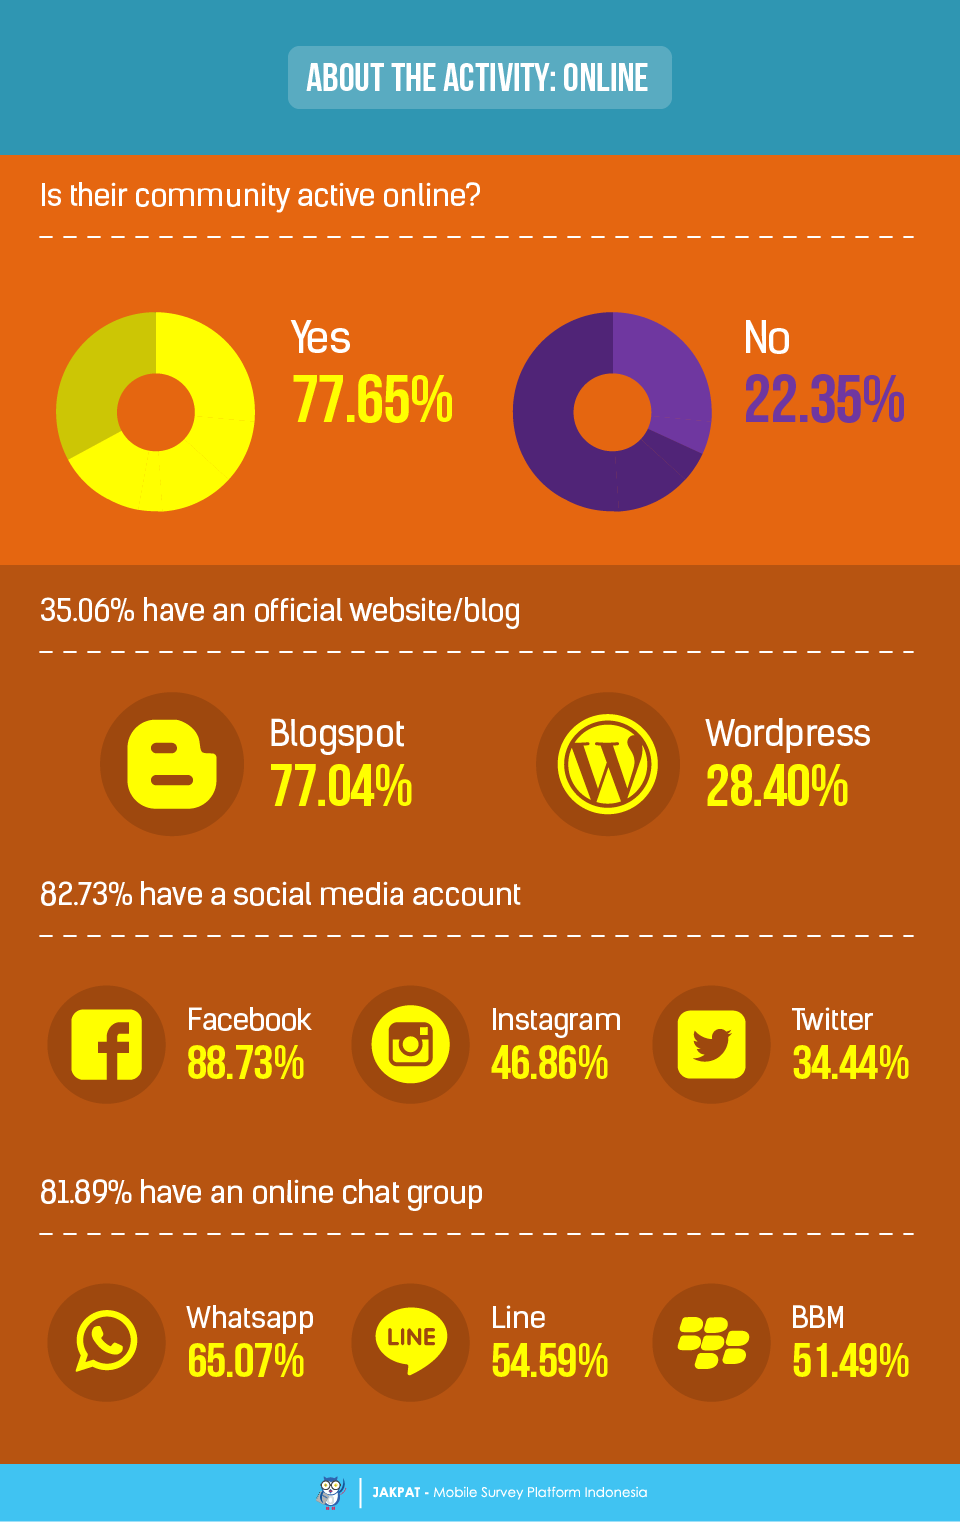
The fifth chapter is still about the activity of their community. However, this part is focusing on their online activity. Most of the communities of our respondents (77.65%) are active online, with 35.06% of them have an official website or blog, 82.73% have a social media account, and 81.89% have an online chat group. The most popular blog hosting used by the community is Blogspot, as chosen by 77.04%, and then followed by WordPress, as chosen by 28.40%. the most popular social media platform used by the community is Facebook, as chosen by 88.73%, followed by Instagram as the second most popular as chosen by 46.86%, and then Twitter as the third most popular as chosen by 34.44%. As for the online messenger platform, the most popular used by the community is Whatsapp, as chosen by 65.07%, and then followed by LINE as chosen by 54.59%, and also BBM as chosen by 51.49%.
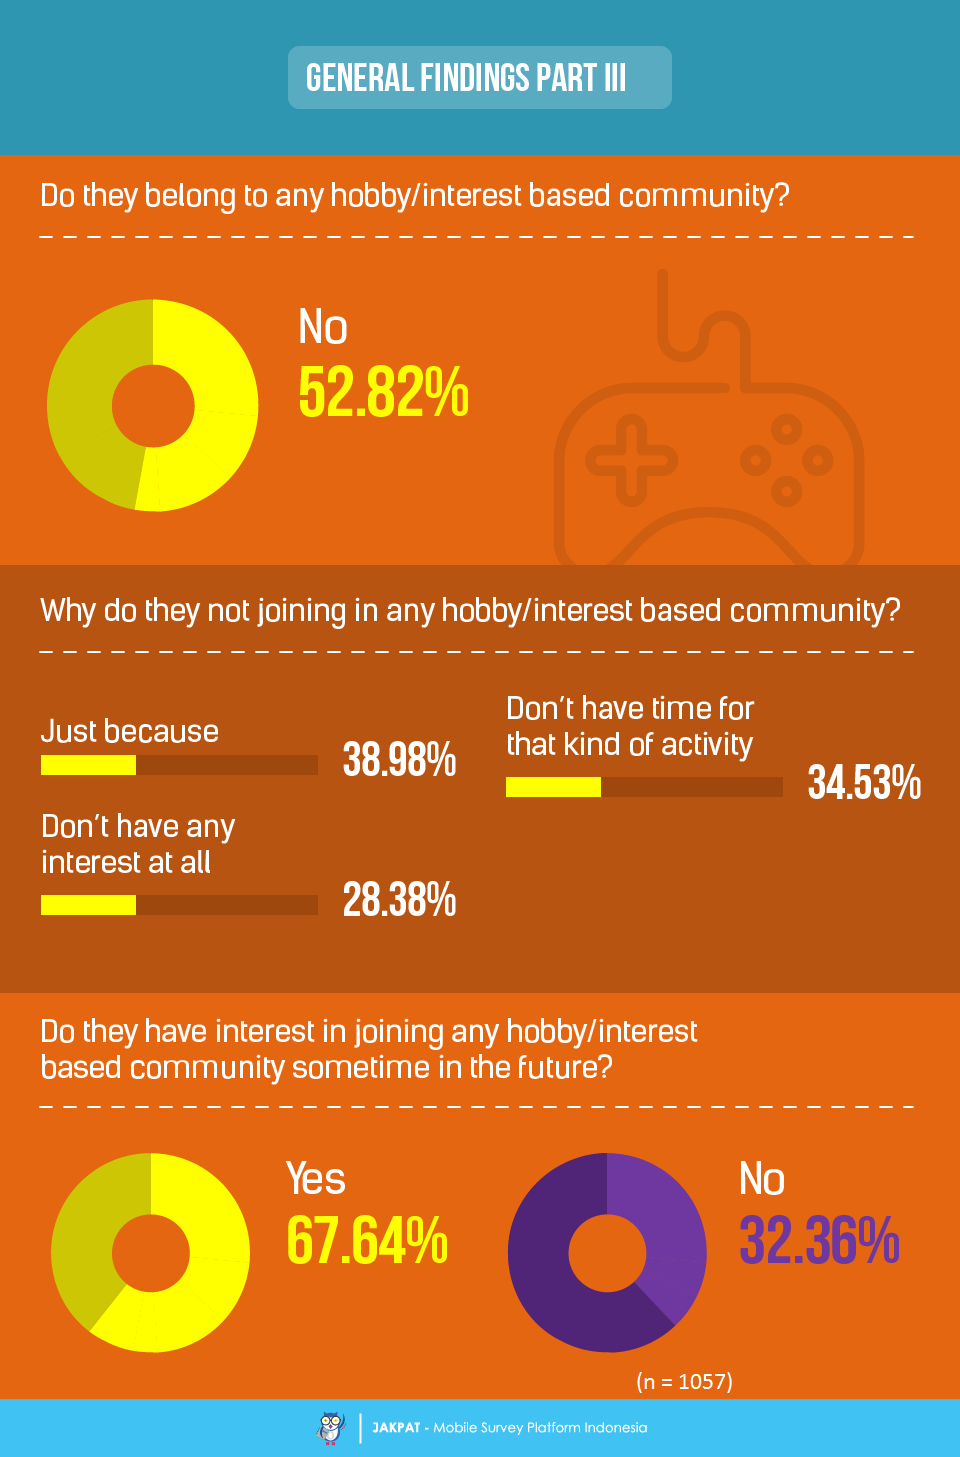
The sixth or the last chapter is also the third part of general findings from this survey. This part is focusing on those respondents who do not join in hobby or interest based community. More than half of our respondents (52.82%) do not belong in any hobby or interest based community. Their reasons for not joining any community are just because (38.98%), because they don’t have time for that kind of activity (34.53%), and also because they don’t have any interest at all (28.38%). Lastly, when asked about whether they have interest for joining hobby or interest based community, apparently most of them (67.64%) admit that they would like to join some hobby or interest based community sometime in the future.
[1] Source: http://www.un.org/esa/socdev/documents/youth/fact-sheets/youth-definition.pdf
[2] Source: Thomas, A. (2003) “Psychology of Adolescents”, Self-Concept, Weight Issues and Body Image in Children and Adolescents, p. 88.
For more detail you can download XLS report at the button below (bahasa). JAKPAT report consists of 3 parts which are 1) Respondent Profile, 2) Crosstabulation for each question and 3) Raw Data. Respondent profile shows you demographic profiles ( gender,age range, location by province, and monthly spending). Cross tabulation enables you to define different demographic segment preference on each answer.
![]()
You can also download PDF here:
![]()

or Get A Sales Quote by filling this form or Call to +622745015293
