


Nowadays as more and more college students graduate from their college, finding a job has become very competitive. A lot of them may be able to find their dream job, but a lot of others may have to count on luck. Although we cannot deny a lot of other unlucky people just have to take whatever job that accept them as they are. This article may not try to reveal the factors of how to get a dream job or to be “lucky” at getting one, but we wanted to see if our working respondents are generally happy with their current job. We asked some other related questions to support our answered curiosity through this survey.
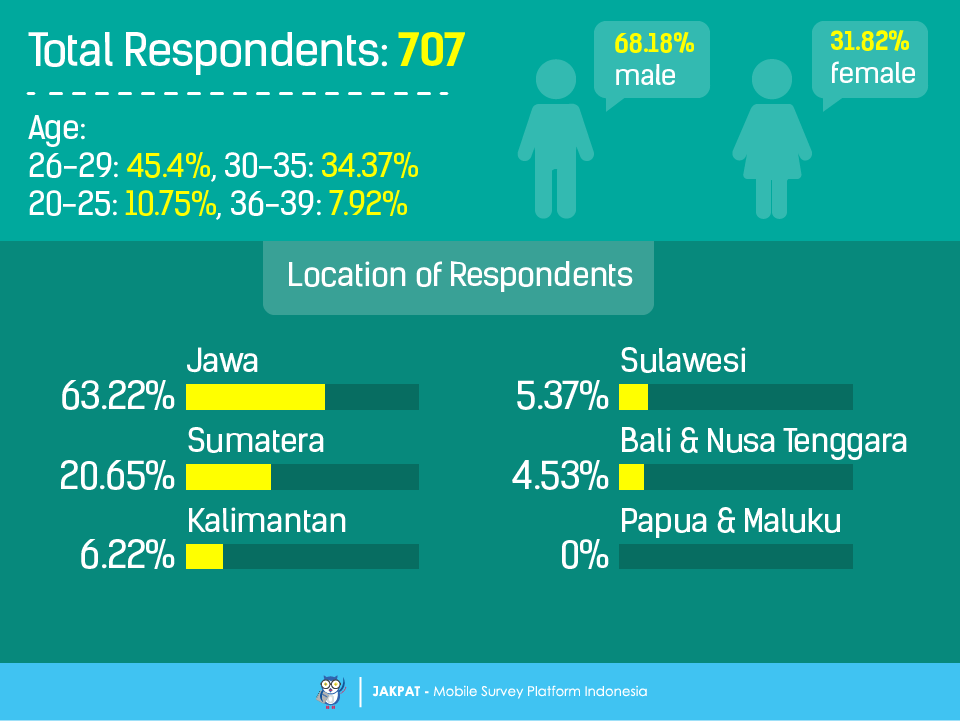
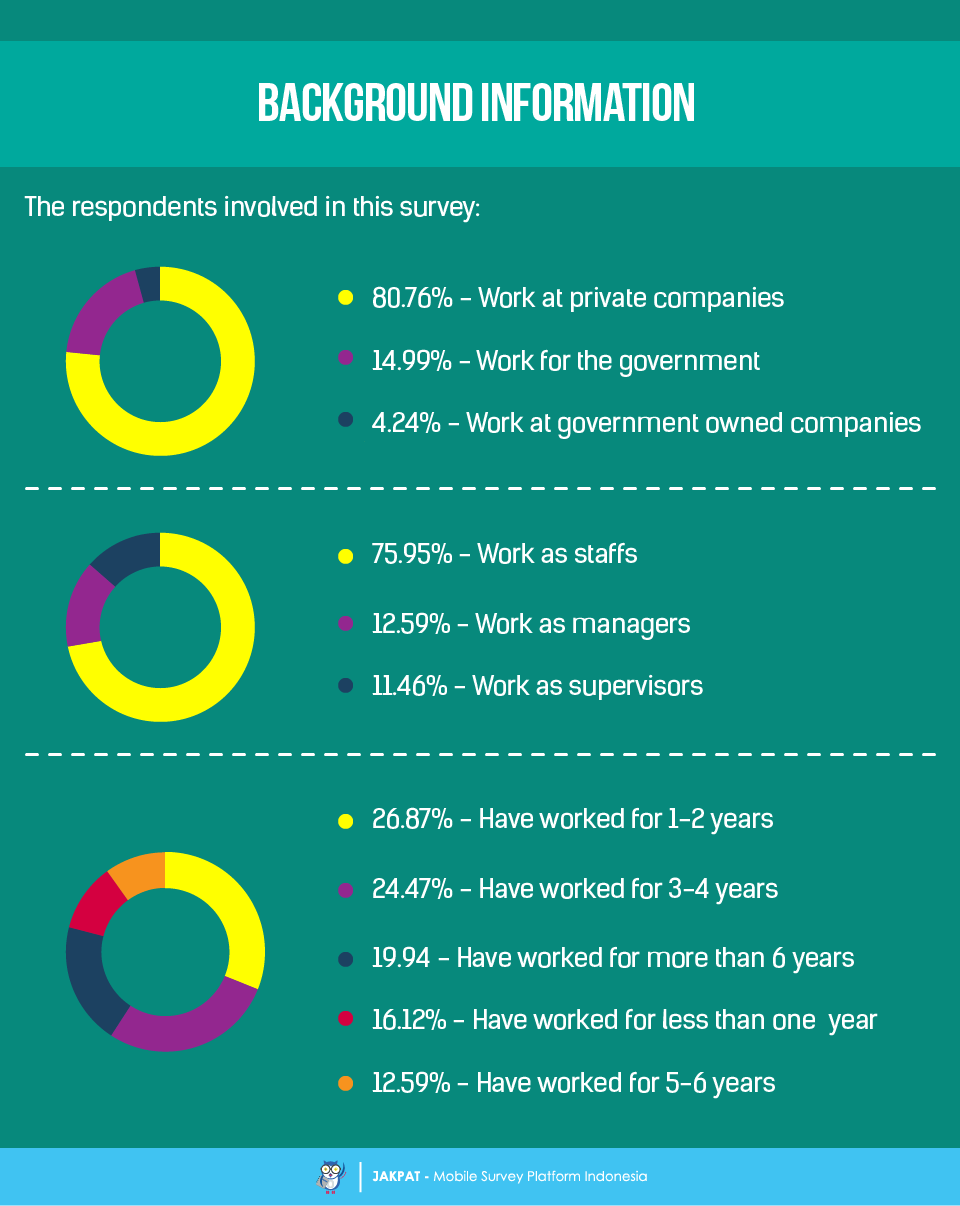
Before we spill our findings, we would like to deliver some background information about our respondents who were involved in this survey, over the below picture.
Now we are getting to the findings. We asked the respondents how many times they had changed the jobs previously. 27.86% of the respondents said two times. 19.94% said three times of jobs changes. 19.8% said just one time of jobs change. Lastly, 16.69% admitted to have never changed jobs before.

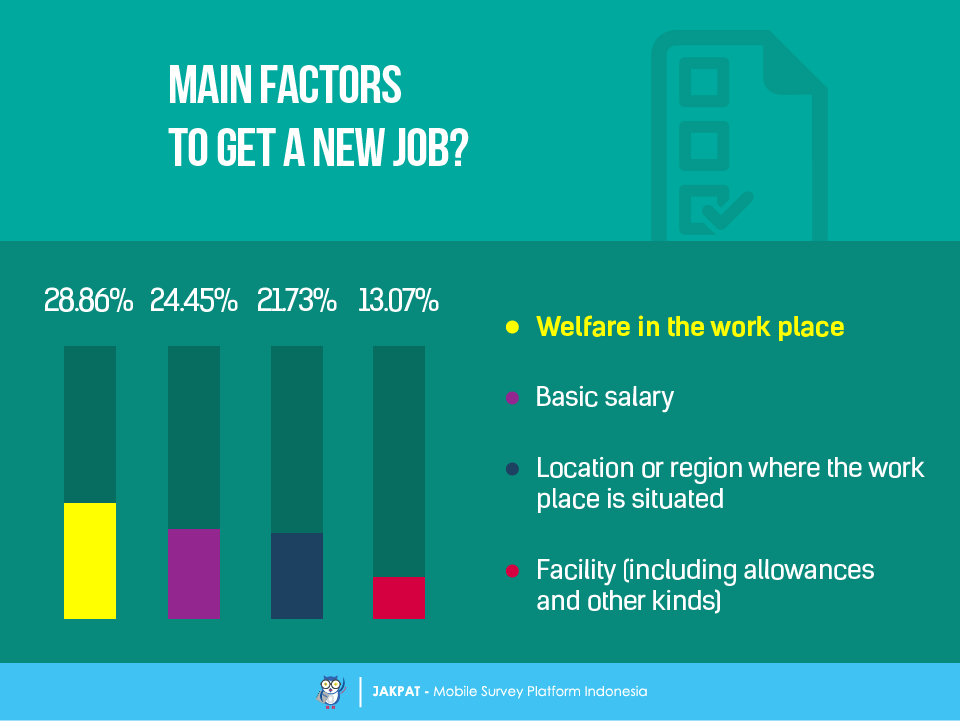
What is it that the respondents look for or at when looking to get a job? 28.86% of the respondents said they look for welfare in the workplace. Such a finding shows how welfare at work plays an important roll over basic salary. 24.45% said they look at the basic salary. 21.73% said they look at the factor of where the workplace is located or situated. Lastly, 13.07% said they look at the facility including allowances and other kinds.
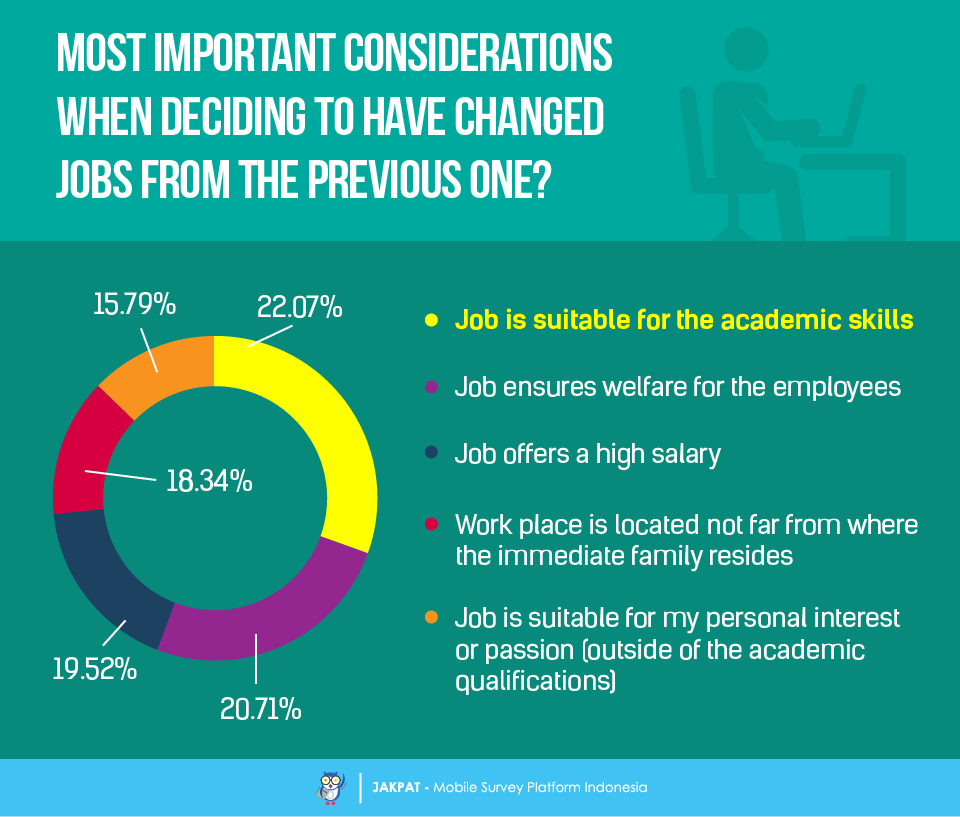
There must be at least one reason or even more for someone to quit their job and move on to getting accepted to a new one. We asked the respondents about the main factors for their decision to quit at the first place from their previous job and what they looked for as the most important consideration(s) from the new job that got them in. 22.07% admitted that they looked for a job that was more suitable for the academic skills. 20.71% admitted that they went for a job that could ensure welfare for the employees at work. 19.52% admitted they looked at the job that offered them a higher salary. 18.34% thought that the new workplace preferably needed to be located not far from where their immediate family resided. 15.79% said that the new job was suitable for their personal interest or passion that is outside the academic qualifications.
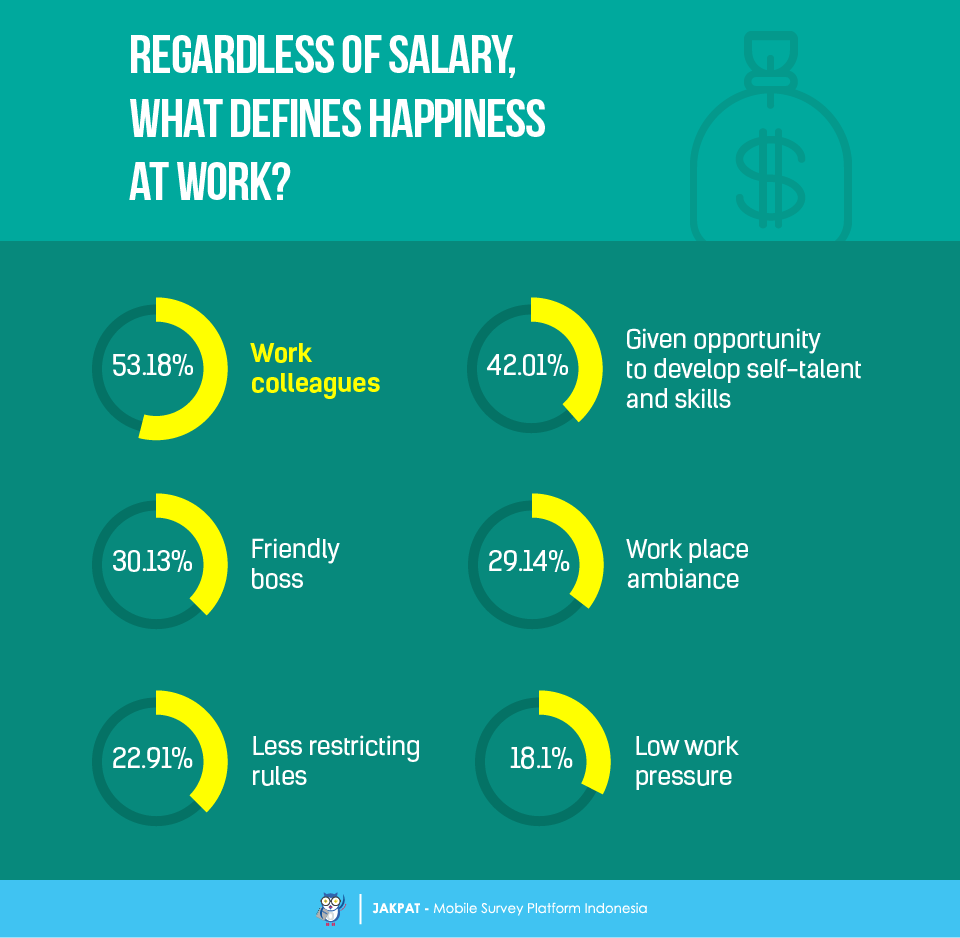
Since it is important for employees at work to be happy, we asked the respondents what should define happiness at work. 53.18% said that the right work colleagues help with the happiness at work. 42.01% thought that happiness at work should mean that the employees are given the opportunity to develop self-talent and skills. 30.13% thought that a friendly boss means happiness at work. 29.14% thought the work place ambiance plays a certain important amount of role for creating a happy ambiance at work. 22.91% thought that rules that are less restricting mean more happiness at work. Lastly, 18.1% thought that the lower work pressure, the higher the happiness at work get.
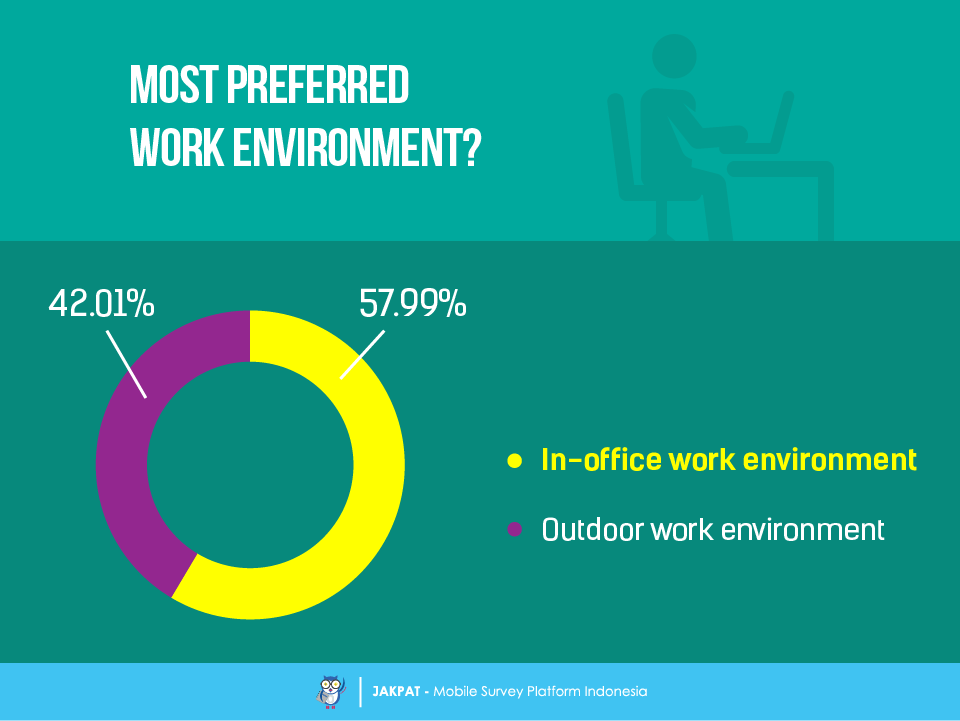
We then wanted to know what sort of work environment that the respondents prefer. 57.99% said that a preferred work environment is an office one as opposed to an outdoor one. 42.01% were for outdoor work environment.
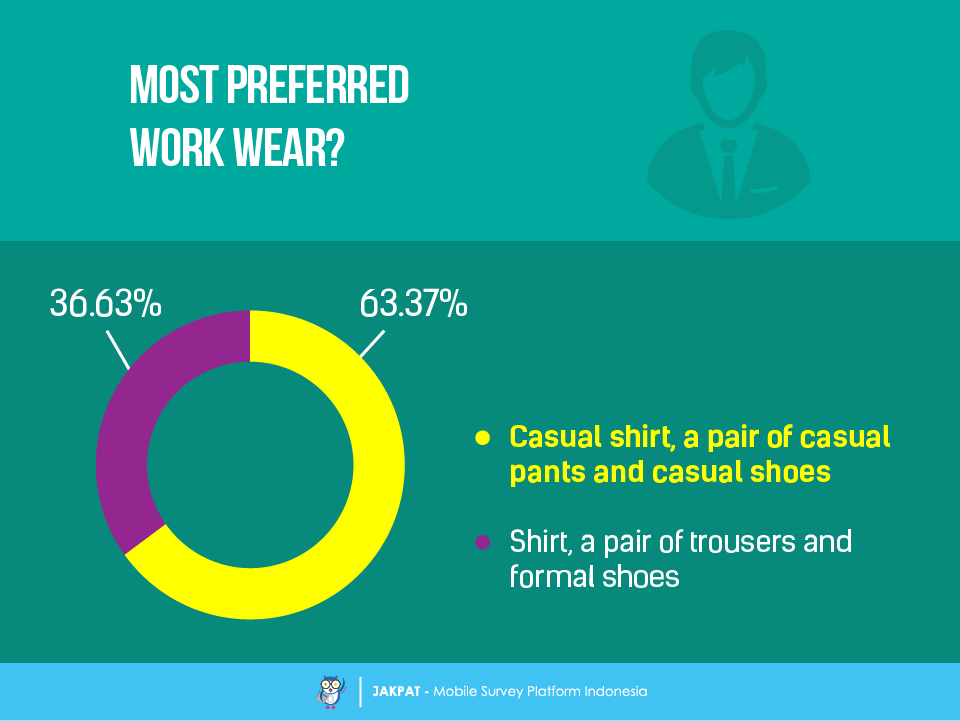
How about the work wear? We found out that the majority of the respondents (63.37%) prefer a work wear that consists of casual shirt, a pair of casual pants and casual shoes. The rest of the respondents (36.63%) prefer shirt, a pair of trousers and formal shoes for work wear.
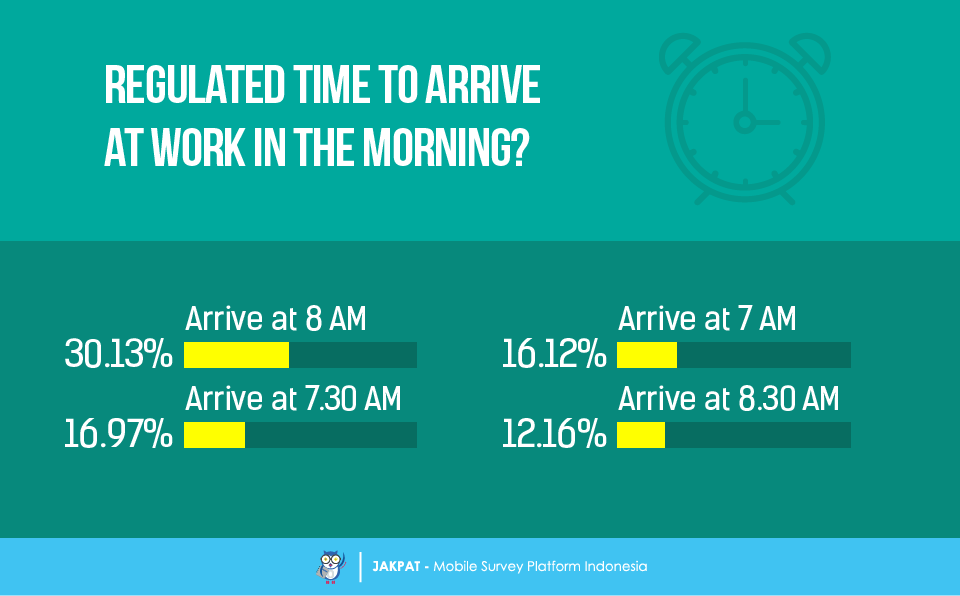
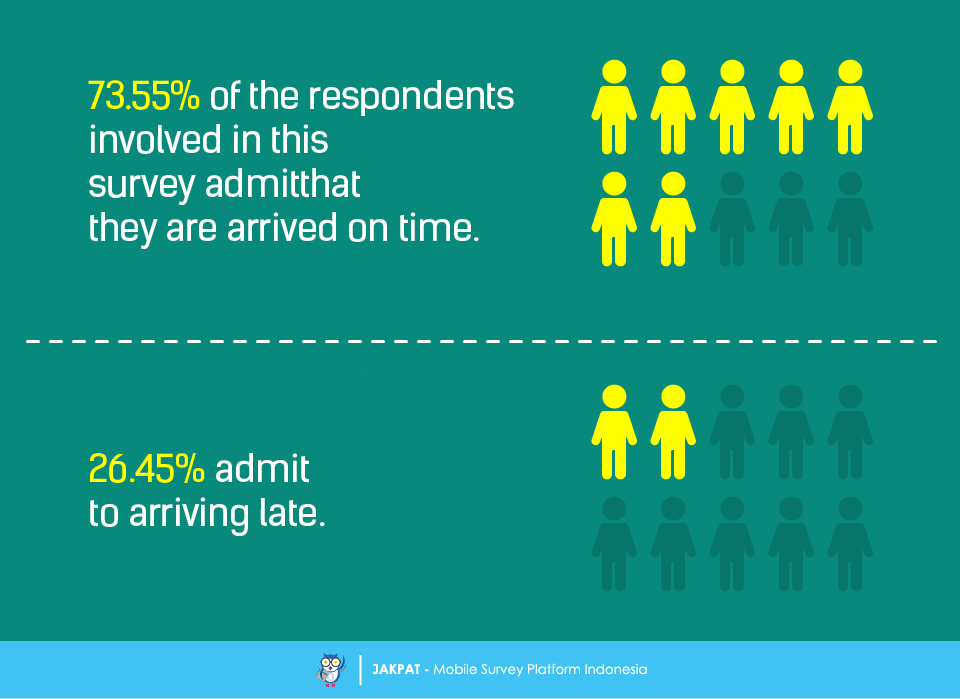
We are moving on to the time when the respondents are regulated to arrive at work. We asked what time they normally arrive at work. 30.13% said they arrive at 8 AM. 16.97% said 7.30 AM. 16.12% said 7 AM. Lastly, 12.16% of the respondents said they arrive at 8.30 AM. Of all respondents, 73.55% admitted that they arrive at work on time. 26.45% arrive late.
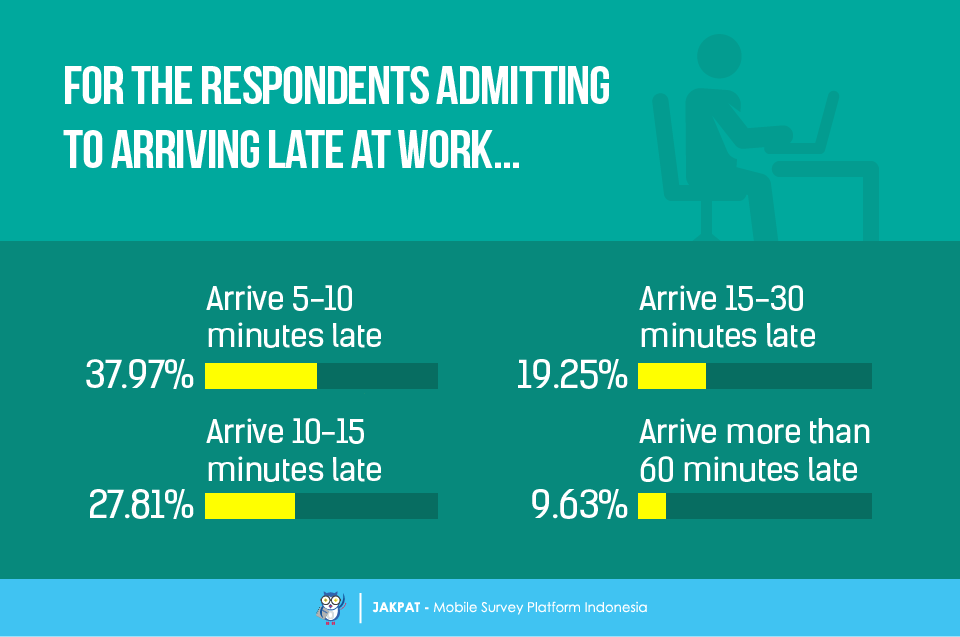
For those who admitted to arriving late at work, 37.97% said they arrive 5-10 minutes late. 27.81% arrive 10-15 minutes late. 19.25% arrive 15-30 minutes late. Then, 9.63% arrive more than 60 minutes late.
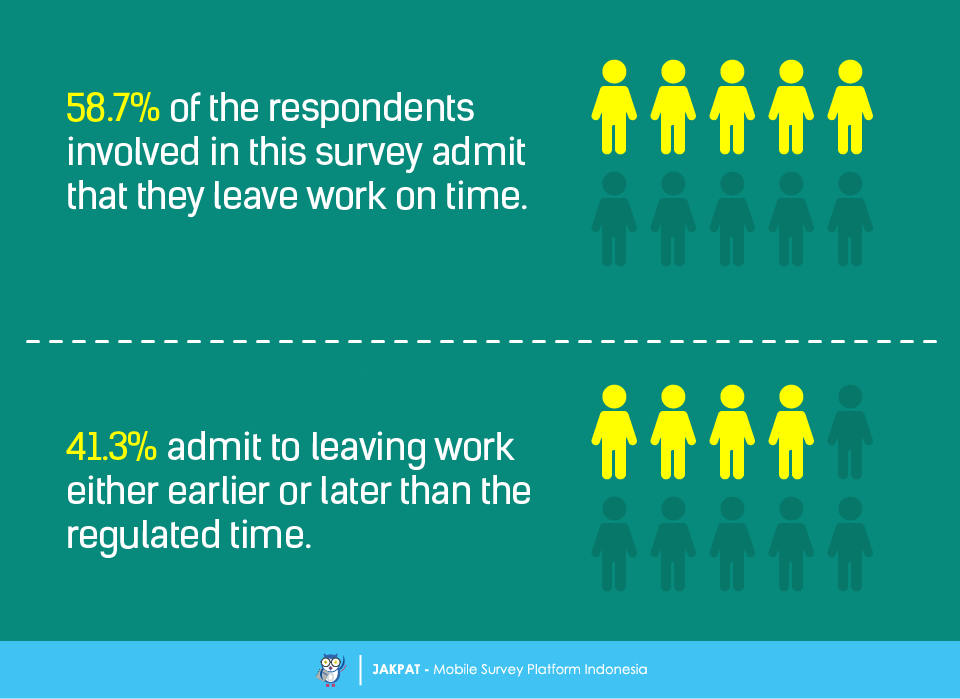
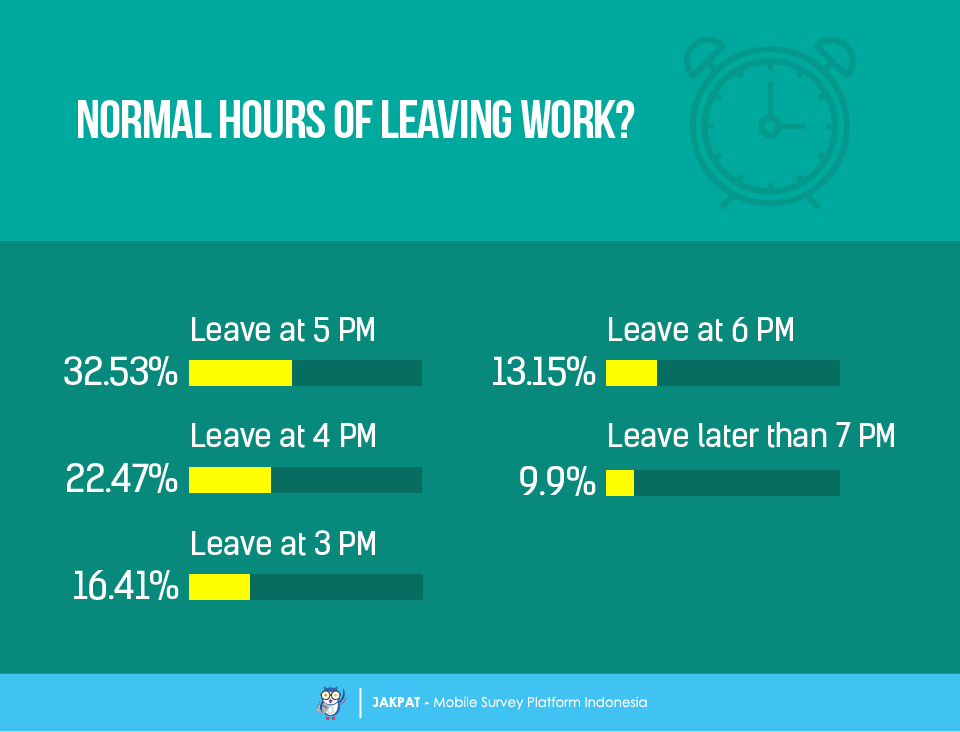
We then wanted to know about the leaving hour. 58.7% of the respondents said that they leave work on time, and 41.3% admitted otherwise. The respondents then admitted that they leave work mostly at 5 PM according to 32.53% of them. 22.47% said to leave work at 4 PM. 16.41% said to leave at 3 PM. 13.15% said to leave at 6 PM. Then, 9.9% leave work later than 7 PM.
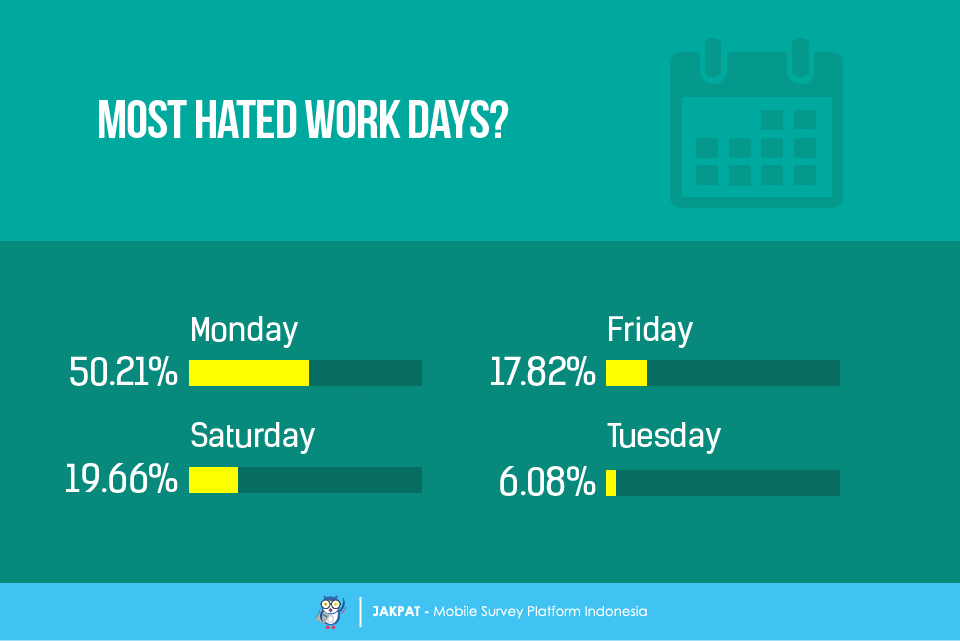
It seems that Monday really is the most hated day of all weekdays or working days. At least 50.21% of the respondents agree with that. 19.66% said to hate Saturday. 17.82% said to hate Friday. Then, 6.08% said to hate Tuesday.
Sometimes either rat work or outside working hours we are demanded to do work related tasks. We asked the respondents about that, too. 56.29% of the respondents agreed that they are often demanded to do work outside working hours. 43.71% admitted to not often being demanded to do work outside working hours.
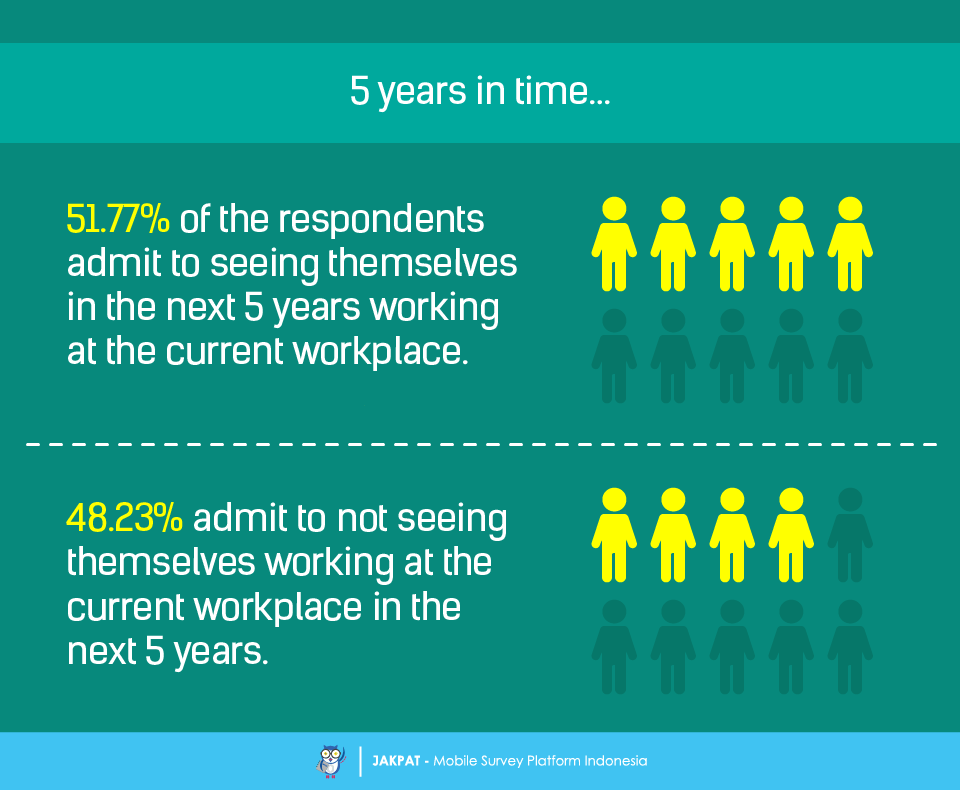
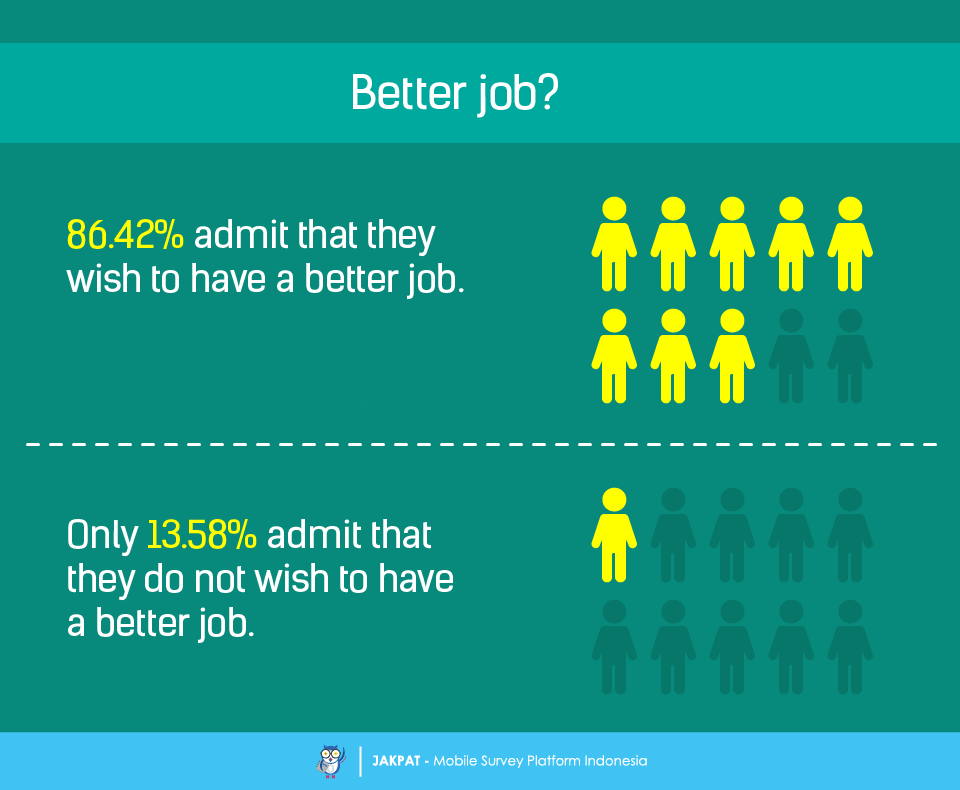
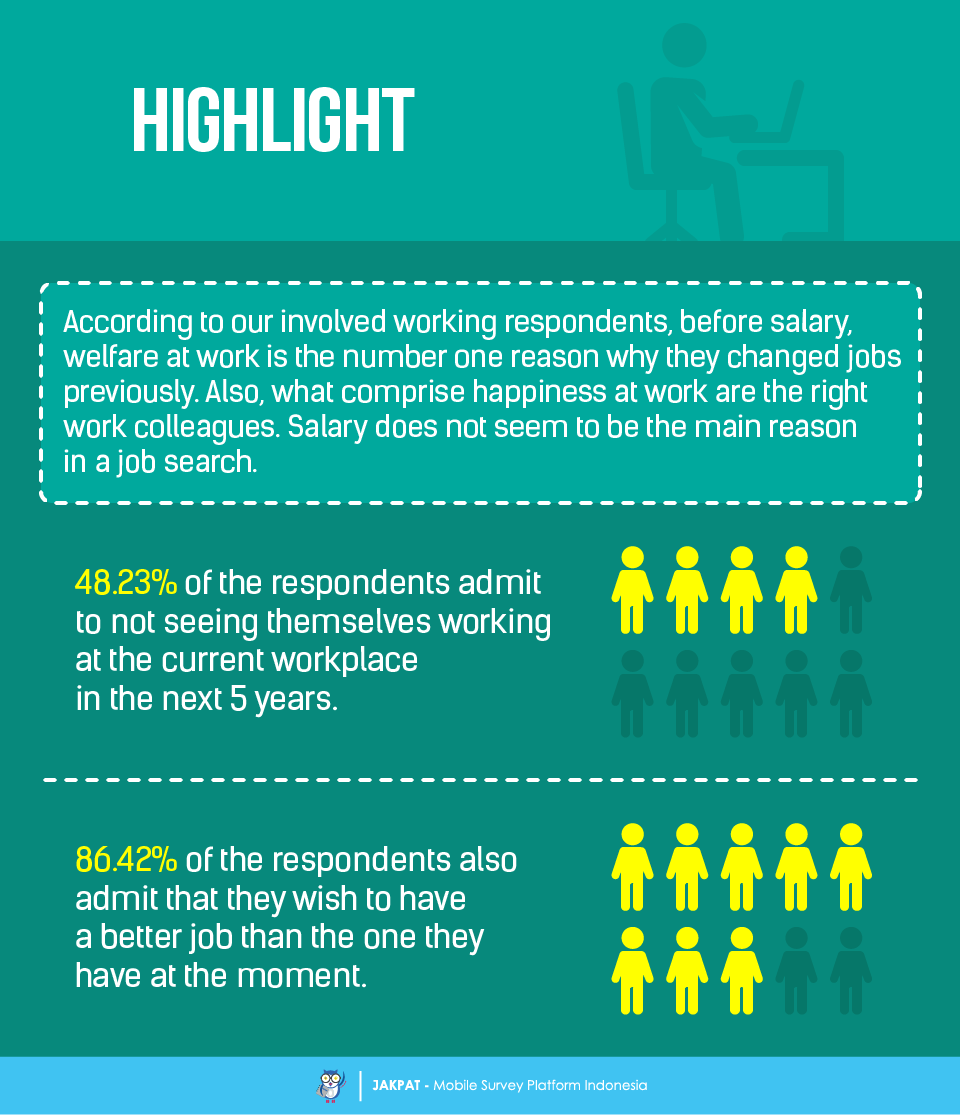
To end this article we asked the respondents involved in this survey about their view in the future. First question was about what would happen in the next 5 years of time career-wise. 51.77% of the respondents admitted to seeing themselves in the next 5 years still working at the current workplace, while 48.23% admitted otherwise. Last question, do they wish to have a better job? Surprisingly, 86.42% admitted that they do wish to have a better job, as opposed to 13.58% of those who thought otherwise.
For more detail you can download XLS report at the button below (bahasa). JAKPAT report consists of 3 parts which are 1) Respondent Profile, 2) Crosstabulation for each question and 3) Raw Data. Respondent profile shows you demographic profiles ( gender,age range, location by province, and monthly spending). Cross tabulation enables you to define different demographic segment preference on each answer.
![]()
You can also download PDF here:
![]()

or Get A Sales Quote by filling this form or Call to +622745015293
