


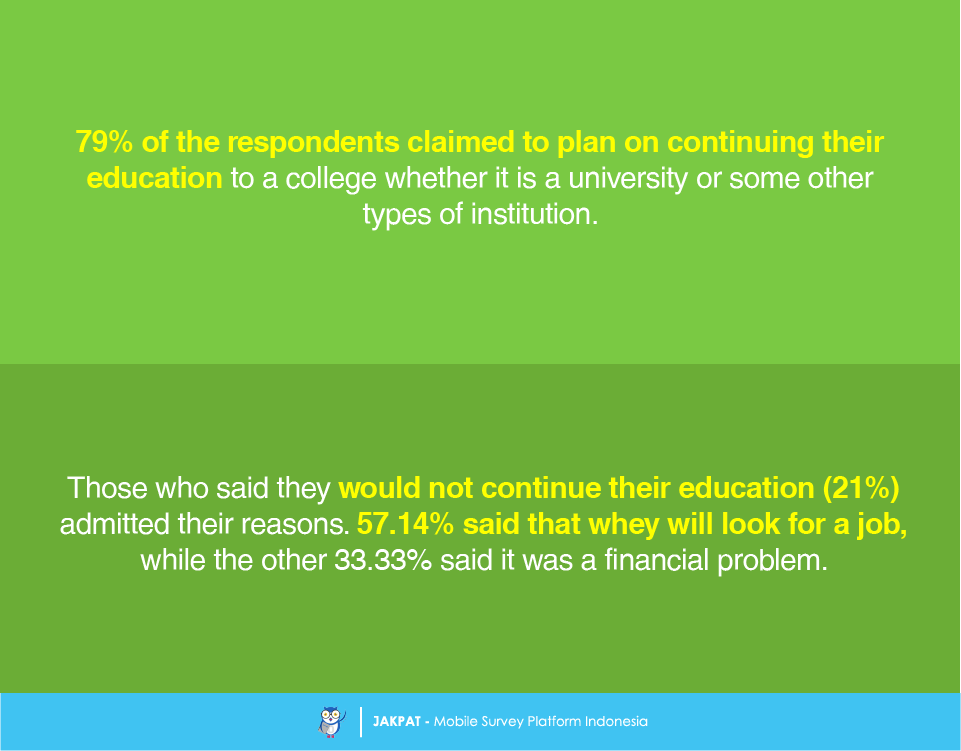
One of the most exciting moments in life is probably when High School has ended. We wanted to know what our respondents in the age range of common high school graduates would do afterwards. We assumed every high school student would continue to college. We were wrong by a few percent of people. 79% of the respondents claimed to continue to college, yet the rest (21%) do not plan on continuing. Looking for a job was voted to be the number one reason (57.14%). Another reason is down to a financial problem (33.33%). It is rather an ironic fact to find how some group of our next generation still financially cannot go to college to continue their education.
Now we are focusing on the respondents who are actually going to college. At first we asked what sources of information they used to study or do some researches on the college of their interest. The majority of the respondents (85.57%) claimed to use the Internet. Other means include relying on their friends or relatives for the college information (47.59%), education fairs (34.94%), visiting the college in person (27.34%), printed newspaper (13.16%), and a phone call to the college (6.08%).

There are generally two types of college, public college and private college. We found that majority of the respondents showed more interest in public colleges (80.76%) before private ones (19.24%).

Now how about their way of getting into the college: scholarship or no scholarship? The majority of the respondents (58.23%) admitted that they aim for a scholarship while the other 41.77% aims for self-financing.

Speaking of those who are aiming for scholarships, we wanted to know their sources of scholarship. Most of the respondents look for an aid from the government (48.26%). Some look for an aid from the college of interest (41.3%). Some others look for an air from a funding corporation (10.43%).

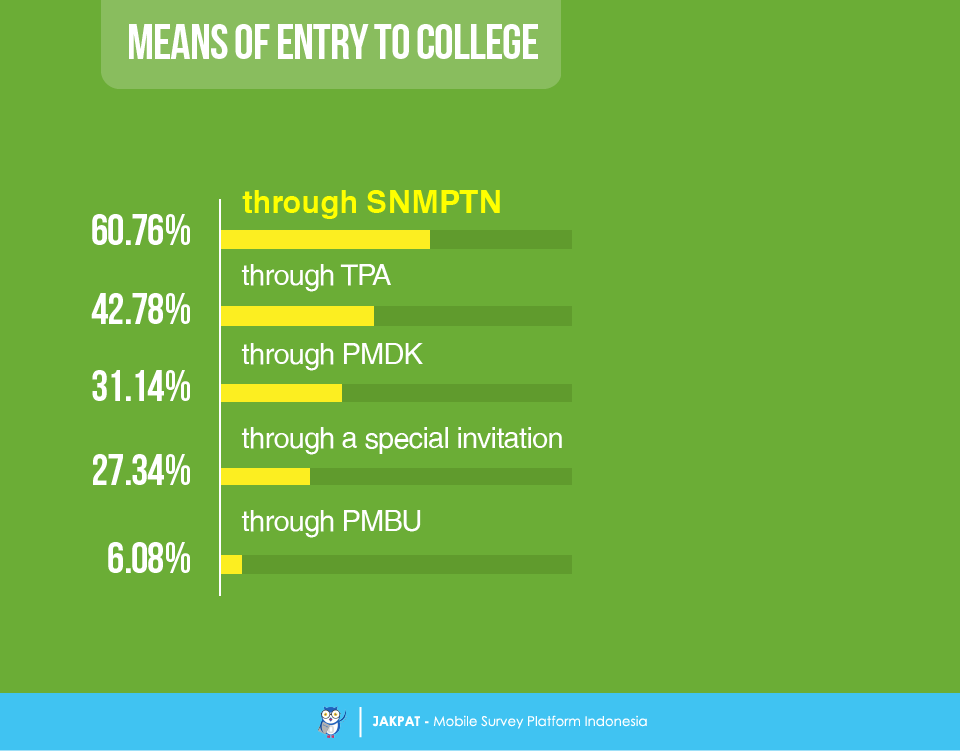
Still in the talk of getting the respondents’ way into the college, the majority of the respondents (60.76%) use the option of SNMPTN (Seleksi Nasional Masuk Perguruan Tinggi Negeri/National Selection of Entering Public College). 42.78% get in through TPA (Tes Potensi Akademik/Academic Potential Test). 31.14% get in through PMDK (Penelusuran Miinat Dan Kemampuan). 27.34% get in through a special invitation from the college. Lastly, 6.08% get in through PMBU (Penelusuran Minat dan Bibit Unggul).
We have been mentioning the word college but have not yet made a list of specification of the colleges themselves. We asked the respondents for what type of college they try to apply. 66.84% of the respondents admitted to going to a university. 10.63%, going to a polytechnic. 8.35%, going to a college (sekolah tinggi). 7.85%, going to an institute. Lastly, 6.33%, to an academy.

84.3% of the respondents will take a bachelor degree (S1). The rest of the answers focuses on the diploma levels: Diploma 3 (9.87%), Diploma 1 (3.29%), Diploma 4 (1.52%), and Diploma 2 (1.01%).

We also asked the respondents about the location of the college of their interest or choice. Most of the respondents (57.97%) said that they do not mind exiting their hometown for college even though there is a far distance between the two towns. 22.78% said they actually mind exiting their hometown for college and look for a college that is located in the same town as theirs. 19.24% said they do not mind exiting the hometown as long as the location or town where the college is located is not too far from where they originate.

We are now moving on with the major of choice or interest. 79.24% of the respondents admitted to take a major that is in line with theirs in high school. In addition to that, 79.95% of the respondents take a major that becomes a passion of theirs.

Taking a major requires determination. It is almost like a once-in-a-lifetime thing to choose. 53.92% of the respondents admitted that they are not influenced by other people when making a choice of a major they want to take. 38.23% of the respondents admitted that their parents or other family members have a role in the processing of choosing a major. Lastly, 5.57% claimed to have an influence from friends.

To end this article, lastly we wanted to know what program the respondents take. Nowadays there are colleges that offer both regular programs and international programs for some majors. We found that most of the respondents (85.57%) take a regular program as opposed to those who take an international program (14.43%).
For more detail you can download XLS report at the button below (bahasa). JAKPAT report consists of 3 parts which are 1) Respondent Profile, 2) Crosstabulation for each question and 3) Raw Data. Respondent profile shows you demographic profiles ( gender,age range, location by province, and monthly spending). Cross tabulation enables you to define different demographic segment preference on each answer.
![]()
You can also download PDF here:
![]()

or Get A Sales Quote by filling this form or Call to +622745015293
