

There are many places where you can go shopping to add new gadgets to your collection. You can choose to go to a store where you can see and feel the product in-person. These days, you can purchase anything online too. With a few clicks, your new purchase could be on its way to you, and you don’t even have to get out of the house.
Recently, JAKPAT conducted a survey asking folks who have shopped online before about their next gadgets purchase. This survey was followed by 521 respondents, and here are the results.
An overwhelming percentage of people (86.76%) buy their gadgets at a store. Only 13.24% have bought gadgets online previously.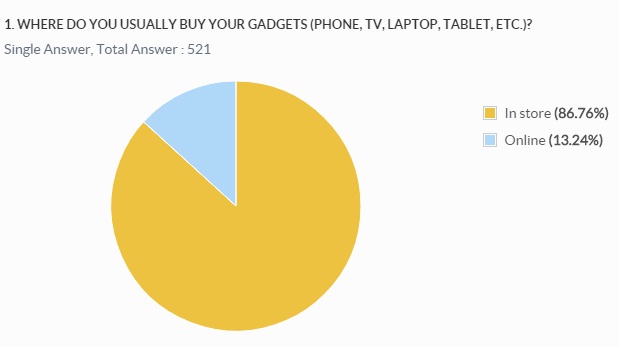
Similarly, when asked where they plan to purchase their next gadget, the vast majority (82.92%) stated that they will purchase it at a store versus 17.08% who plan to purchase online.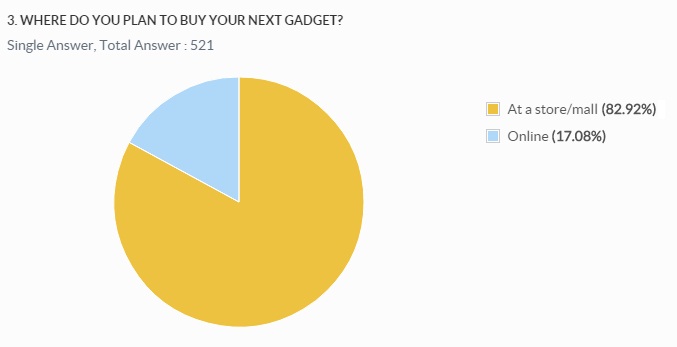
Looking at a gender breakdown, males are slightly more likely to make online purchases (21.4% vs. 7.52%).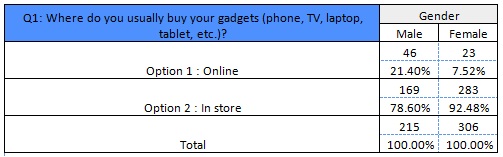
This also holds true for future purchases where 27.91% of males plan to shop online compared to 9.48% of female respondents.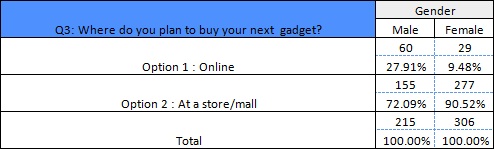
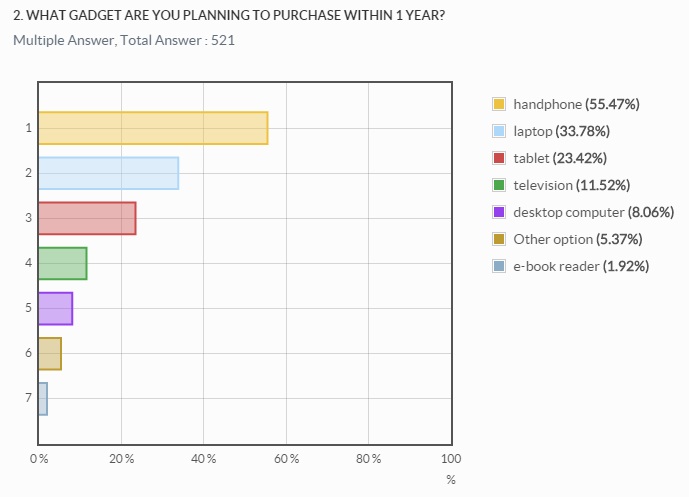
We asked people what gadget they plan to purchase within a year, and more than half of the respondents (55.47%) said that they are in the market to purchase a new handphone. The second-most sought product is a laptop (33.78%) followed by a tablet (23.42%).
Before deciding to buy a product, people will research prices and features first. Most people (58.91%) will make a decision within a month of researching. Of this number, 35.89% will have decided what to buy within a week.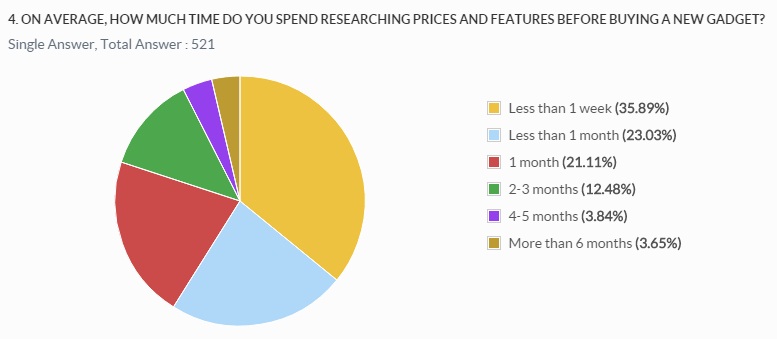
Finally, we wanted to know if our online shoppers try out the products in store first before purchasing them online. After all, there is no such ability to physically feel and assess the product when shopping online. Just a little more than half (56.18%) of those who will purchase their next gadget online stated that they plan to try the gadget in-store first.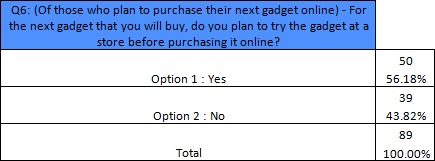
For more detail you can download XLS report at the button below. JAKPAT report consists of 3 parts which are 1) Respondent Profile, 2) Crosstabulation for each question and 3) Raw Data. Respondent profile shows you demographic profiles ( gendr,age range, locationby province, and monthly spending). Cross tabulation enables you to define different demographic segment preference on each answer.
![]()
Click the icon to download XLS report
And also PDF Report here:
If you’re interested to do survey on retail and consumer goods field toward our respondents, we have over 23,000 mobile respondents ranged from age 17-50 years old, smartphone active users, and located in all regions of Indonesia that has installed our app and readily answering your survey. Those 23,000 respondents has been verified, profiled, and continuously tracked to make sure you get the updated profiles of them. Our respondents has been profiled based on their demographic (age,gender,location, spending level, profession,religion), lifestyle habit (smoking/non, gamers/non, wearing glasses/non, frequent flyer/non, online shopper/non), and also brand consumption level ( brand A users, brand B users in FMCG, Retail, E-commerce,etc).
If you want to do research toward our respondent, please signup here and directly create your survey there. Or directly contact our Bizdev - Chrisprastika at +62-878-3908-9833. To non-Indonesian client, we offer free translation from foreign languages includes English, Chinese,Hindi,etc.