

Smartphone is not just a means for communicate but also a easiest way to find information. Why? It’s on your fingertips , connected, and can get you a quick information in just minutes with a search.
This time, JAKPAT wants to investigate how in store shoppers use their smartphone to help them shop in-store. This survey is participated by 4554 smartphone users that using JAKPAT Mobile Apps.
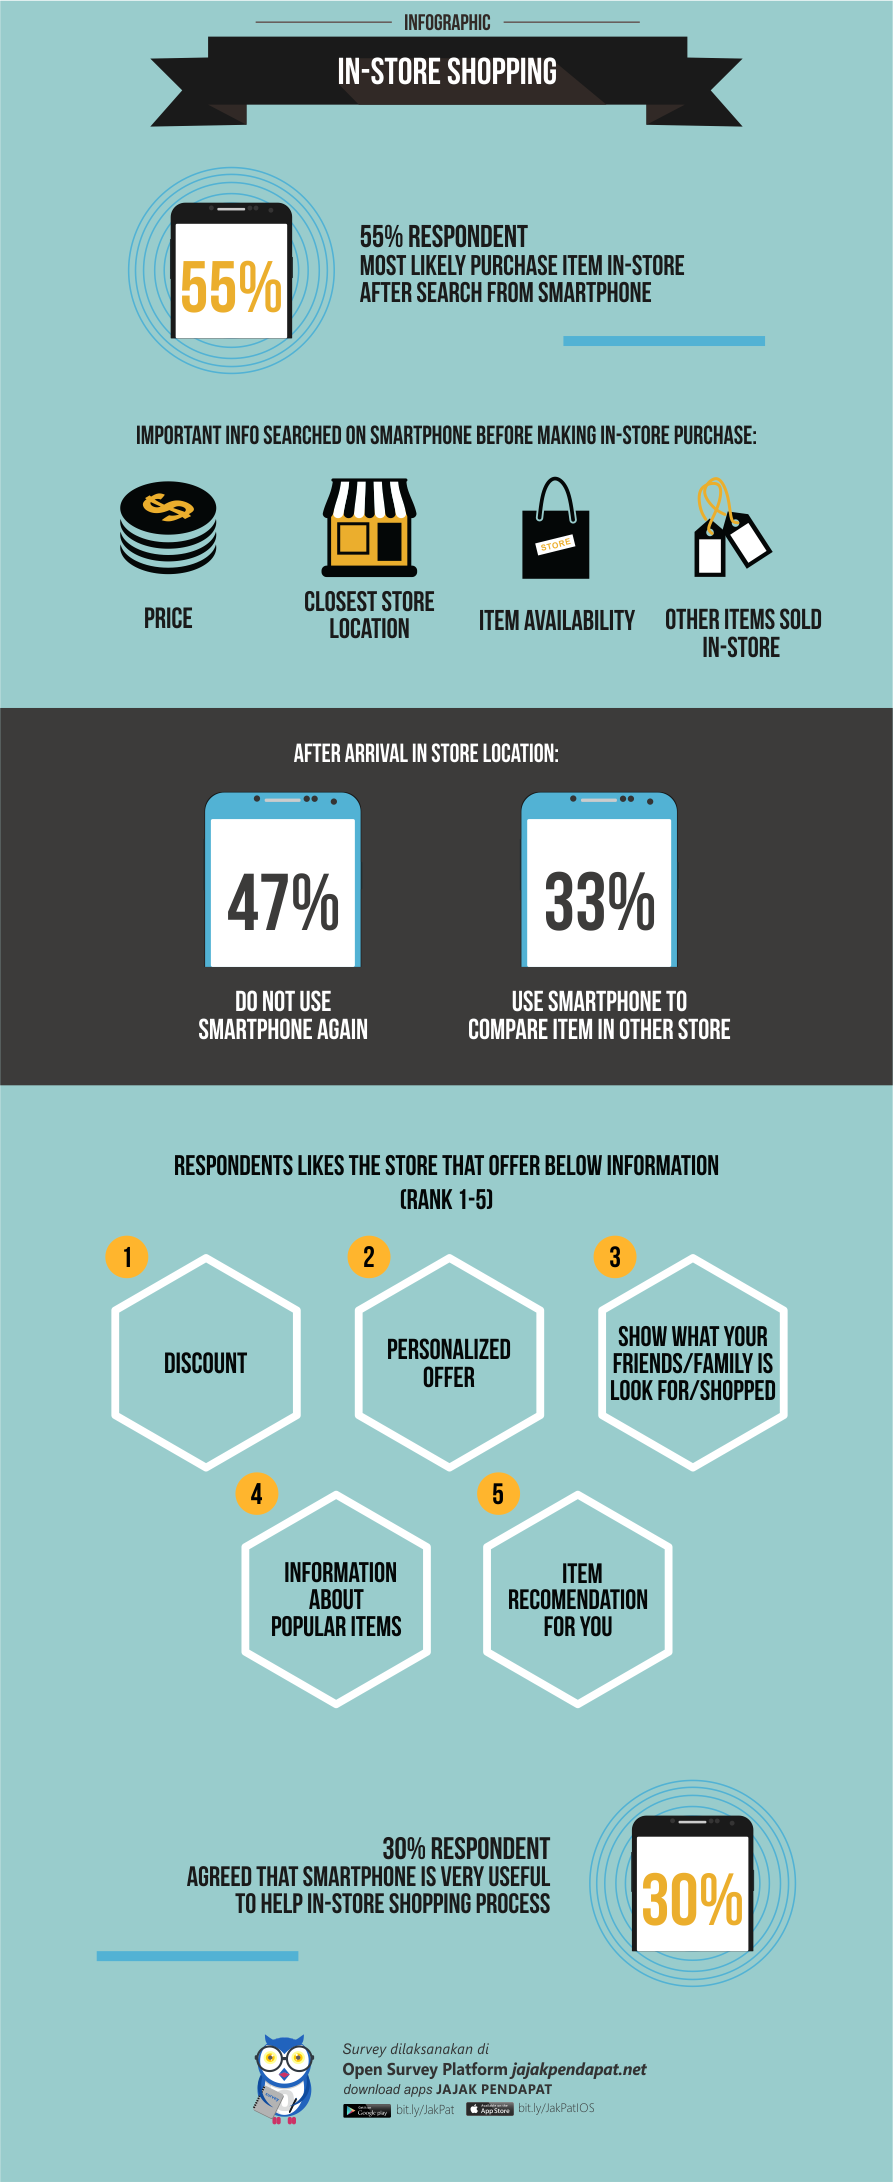
Below Infographic summarize the result :
HOW LIKELY RESPONDENTS BOUGHT THINGS ONLINE VS VISIT STORE AFTER THEY BROWSE FROM THEIR SMARTPHONE
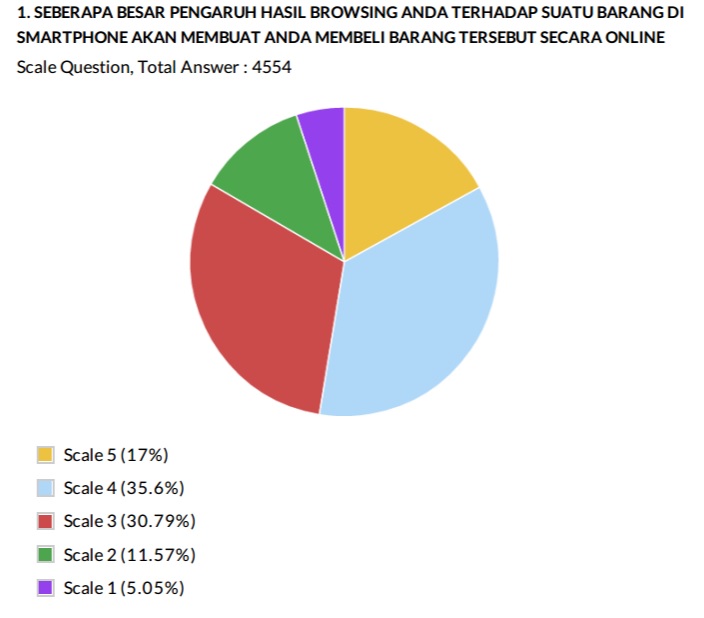
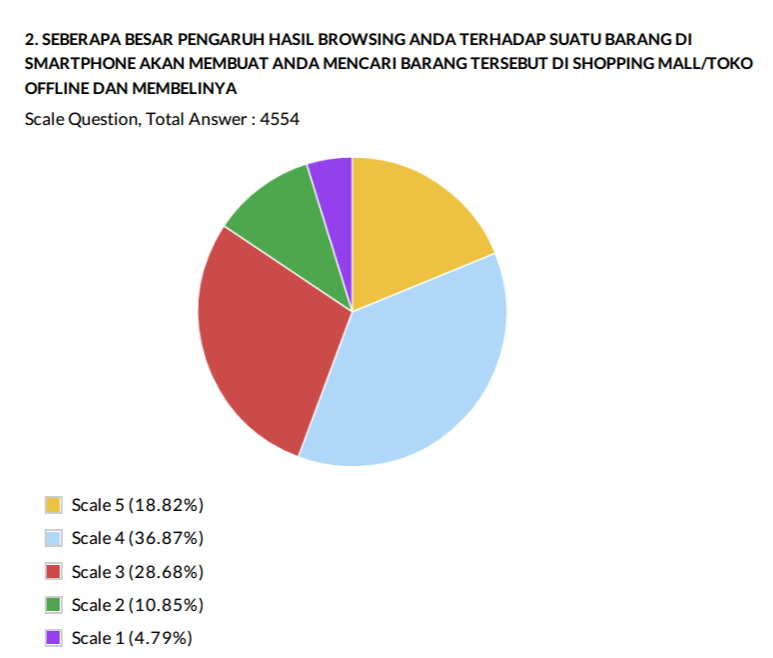
Comparing the two results, in the scale 1-5 the likeliness between the intention on purchasing online and purchasing things in-store after browsing or searching information from their smartphone is almost at the same level. After browsing and searching information, respondents are most likely to purchase the things online or visit the store to shop the things.
STORE LOCATION IS NOT THE ONLY IMPORTANT INFORMATION
We also asked if they found the store address , how likely they would straight go to the store.
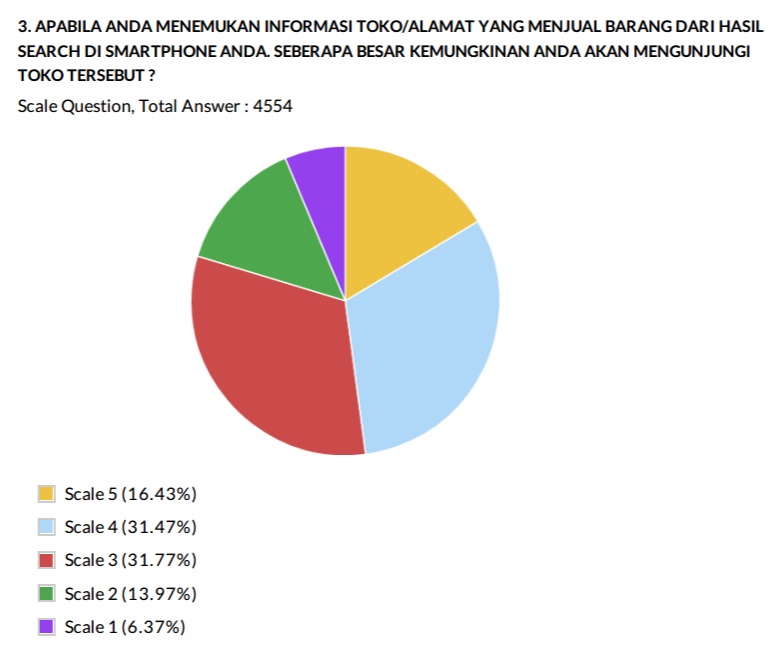
Most respondents answers between neutral to most likely. It means that there are other information they look at and probably more important than just the store address that will affect their visit/purchase intention to the store.
OTHER IMPORTANT INFORMATIONS THEY SEARCH ON THEIR SMARTPHONE ARE…
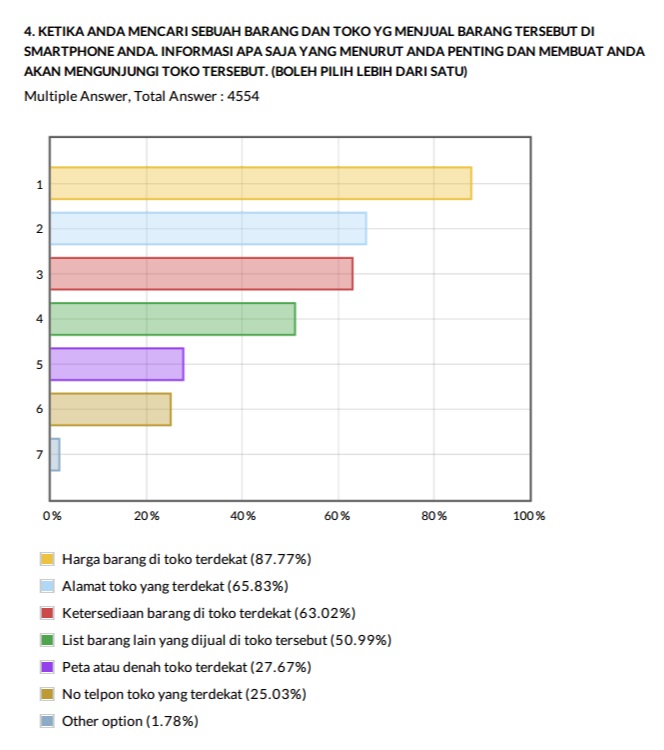
We then asked respondents about what are other informations they thought are most important when searching things before they shop in store. It turns out that store address ranked no.2, and no.1 is price. Respondents tends to search the price of the things they want to shop first and compare the price in other store before they look for the adress. Other important information to be noted are the item availability and other items that sold in the store. So respondents also have the thought to purchase other stuff while visiting the store to purchase the main item. There a might also a risk when respondents thinks that they can only buy the main item, they might want to delay the visit. But then, it’s just our guess ![]()
In the other option, most mentioned informations that they type on the open questions are discount, review, and item quality.
WHEN SHOPPING IN-STORE , DO YOU STILL SEARCH ON YOUR SMARTPHONE?
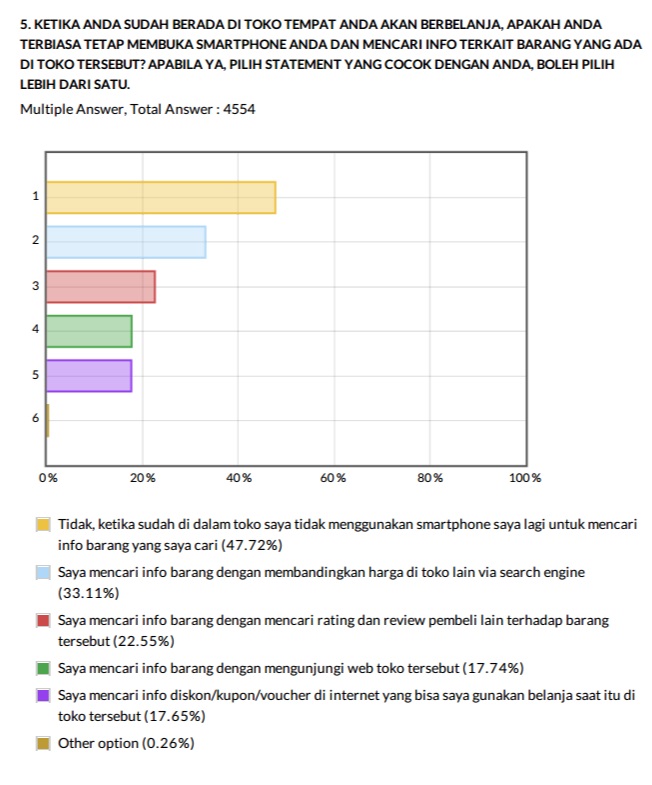
Though 47.72% says No. But the rest do.
- 33.11% Compare the item price in other store
- 22.55% Looking for ratings and review while shop in store
- 17.74% Visiting the store website
- 17.65% Looking for coupon/discount of the store in the internet.
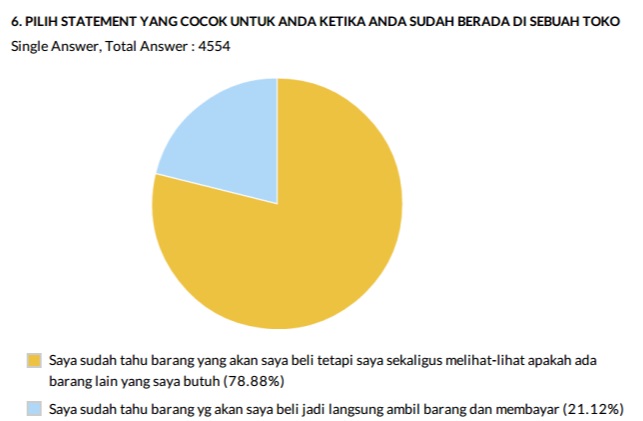
78%+ IS LOOKING FOR OTHER ITEM THAT CAN BE BOUGHT WHILE SHOPPING IN STORE
FAVORITE SERVICE OFFERS BY STORES
Within the matrix question, we asked respondent rate 1-5 favoriteness for some services that offers by the store while their looking at items to their smartphone. Here are the most favorite service offered by the store ranked by the favoriteness order below :
- Discount
- Personalized Offer
- Show what your friends/family is look for/shopped
- Information about Popular Items
- Item Recomendation for you
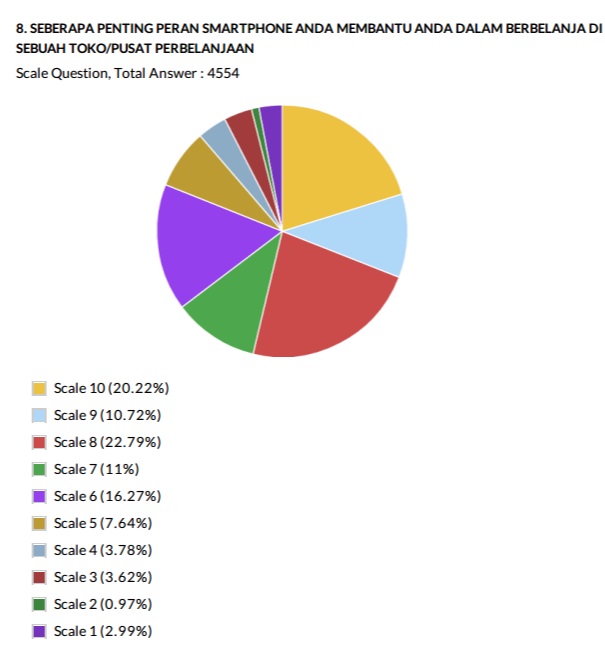
IS YOUR SMARTPHONE HELPFUL TO GUIDE YOU SHOP INSTORE?
Reference:
http://www.google.com.au/think/research-studies/mobile-in-store.html
For more detail you can download XLS report at the button below. JAKPAT report consists of 3 parts which are 1) Respondent Profile, 2) Crosstabulation for each question and 3) Raw Data. Respondent profile shows you demographic profiles ( gendr,age range, locationby province, and monthly spending). Cross tabulation enables you to define different demographic segment preference on each answer.
![]()
Click the icon to download XLS report
and Download PDF here:
If you’re interested to do survey on retail and consumer goods field toward our respondents, we have over 31,000 mobile respondents ranged from age 17-50 years old, smartphone active users, and located in all regions of Indonesia that has installed our app and readily answering your survey. Those 31,000 respondents has been verified, profiled, and continuously tracked to make sure you get the updated profiles of them. Our respondents has been profiled based on their demographic (age,gender,location, spending level, profession,religion), lifestyle habit (smoking/non, gamers/non, wearing glasses/non, frequent flyer/non, online shopper/non), and also brand consumption level ( brand A users, brand B users in FMCG, Retail, E-commerce,etc).
If you want to do research toward our respondent, please signup here and directly create your survey there. Or directly contact our Bizdev - Chrisprastika at +62-878-3908-9833. To non-Indonesian client, we offer free translation from foreign languages includes English, Chinese,Hindi,etc.