

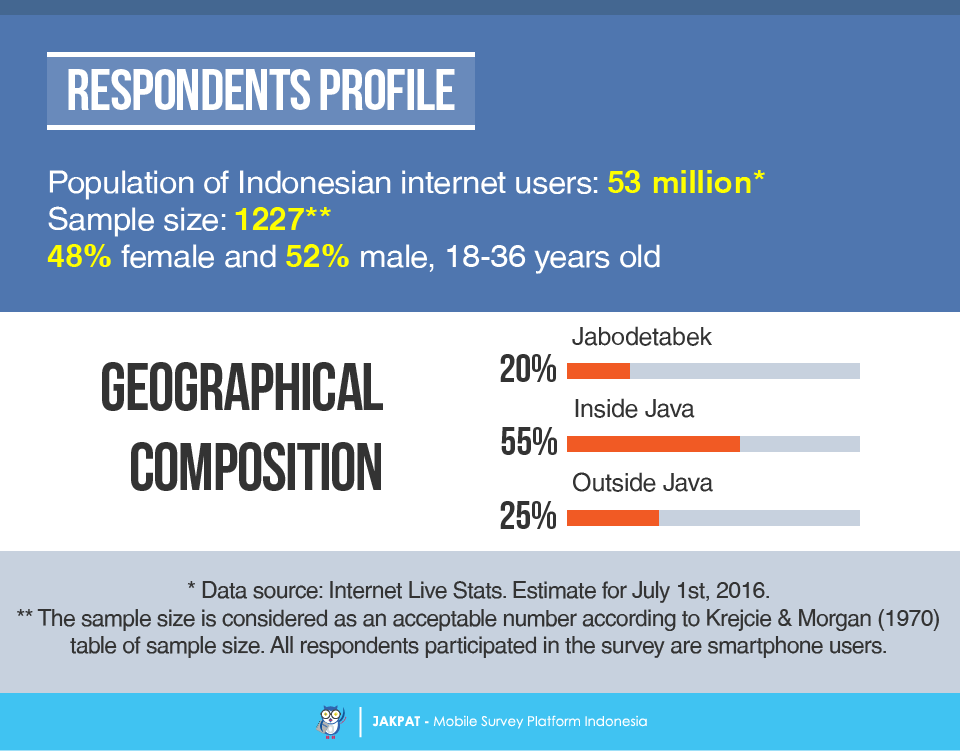
Following the previous survey report on Indonesian millennials’ habit and preferences in having their breakfast[1], we would like to explore more regarding to the generation’s eating pattern. After understanding what and how they eat in the morning, what about how it goes at night? Therefore, recently Jakpat has conducted a survey in order to see the habit and preferences of Indonesian millennials regarding to having a dinner in their everyday life. This survey involved 1227 respondents from across Indonesia. For the further notes, Jakpat’s respondents in this survey are Indonesian smart-phone users, with a range of age from 18 to 36 year-old, as we use the birth years ranging from the early 1980s for millennials generation in this survey.
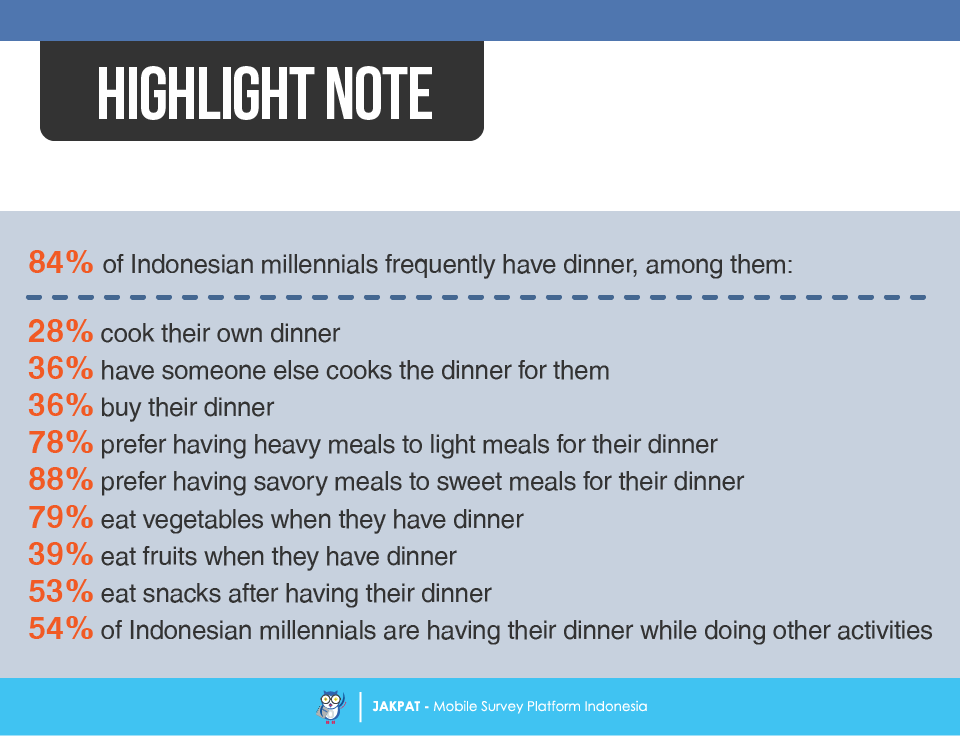
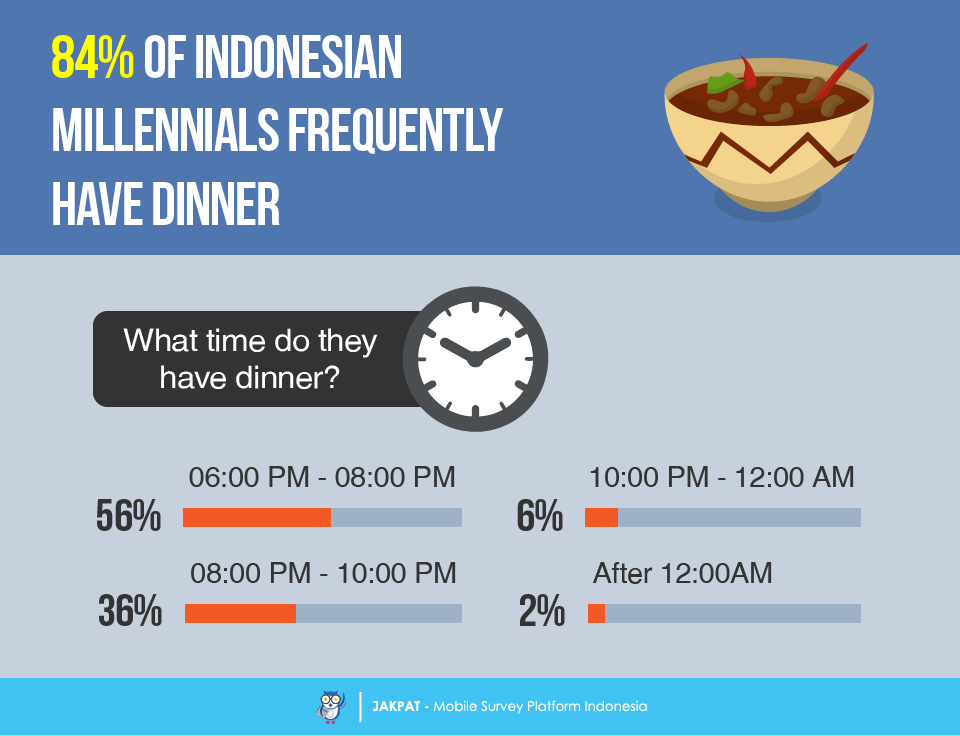
First of all, we found out that most of our respondents (84%) admit that they usually have dinner. More than half of them (56%) often have dinner in between 06:00pm to 08:00pm, while there are some of them who have it in between 08:00pm to 10:00pm. Henceforth, there are 6% of them who usually have dinner in between 10.00pm to 12:00am, which is considered as late for a supper. There are even 2% of them who admit that they often have dinner after midnight.
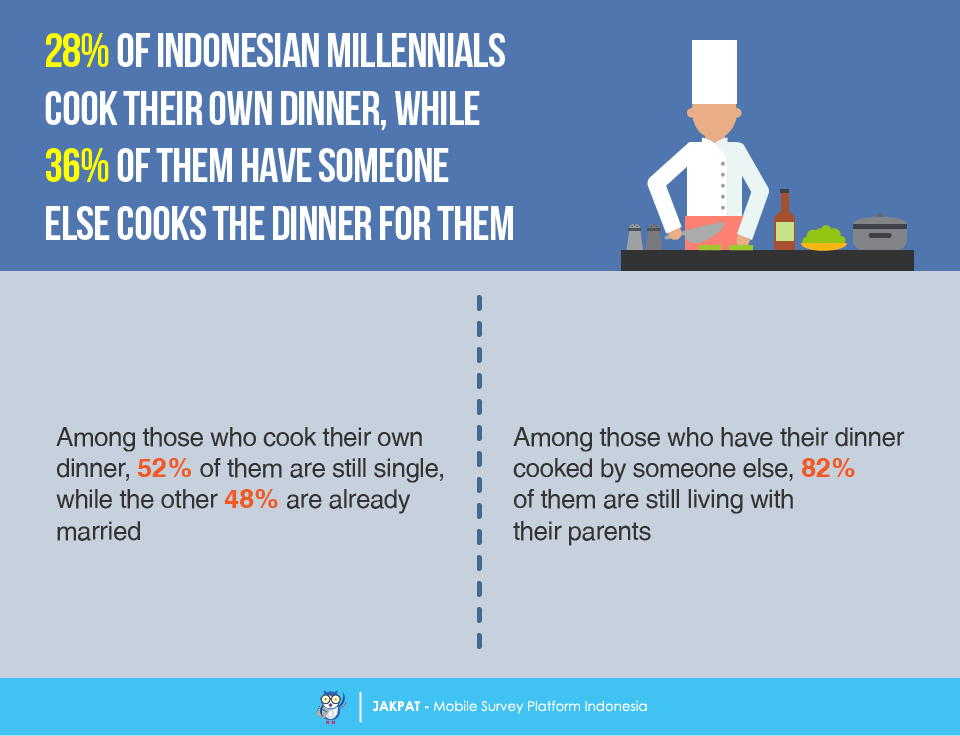
Regarding to how Indonesian millennials got their food for dinner, apparently there are some of our respondents (26%) who usually cook their own dinner. On the other hand, some of them (36%) have their dinner cooked by someone else. Women are more likely than men to cook their own dinner (58% VS 42%), while there are more people who are single who cook their own dinner than people who already got married (52% VS 48%). Besides, men are more likely than women to have other people cook the dinner for them (59% VS 41%), while there are more people who still live with their parents who have their dinner cooked for them than people who live alone (82% VS 18%).
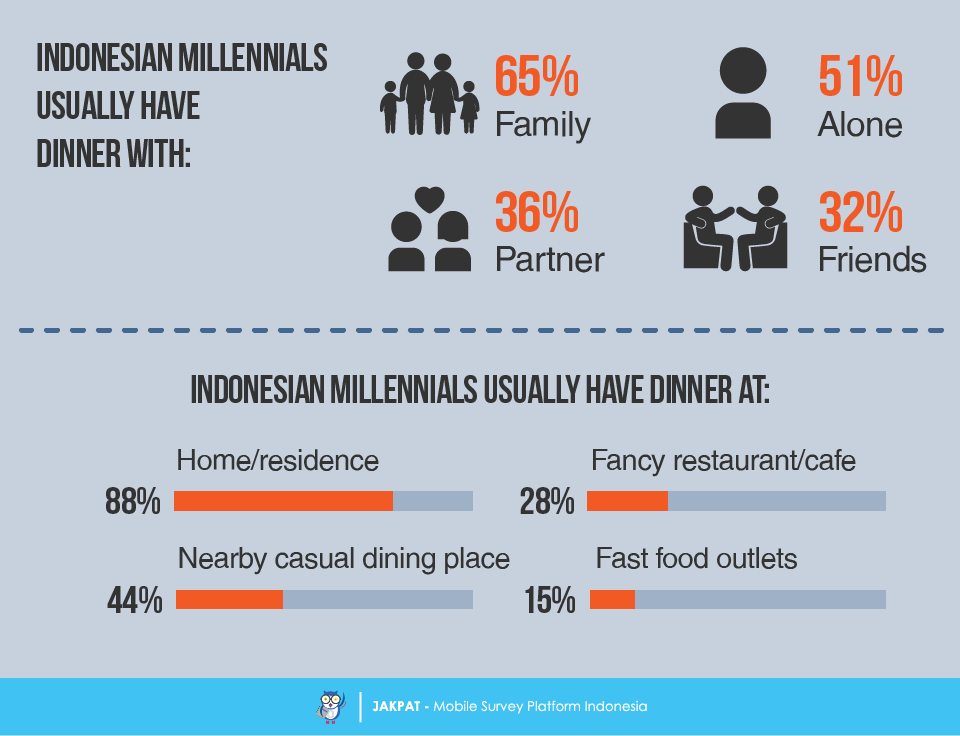
When asked about whom Indonesian millennials often have their dinner with, most of our respondents (65%) admit that it’s the family, while more than half of them (51%) frequently have dinner alone by themselves. In addition, there are 36% of our respondents who usually have dinner with their partner, while 32% of them usually have it with their friends. Subsequently, regarding to the place where Indonesian millennials usually have their dinner, apparently most of our respondents (88%) have it at their own house or residence, while there are some of them (44%) who often have dinner at a casual dining place near their house or residence. Moreover, there are 28% of our respondents who admit that they usually have dinner at a fancy restaurant or cafe, while 15% of them often got their dinner from a fast food outlet.
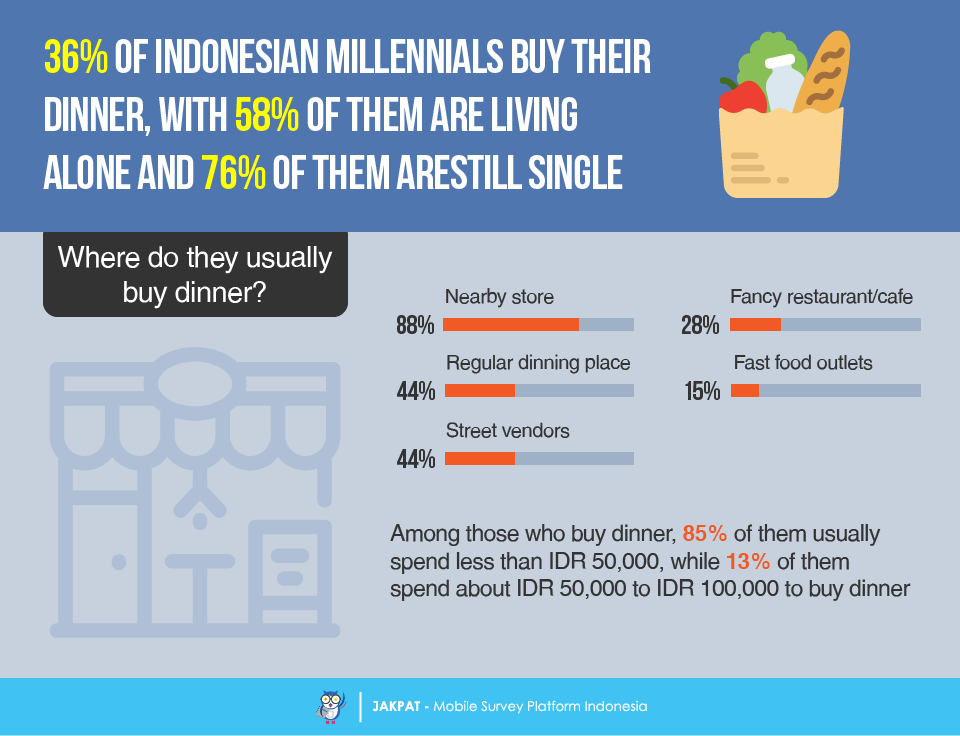
Regarding to the activity of buying the food for dinner, apparently some of our respondents (36%) admit that they usually buy the food for their dinner. People who live alone are more likely to buy their dinner than people who still live with their parents (58% VS 42%), while there are more people who are single who often buy their dinner than people who already got married (76% VS 23%). Henceforth, there are top five most favorite place to buy the food for dinner: (1) nearby store, as chosen by 79%, (2) regular dining place, as chosen by 55%, (3) street vendors, as chosen by 44%, (4) fancy restaurant or cafe, as chosen by 31%, and (5) fast food outlets, as chosen by 21%. Furthermore, most of our respondents (85%) admit that they usually spend less than IDR 50,000 to buy food for their own dinner, while there are 13% who spend about IDR 50,000 to IDR 100,000, and only 2% who spend more than IDR 100,000.
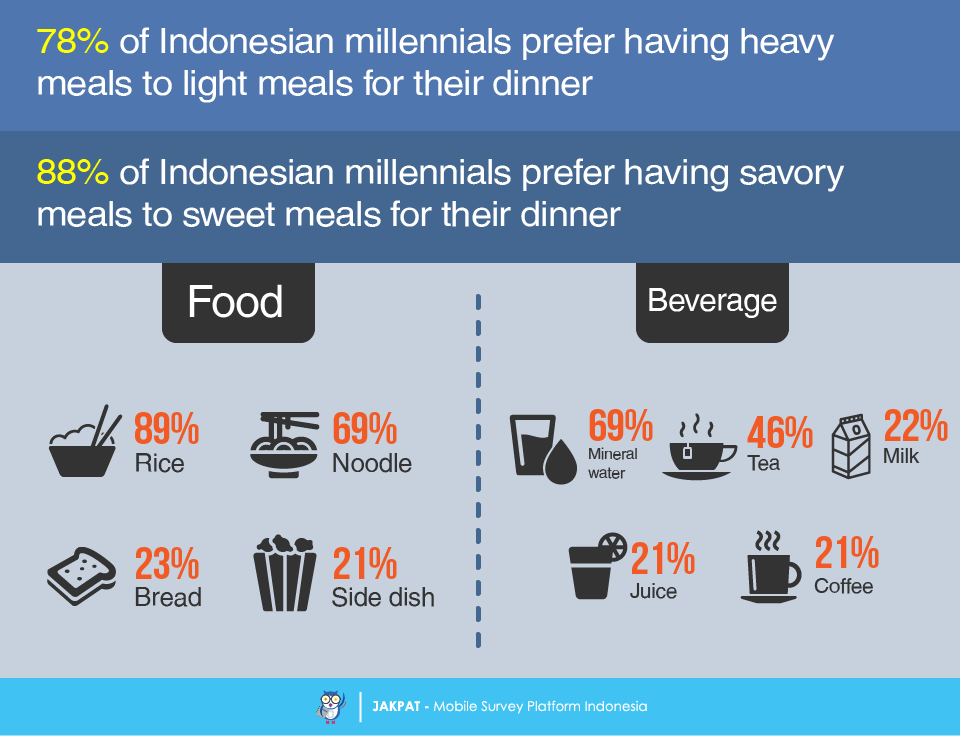
Next, regarding to the food preferences for dinner, apparently heavy meals are more preferable than light meals for dinner, as chosen by most of our respondents (78%). Concurrently, savory meals are more preferable than sweet meals for dinner, also as chosen by most of our respondents (88%). When asked about what kind of food Indonesian millennials usually eat for dinner, apparently most of our respondents choose rice (89%), while many of them choose noodle (69%). In addition, there are also some of them who choose bread (23%) and side dish only without any staple food (21%). As for the beverage they usually drink for dinner, apparently most of our respondents choose mineral water (90%), while less than half of them choose tea (46%). Furthermore, there are also some of them who choose milk (22%), juice (21%), and coffee (21%).
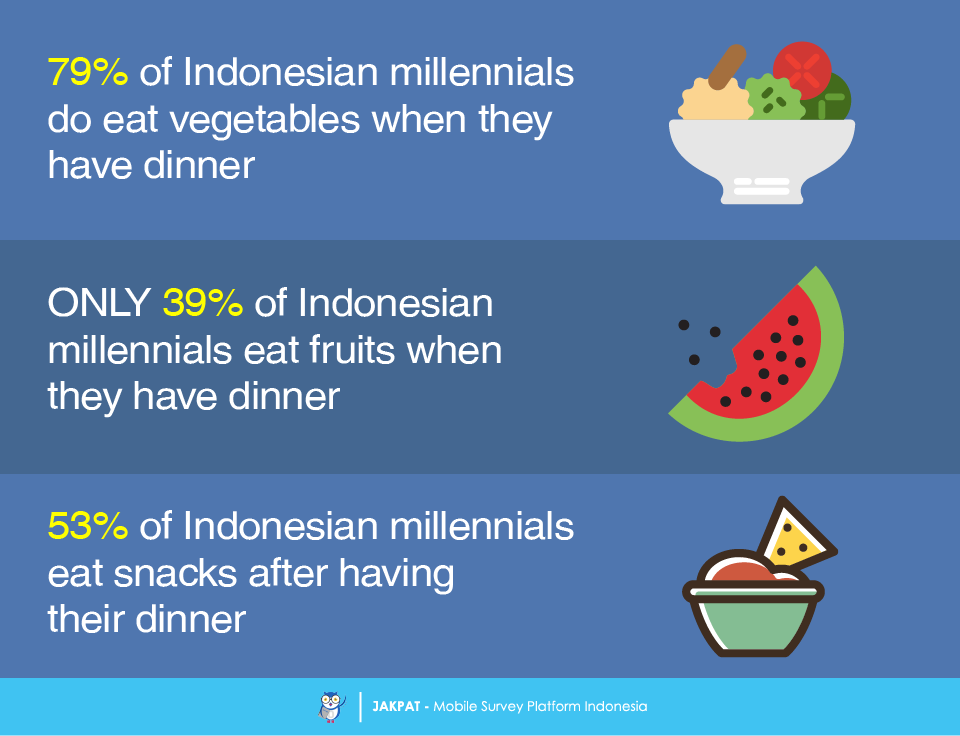
Regarding to some habits of having dinner, apparently most of our respondents (79%) admit that they eat vegetables when they have dinner. On the other hand, only some of them (39%) eat fruits when they have dinner. Women are more likely than men to eat fruits when having dinner (51% VS 49%), while men are more likely than women to eat vegetables when having dinner (52% VS 48%).
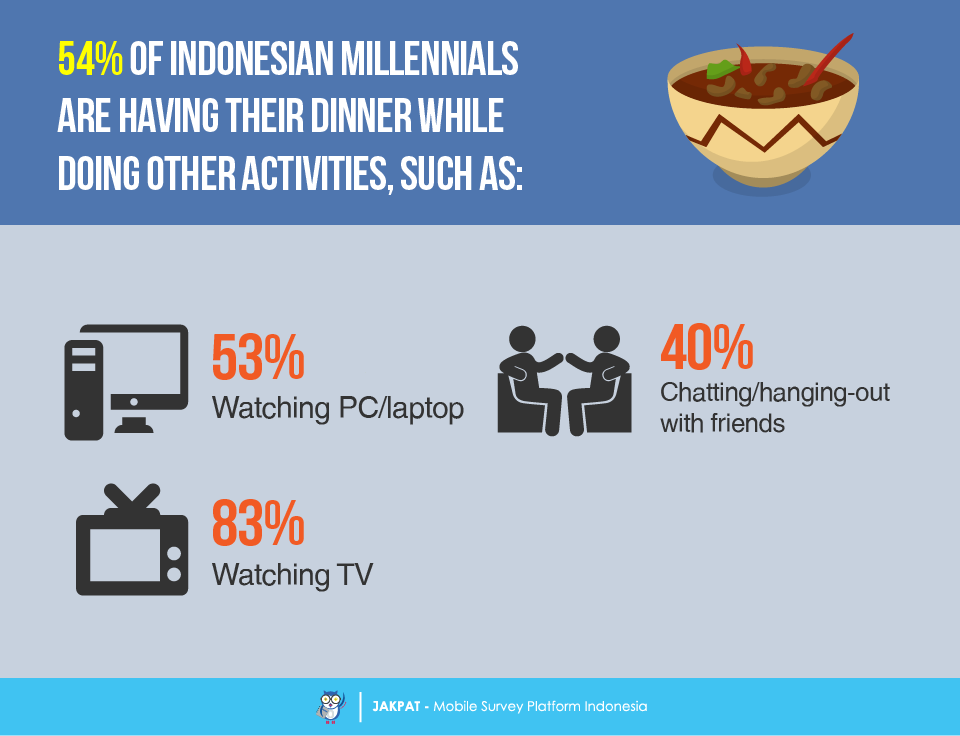
Next, we found out that more than half of our respondents (53%) usually eat snack after having their dinner. When asked about what kind of snack they usually eat, many of them choose chips (61%). Apparently, more than half of our respondents (54%) do other activities while having their dinner. When asked about what activity they usually do, most of them (83%) admit that they have dinner while watching TV. More than half of them (53%) usually have dinner while watching or playing with their PC or laptop, and someof them (40%) have dinner while chatting or hanging out with their friends.
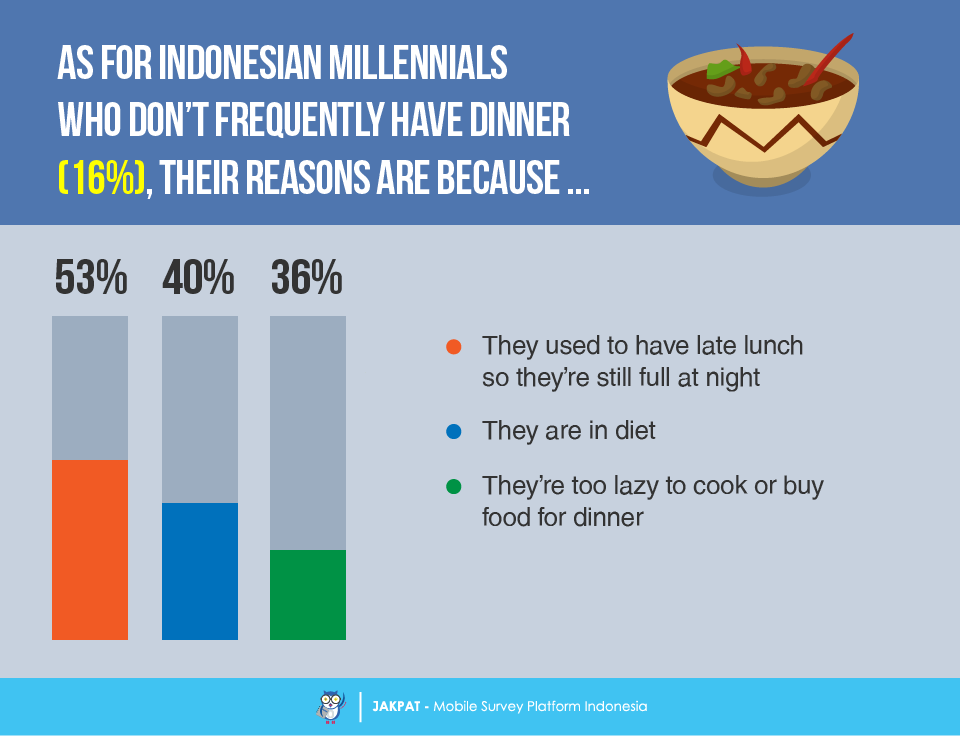
Lastly, we asked those respondents who admit that they don’t usually have dinner regarding to their reason why. It turns out that 53% of them answered that they used to have late lunch so they’re still full at night, while 40% of them admit that they are in diet. In addition, there are also 36% of them who admit that they just feel lazy to cook or buy food for dinner.
[1] Read the full survey report in http://blog.jakpat.net/how-indonesian-millennials-have-their-breakfast-survey-report/
For more detail you can download XLS report at the button below (bahasa). JAKPAT report consists of 3 parts which are 1) Respondent Profile, 2) Crosstabulation for each question and 3) Raw Data. Respondent profile shows you demographic profiles ( gender,age range, location by province, and monthly spending). Cross tabulation enables you to define different demographic segment preference on each answer.
![]()
You can also download PDF here:
![]()

or Get A Sales Quote by filling this form or Call to +622745015293
