


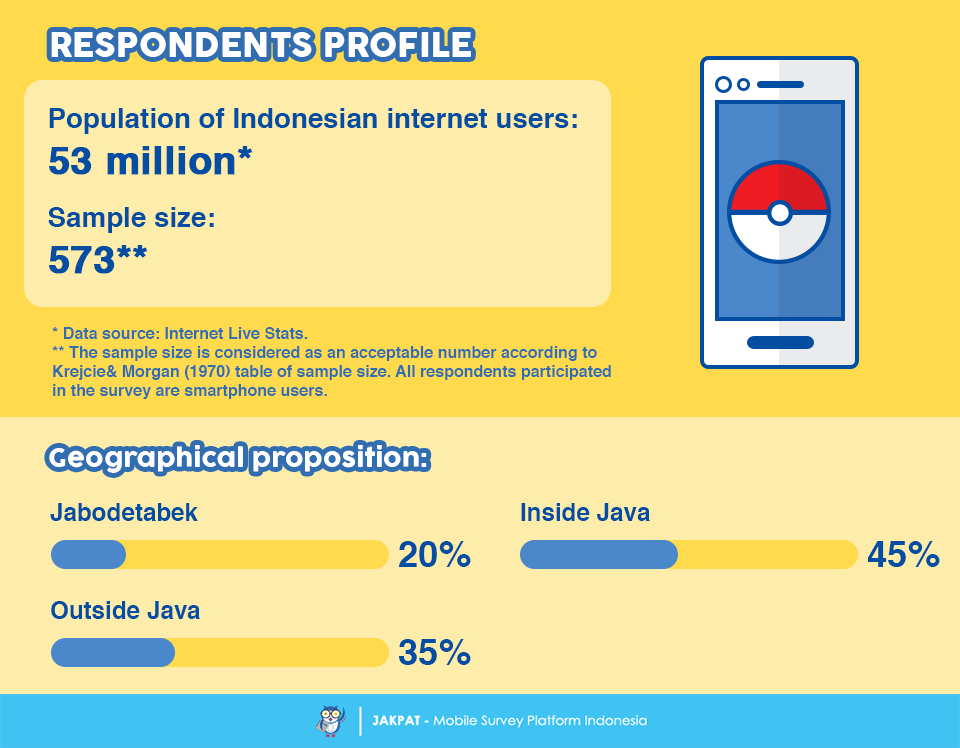
“Pokémon GO” is hype nowadays. After publishing our survey report on Indonesian mobile users toward the game last July[1], now we would like to dig deeper about how playing the game affects the life of the players. Regarding to this matter, recently Jakpat has conducted a survey in order to see further towards how playing “Pokémon GO” changes the life of its players. This survey involved 573 respondents from across Indonesia who is playing “Pokémon GO”. For the further notes, Jakpat’s respondents in this survey are Indonesian smart-phone users, with a range of age from 16 to 45 year-old.

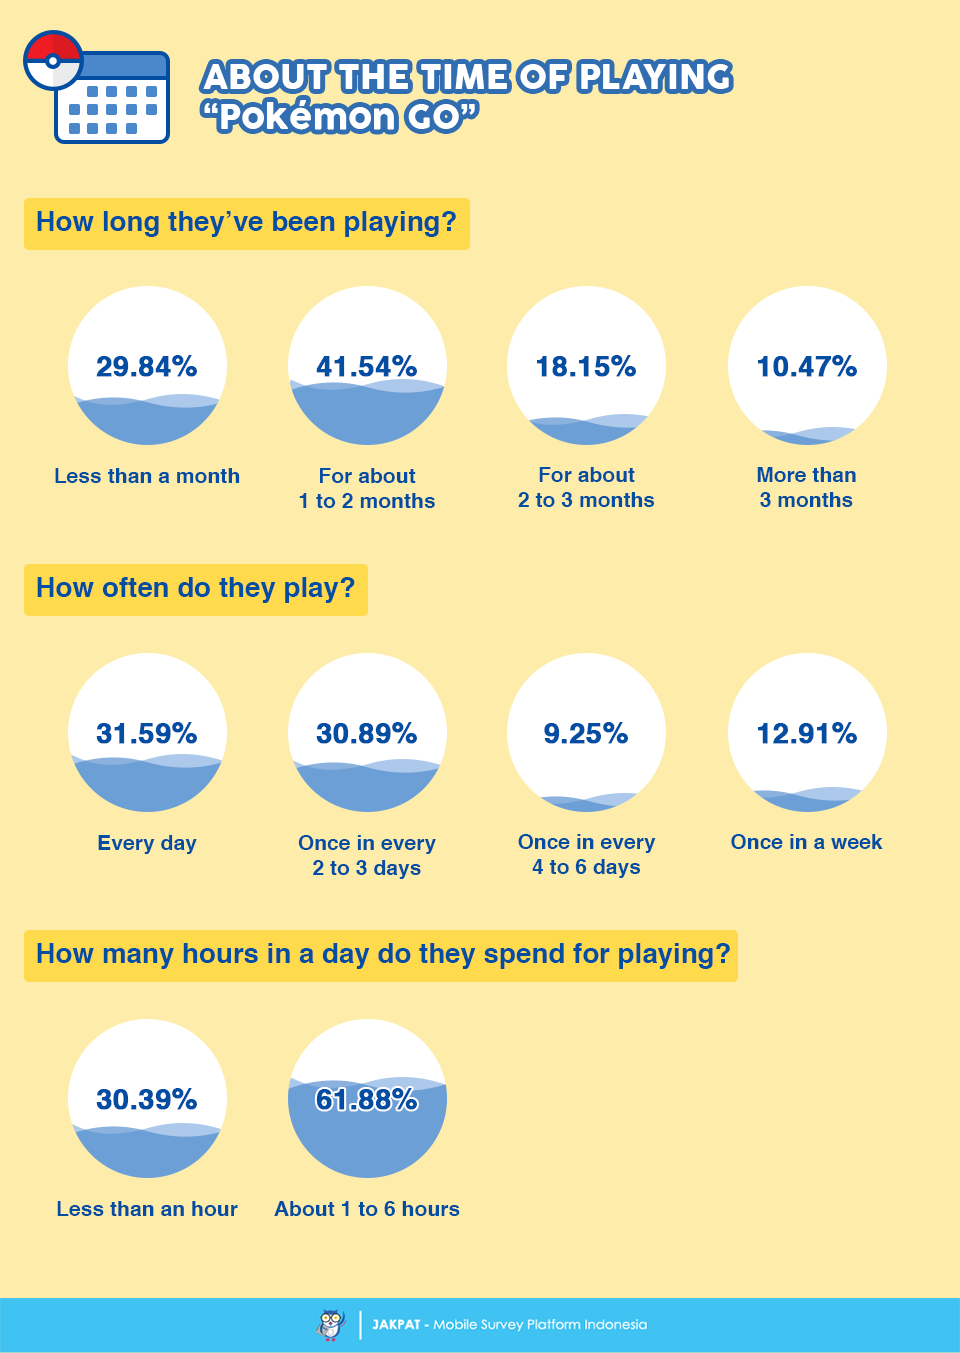
We divide this survey report to five chapters, first of all is about the time of playing “Pokémon GO”. Apparently, most of them (41.54%) have been playing the game for about one to two months already, while some of them (29.84%) have been playing the game for only less than a month. Most of our respondents play “Pokémon GO” every day (31.59%), and also once in every two or three days (30.89%). About the amount of time they spend for playing in a day, most of them (61.88%) spend about one to six hours.
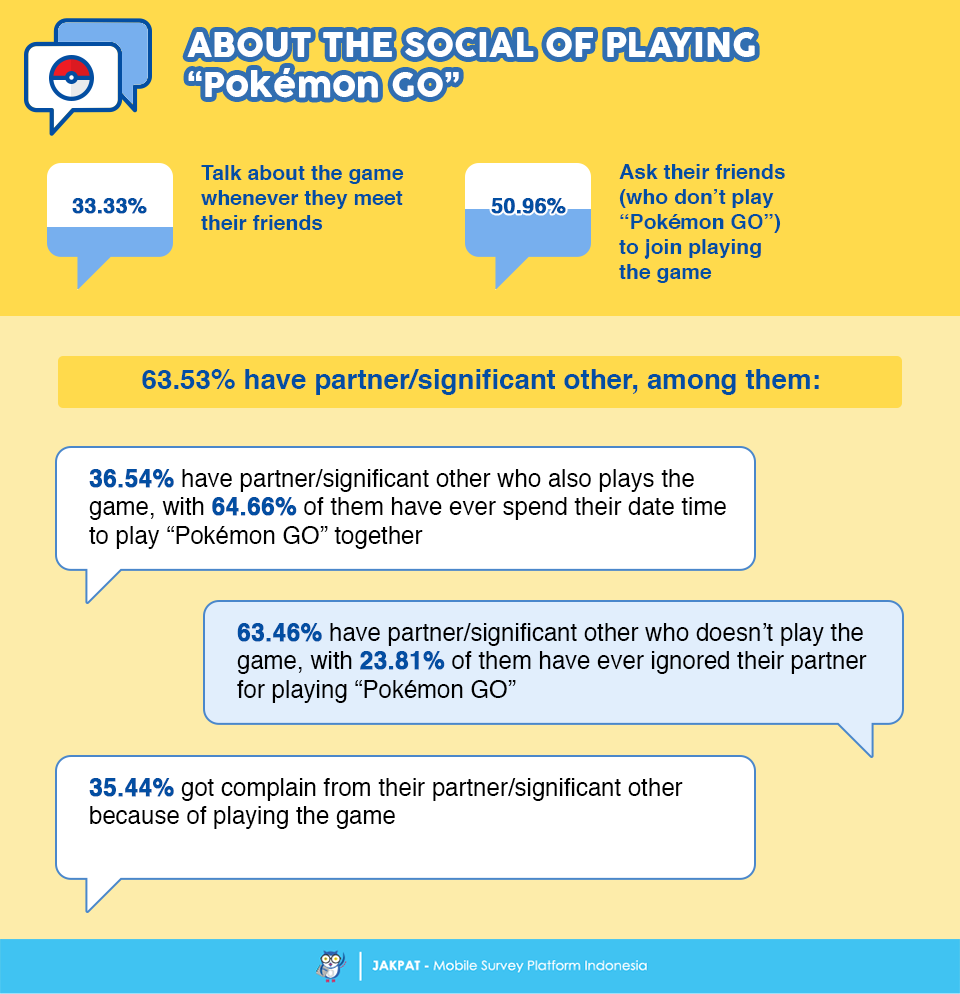
Second chapter is about the social of playing “Pokémon GO”. Apparently, some of our respondents (33.33%) admit that they talk about the game whenever they meet their friends. Hence, more than half of them (50.96%) say that they ask their friends who don’t play the game to join, or at least try to play the game. We also find that most of our respondents (63.53%) currently have partner, with 36.54% of them admit that their partner also plays the game, while the other 63.46% have partner who doesn’t play the game. Out of all players who currently have partner, 35.44% of them admit that they often got complain from their partner because of playing the game.
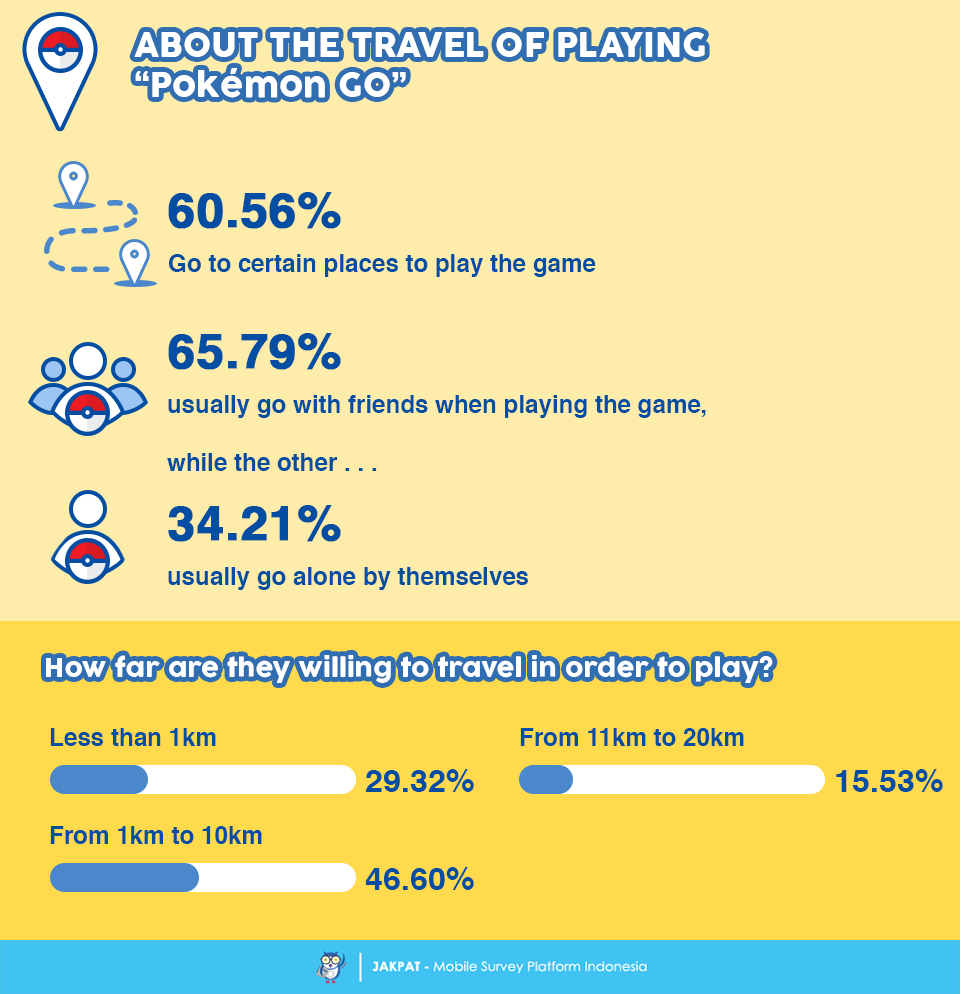
Third chapter is about the travel of playing “Pokémon GO”. We find that most of our respondents (60.56%) admit that they go to certain places to play the game. Furthermore, most of them (65.79%) say that they usually go with a companion, such as their friends, while some of them (34.21%) admit that they just go by themselves. Regarding to how far they are willing to travel for playing the game, many of them (46.60%) say that they would travel from at least one kilometer up to ten kilometers just to play the game.
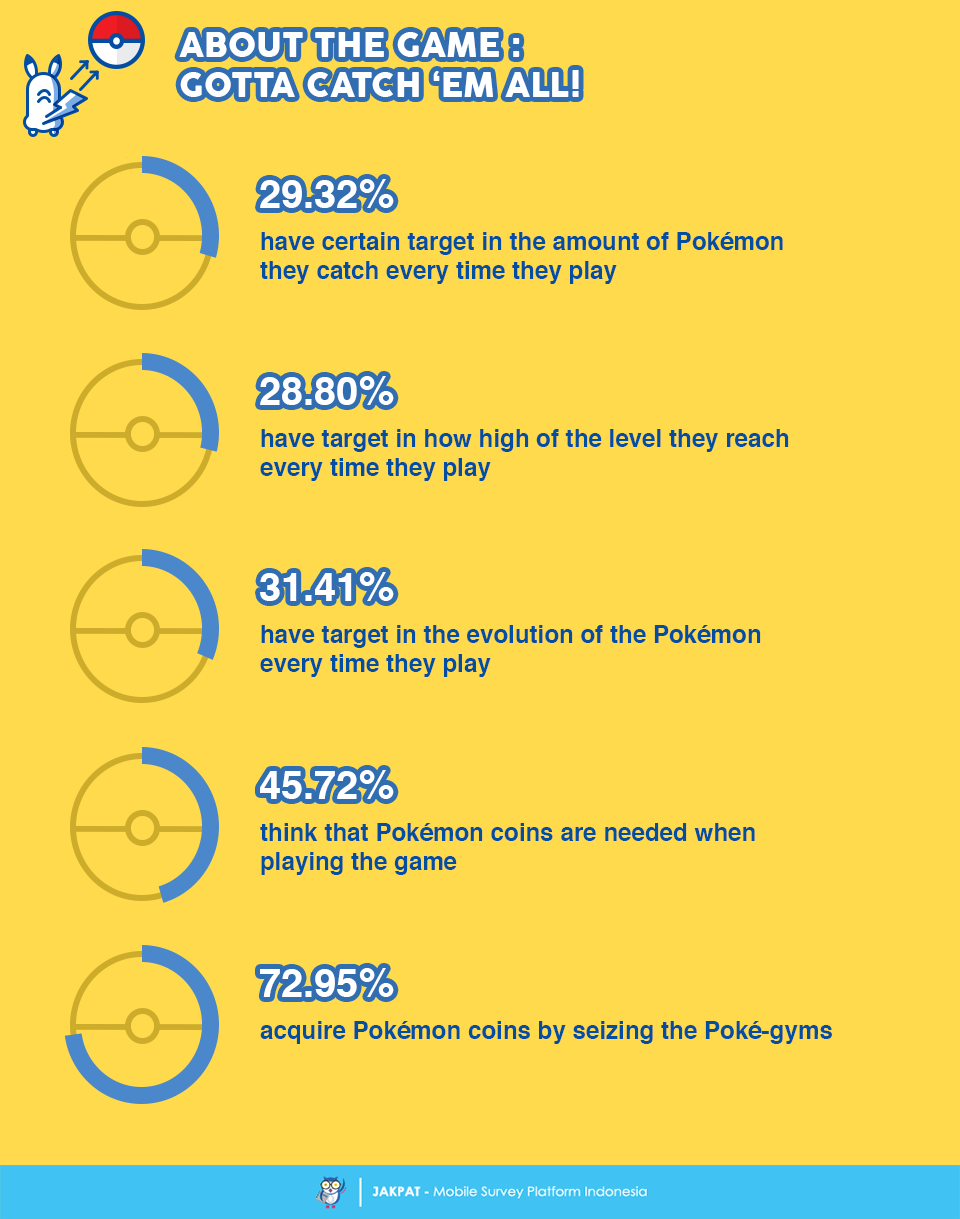
Fourth chapter is about the game itself. We gather some information about the habit and preferences of the players when playing “Pokémon GO”. Apparently, only 21.99% of them admit that they set a target in the amount of Pokémon they catch every time they play, while 28.80% admit that they set a target in how high the level they reach every time they play. Hence, 31.41% admit that they set a target in the evolution of the Pokémon every time they play. We also find that 45.72% find that Pokémon coins are needed when playing the game, with 72.95% of them admit that they acquire Pokémon coins by seizing the Poké-gyms.
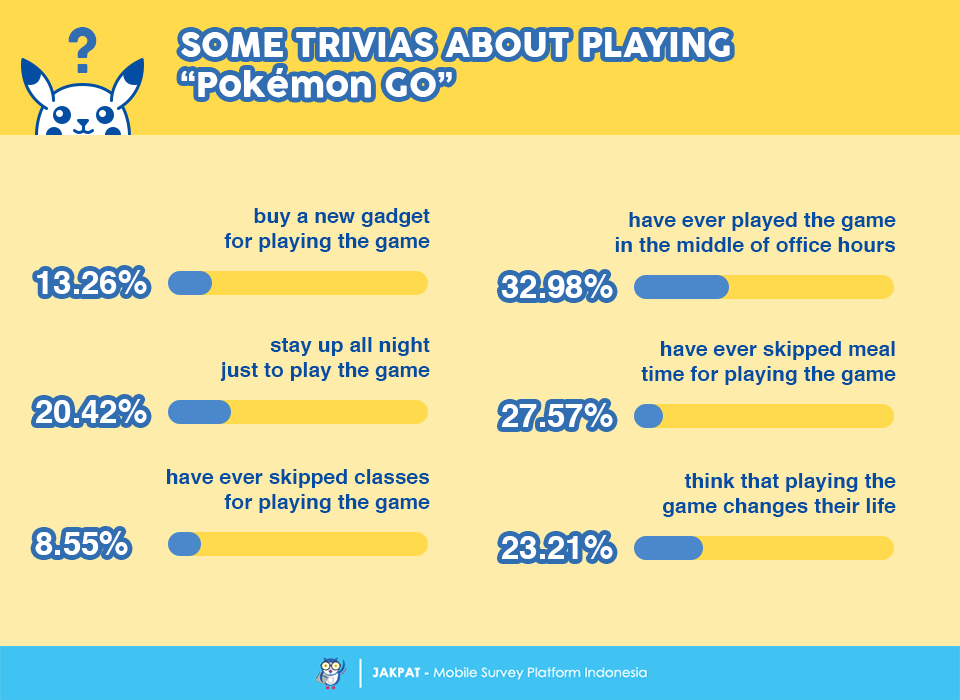
Lastly, in the fifth chapter we gather some trivia from “Pokémon GO” players regarding to playing the game. We find that some of them (20.42%) are willing to stay up all night just to play the game, while some of them (13.26%) admit that they buy a new gadget just for the sake of playing “Pokémon GO”. Furthermore, some of them (32.98%) admit that they’ve played the game in the middle of office hours, while a few of them (8.55%) admit that they’ve skipped classes just to play the game. In addition, some of them (27.57%) apparently have skipped meal time for playing the game. After all of those trivia, however, we find that only 23.21% of our respondents who admit that playing “Pokémon GO” has changed their daily life.
[1] See the survey result in https://blog.jakpat.net/indonesias-mobile-users-on-pokemon-go-survey-report/
For more detail you can download XLS report at the button below (bahasa). JAKPAT report consists of 3 parts which are 1) Respondent Profile, 2) Crosstabulation for each question and 3) Raw Data. Respondent profile shows you demographic profiles ( gender,age range, location by province, and monthly spending). Cross tabulation enables you to define different demographic segment preference on each answer.
![]()
You can also download PDF here:
![]()

or Get A Sales Quote by filling this form or Call to +622745015293
