Tag Archives: survey gen x jakpat

Canva.com/Jakpat

84% Masyarakat Sudah Mantap Dengan Pilihan Capres-Cawapres Mereka

Menjelang Pemilu 2024, masyarakat Indonesia banyak terpapar konten politik di media sosial. Mulai dari visi dan misi capres-cawapres, isu-isu politik, kampanye, hasil debat, opini public figure, hingga meme politik. Hal ini bisa menjadi tambahan referensi masyarakat dalam menilai dan mengevaluasi dari berbagai sudut pandang untuk menyakinkan pilihannya saat pemilu nanti.

Jakpat melakukan survei untuk mengetahui pandangan responden terhadap kampanye politik saat ini, khususnya mengenai konten politik di media sosial, mengidentifikasi konten hoaks, visi dan misi kandidat, hingga keputusan memilih. Survei yang melibatkan 1099 responden ini juga bertujuan untuk mengetahui preferensi politik responden secara netral tanpa memiliki asosiasi atau mendukung partai politik tertentu.

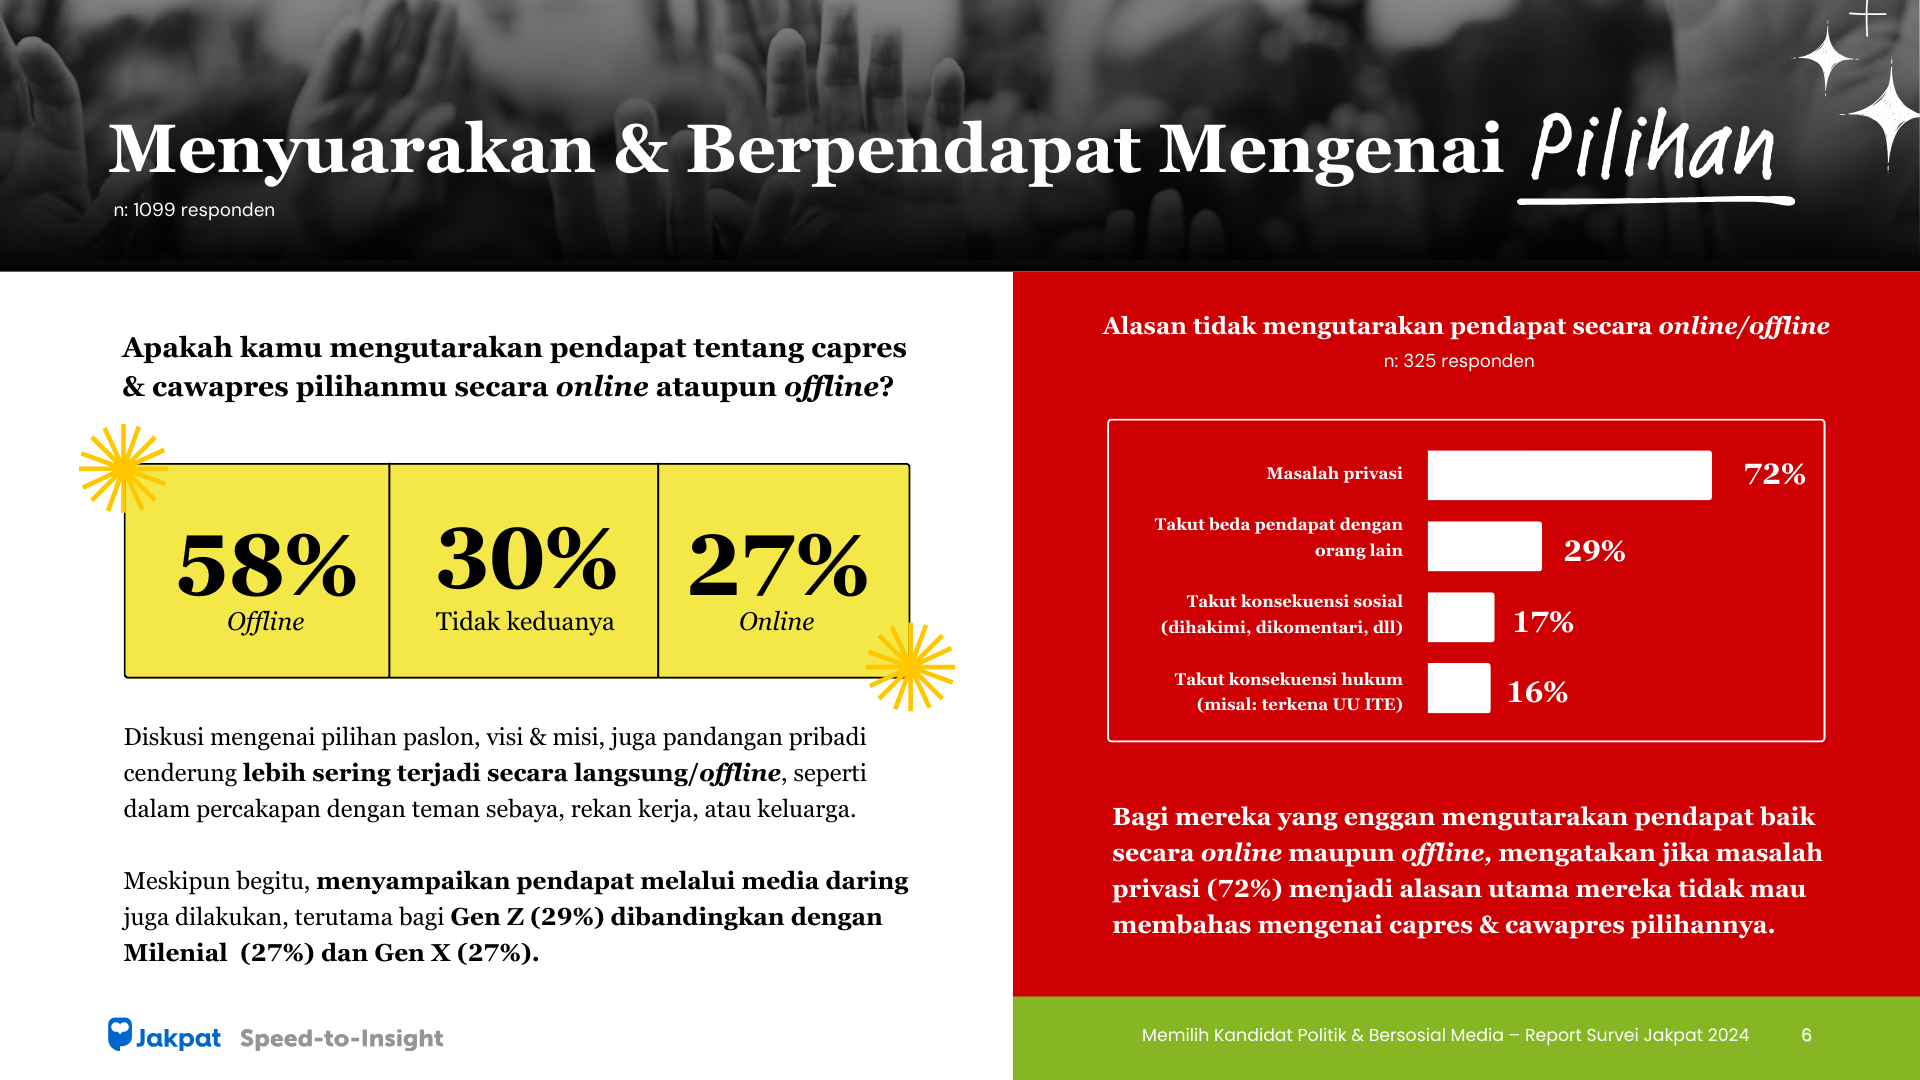
Hasil survei menunjukkan 58% responden mengutarakan pendapatnya mengenai pilihan capres dan cawapres secara langsung atau offline, seperti diskusi dengan teman sebaya, rekan kerja, atau keluarga. Selain itu, 27% responden juga menyampaikan pendapat melalui media daring, terutama bagi Gen Z (29%).

Sedangkan, 30% yang tidak mengutarakan pendapatnya baik secara online maupun offline berpendapat jika masalah privasi (72%) menjadi alasan utama mereka tidak mau membahas mengenai capres dan cawapres pilihannya.

Mengidentifikasi Konten Hoaks

Konten hoaks merupakan informasi palsu atau bohong dalam upaya memutarbalikkan fakta yang dibuat dengan sengaja, dalam hal ini mengarah pada berita negatif. Jika dilihat dari frekuensinya, 37% responden jarang menjumpai konten hoaks. Meskipun begitu, 19% responden lainnya merasa sangat sering mendapatkan konten tersebut.

Tiktok menjadi platform yang paling banyak ditemukannya konten hoaks menurut Gen Z (75%) dan Milenial (58%), sedangkan bagi Gen X biasanya menemukan konten tersebut di Facebook (57%).

Kemampuan dalam mengidentifikasi konten hoaks, membuat responden tidak terpengaruh dalam menentukan pilihannya.Karena itu, 57% memilih tidak menghiraukannya atau skip konten/akun yang dianggap hoaks.

Mempelajari Visi & Misi Kandidat

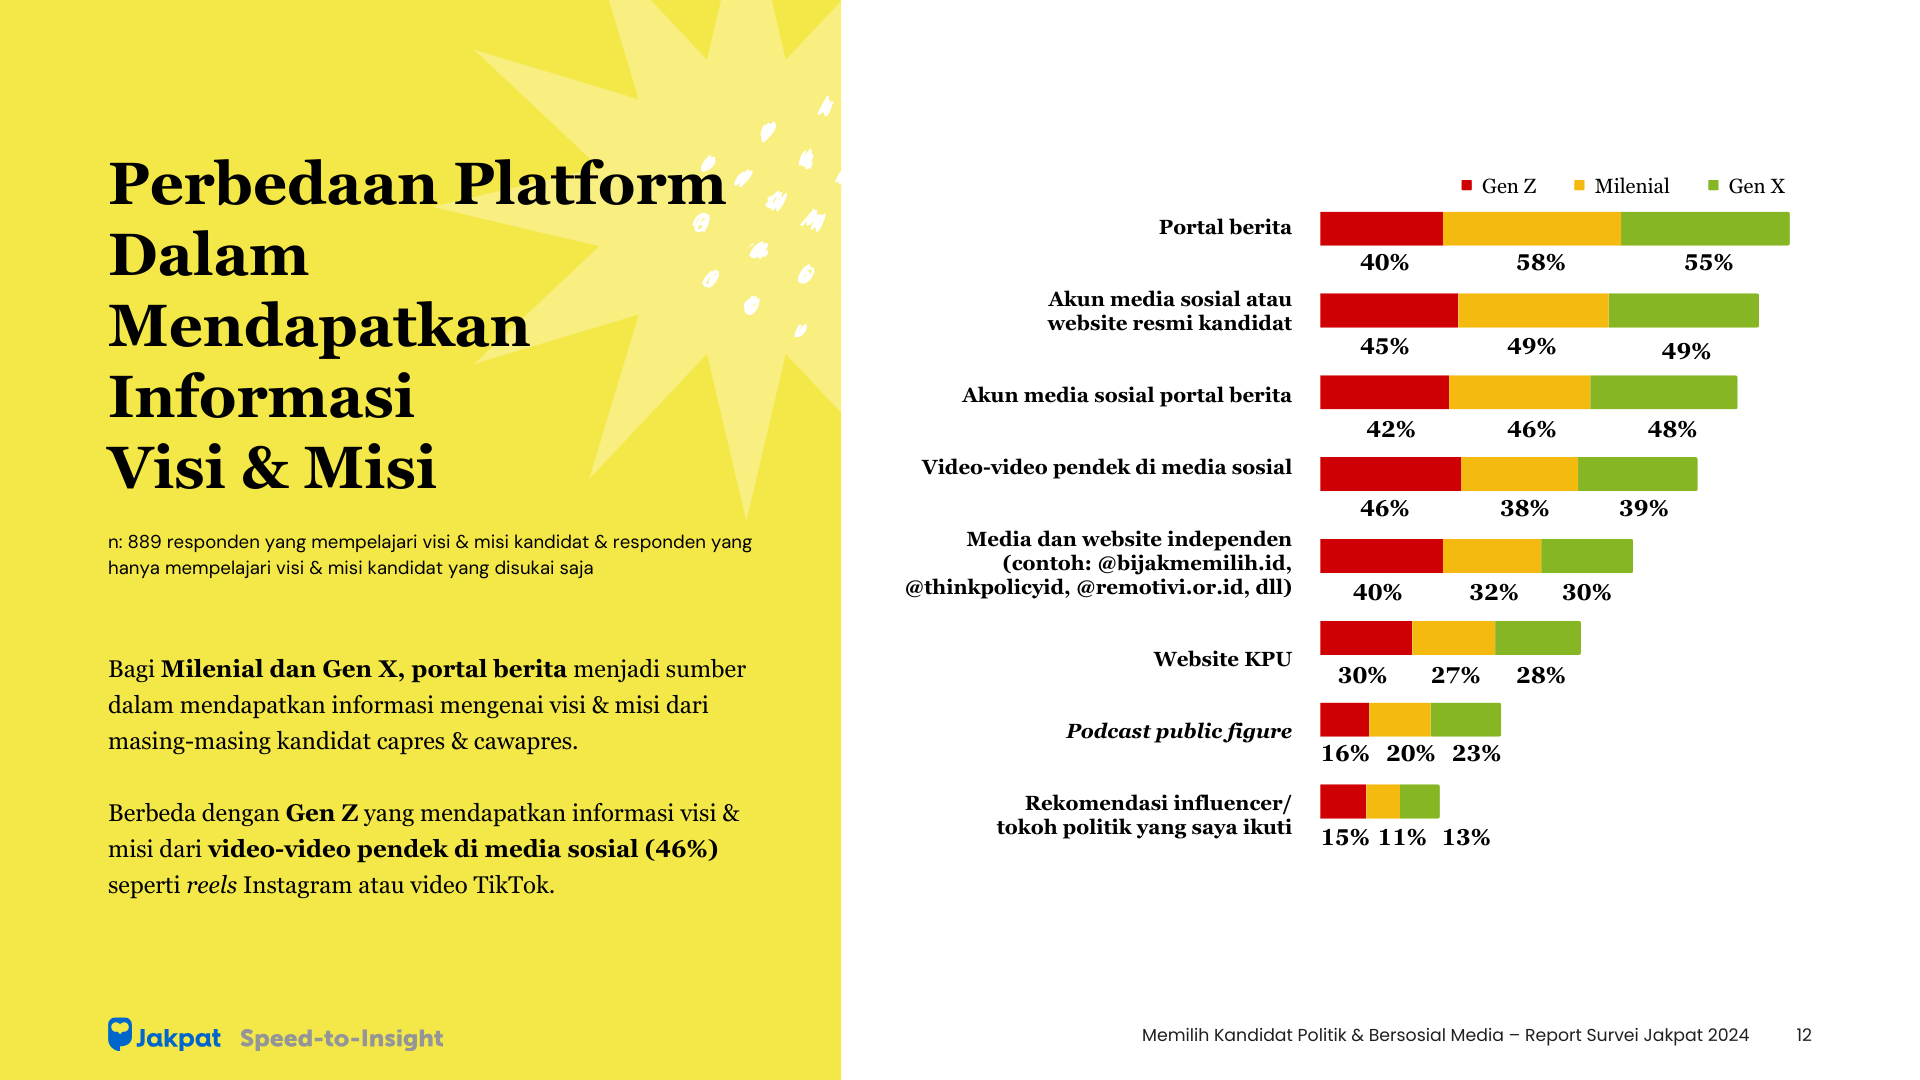
Visi dan misi yang diusung kandidat (71%) menjadi faktor utama yang memengaruhi penilaian responden dalam menentukan pilihan capres dan cawapres. Selain itu, kualitas diri juga menjadi faktor teratas penilaian, seperti rekam jejak positif (61%), latar belakang kandidat (58%), dan mampu dalam memimpin (51%).

Tampaknya visi dan misi kandidat capres-cawapres lebih menarik perhatian responden daripada visi dan misi yang dibawa oleh calon legislatif. Hal ini ditunjukkan dengan hanya 44% yang mempelajari visi dan misi caleg, dibandingkan dengan mempelajari visi dan misi capres-cawapres (63%).

“Awareness untuk menggunakan hak pilih dalam pemilu sebenarnya tetap tinggi, hanya saja terlihat masih ada ketimpangan awareness antara pemilu presiden dan pemilu legislatif. Untuk pemilu presiden memang masih ada 19% yang tidak mempelajari visi misi capres, tetapi untuk pemilu legislatif, justru ada 56% yang tidak mempelajari visi misi caleg. Jadi sepertinya perhatian masyarakat lebih banyak terpusat pada capres,” jelas Head of Research Jakpat, Aska Primardi.

Aska melanjutkan padahal nantinya saat pemilu, masyarakat juga diminta memilih caleg mulai dari DPR, DPRD tingkat 1, DPRD tingkat 2, dan DPD. Selain itu opsi pilihan di surat suara legislatif akan jauh lebih banyak dan rumit dibandingkan surat suara capres. Edukasi tentang pemilu legislatif ini yang perlu ditingkatkan, supaya masyarakat bisa lebih mengenal caleg dan visi misinya.

Keputusan Memilih 

Mayoritas responden sudah menentukan pilihan capres-cawapresnya. Terlebih 84% responden juga mengakui jika mereka sudah mantap dan tidak ada rencana untuk mengganti pilihannya.

Partisipasi yang tinggi pada pemilu mendatang ini terlihat dari setiap generasi, status ekonomi sosial, dan wilayah, seperti 97% dari Jabodetabek, 95% dari Jawa, dan 97% dari luar Jawa yang akan berkontribusi.

Dapatkan informasi lengkapnya pada report kami di sini 

Memilih Kandidat Politik & Bersosial Media

Memilih Kandidat Politik & Bersosial Media

Menjelang pemilu 2024, masyarakat Indonesia menjumpai berbagai konten politik yang tersebar di media sosial. Konten-konten tersebut dapat menjadi referensi untuk menilai program para kandidat politik, dan membantu masyarakat dalam menentukan pilihan pada saat pemilu nanti.

Melalui report ini, Jakpat melakukan riset untuk mengetahui pandangan responden terhadap kampanye politik yang tengah berlangsung. Riset ini melibatkan 1099 responden, dan pengumpulan data survei dilakukan pada tanggal 22-24 Januari 2024.

Poin utama riset:

  • Konten politik di media sosial
  • Mengidentifikasi konten hoaks
  • Visi & misi kandidat politik
  • Keputusan memilih responden untuk pemilu mendatang

Jakpat sebagai lembaga riset pasar independen dan institusi survei online, bersikap netral dan tidak memihak pada individu atau partai politik tertentu. Survei ini bertujuan untuk mengetahui preferensi politik responden secara netral.

Berikut beberapa pratinjau report:

preview pict 1-1

preview pict 1-2preview pict 1-3

Complete Report Can Be Downloaded Below

Want to Run A Survey?

or Email Us at partner@jakpat.net


The Installation of Billboards is The Type of Campaign Most Disliked by The Public

The Installation of Billboards is The Type of Campaign Most Disliked by The Public

Currently, Indonesian is faced with various campaign activities in various places and media ahead of the upcoming elections. Starting from the election of President and Vice President, members of the House of Representatives, members of district/city Legislative Councils, and members of regional representative councils.

Jakpat surveyed 1276 respondents to find out people’s perspectives on current political campaign activities. In addition, this survey also to find out the political preferences of respondents neutrally without having associations or supporting certain political parties.

The survey results showed that 74% of respondents claimed to follow the progress of the current political campaign. Then, the majority of respondents also expressed interest in ongoing political campaigns, with 68% of Gen Z, 65% of Millennials, and 61% of Gen X showing interest.

Furthermore, 70% of respondents chose to know the quality of the candidates as the first reason for their interest in the current political campaign, followed by 55% who wanted to get insights/references/views to convince the choice, and 53% of respondents who chose as a real action in supporting the growth of the Indonesian nation.

For those who are not interested in campaigns, 41% of respondents choose if they don’t want to bother themselves, then 39% do not like things related to political issues, and 30% of respondents admit that a lot of negative information or news involving government elements is the reason for their disinterest in current political campaigns.

Types of Campaigns Respondents Like and Dislike

Social activities are the first type of campaign preferred by respondents (61%), then the type of direct campaign, which is when candidates are present in front of the public (55%). In addition, conducting debates with other candidates (40%), campaigns with digital publications such as TV, radio, podcasts, YouTube, and others (33%), to candidates having limited discussions with a group of people (24%).

Meanwhile, for the type of campaign they disliked, respondents chose the installation of billboards and banners unofficially to be the type of campaign they disliked the most (66%). Then the installation of party flags in neighborhoods, parks, or streets (44%), marches carrying campaign attributes (38%), going to community leaders to ask for support (25%), to distributing campaign attributes such as t-shirts, hats, stickers, and others (24%).

Resources & Choosing Decisions

Respondents get information about ongoing campaign activities from different sources. TV and radio (53%) are the most preferred sources by Gen X, while for Gen Z and Millennials who use digital media and social media the most, information comes from Instagram and TikTok.

Head of Research Jakpat, Aska Primardi explained that the current campaign situation is assessed differently by each group of voters. For Gen Z, this 2024 election is their first experience of being involved and exercising their right to vote, so, naturally, the majority of Gen Z does not yet have a final say on who to vote for. What’s more, the majority of Gen Z prefer TikTok (51%) as a means of getting to know presidential candidates and legislative candidates, where there are many debates they pay attention to. This is why the majority of them are still confused in making their choices.

“Unlike the case with Gen X, the majority of whom have decided who to choose, because indeed Gen X has learned from previous experience and knowledge about presidential candidates or legislative candidates. The majority of Gen X prefer conventional media such as TV and radio as sources of campaign information, and they consider that the current campaign situation is still peaceful and conducive. Thus, it is natural that Gen Z is the main target of candidates and political parties because in addition to the proportion in the population being one of the largest after Gen Y, the majority of Gen Z is also still very open to all choices, and may still change until the last moment before entering the voting booth on election day,” continued Aska.

Regarding the decision to choose, this is indicated by 52% of respondents considering the possibility of changing their mind or changing choices after the campaign or ahead of the election, especially for Gen Z with 61%, followed by Millennials 54%, and Gen X 41%.

Get the details on our report here.

Jakpat

The Public’s Perspectives On Political Campaigns

Currently, the Indonesians public is faced with various campaign activities in preparation for the upcoming 2024 democratic celebration. Through this report, Jakpat surveyed 1276 respondents to capture their perspectives on the current political campaigns.

These results are based on a survey conducted on 23rd-25th of December 2023.

Key research points:

  • Respond to the interests of the respondents on the current political campaigns
  • Identify the types of the current political campaigns the respondents like and dislike
  • Respondents’ expectations from the current political campaigns

Jakpat as an independent market research and online survey institution, remains neutral and doesn’t take sides or affiliate with any individual or specific political party. The survey is intended to neutrally identify the political preferences of respondents.

Here are some previews of the report:

Jakpat Survei - Image 1Jakpat Survei - Image 2Jakpat Survei - Image 3

Complete Report Can Be Downloaded Below

Want to Run A Survey?

or Email Us at partner@jakpat.net

Fintech

Generational Differences in Using Digital Financial or Fintech Services

The financial world has witnessed many transformations largely triggered by rapid technological advancements. The intersection between finance and technology has given birth to a dynamic field that we commonly know as Financial Technology or Fintech. Fintech is changing the way individuals and businesses interact with their finances. In the first half of 2023, Jakpat conducted a survey of 1425 respondents in Indonesia regarding the use and habits of respondents in the financial and fintech landscape. The survey, which was later published in the form of a report entitled “Indonesia Fintech Trends 2023″, focuses on several digital financial services such as digital payments, online credit, and investment platforms. In addition, the survey also explored respondents’ financial behavior, insurance, and credit practices.

The Use of Digital Financial Services

In semester 1 of this year, there were 8 out of 10 respondents who used digital payment platforms to make transactions both offline and online. Some digital payment platforms used include e-wallets or digital wallets, mobile and internet banking including virtual debits, and delayed payments service namely Buy Now Pay Later (BNPL) or commonly called paylater. According to Aska Primardi, Head of Research Jakpat, awareness and the number of users of financial products in Indonesia continue to increase from year to year, with the most widely used platform being digital payment.

E-wallet is the most widely used service by respondents who claim to use digital payments for transactions. As many as 84% of respondents use e-wallets for various needs such as paying for groceries both offline and online, paying for entertainment needs, to paying monthly bills. Followed by the use of digital or mobile and internet banking with 52%, and paylater for 26%. The use of digital payments is indeed more common among young people, namely Millennials and Gen Z, especially for e-wallets. While digital banks are used by more than half of Millennials and Gen X. Millennials are also the segment most exposed to the use of paylater. Among Millennials who usually use digital payment methods, there are 32% who admit to using paylater services. The most common transactions paid using paylater are online shopping (23%) and paying for food with online delivery orders (18%).

Investment and Insurance

In addition to reviewing the use of various digital payment services, the report also displays data on the use of other financial products such as investment, insurance, and credit. Of all respondents, there are 38% who pay credit installments every month and 24% of respondents pay insurance premiums. While users of investment products are at 25%.

“Users of investment products are at 25%, but after digging deeper, it turns out that not all investment users are users of insurance products. It can be seen that the proportion of Gen Z in the user investment platform segment is 32%, while the proportion of Gen Z in the insurance user segment is 19%. In contrast to Gen X, this segment sees more insurance than investment platforms,” Aska explained.

“If we look at the financial pyramid, then the thing that must first be met is a safety net (for example meeting basic needs, emergency funds, insurance), then followed by investment to accumulate and preserve wealth. This is what Gen Z forgets, where they prefer direct investment to achieve financial freedom, without considering financial “security” first. A common reason why Gen Z is more willing to take risks is because they are currently single and unmarried,” Aska added.

How exactly does Gen Z view the concept of financial management? Do Millennials share the same view?

Get the details in our report here.

Header-[Premium Report] Fintech 1st Sem 2023_V5

Indonesia Fintech Trends – 1st Semester of 2023

As digital platforms continue to disrupt traditional financial services, they redefine the way individuals and businesses interact with their finances, especially through fintech. Fintech becomes the intersection between financial and technology. Several fintech platforms that are readily available including digital banking, digital wallet, investment, as well as online credit or lending. In this report, Jakpat will share our research findings related to the usage of various fintech services. These results are based on a survey conducted monthly in the first semester of 2023.

Key research points:

  • How society perceives financial planning
  • The usage of several financial technology platform
  • Popular fintech platforms and insurance providers used
  • Various insurance products

Here are some previews of the report:

Fintech Trends 1 Fintech Trends 2 Fintech Trends 3

Complete Report Can Be Downloaded Below

Want to Run A Survey?

or Email Us at partner@jakpat.net

health habit - pexels-ketut-subiyanto-4426318

Health Habits 2023: Knows the Health Risks But Lifestyle Remains Unhealthy

Each generation has different consumption behaviors when it comes to maintaining health. This is caused by various factors such as what is consumed to physical activity that is done.

Jakpat conducted a survey to find out the perspectives of Generation X, Generation Y (Millennials), and Generation Z in Indonesia regarding how they maintain health. The report, which involved 600 respondents, shows the consumption of water, sugar, and carbohydrates; exercise habits; and awareness of health risks.


Water VS Sugary Drinks

Only 16% of respondents have the habit of drinking enough water every day. In fact, those who often forget to drink water are twice as much as those who have this healthy habit. This means that awareness of the importance of drinking water in Indonesia is low for all generations.

The results of the Jakpat survey also found that 67% of respondents consumed sugary drinks 1-2 times a day. However, another 15% claimed to be sugar-free. In terms of gender, the percentage of women who adopt a sugar-free lifestyle is twice than men.

In terms of food, rice is still a staple food with more than 60% of respondents consuming this food every day. On the one hand, 16% of respondents admitted to eating fried foods every day.

However, respondents are aware of the importance of healthy and nutritious food. More than half of them have a balanced eating habit by eating vegetables and fruits. Also, 12% of them reduced their carbohydrate intake and 9% checked nutrition labels.

Women also tend to be healthier than men. The survey results showed that women ate a balanced diet (54%) and reduced sugar (30%) and carbohydrates (15%).


Lurking health hazards

Health risks, namely disease, were also of concern to respondents. More than half of Millennials (55%) and Gen X (52%) are wary of cholesterol. Meanwhile, digestive diseases are more of a concern for Gen Z (54%).

In terms of gender, women who are aware of the risk of diabetes, tend to do prevention. As many as 17% of them cut back on sugar, while only 9% of men did the same.

“They realize that these problems are caused by excessive consumption of sugary drinks, lack of mineral water consumption, excessive consumption of carbohydrates, and lack of exercise. The steps they take to overcome this problem are exercising from light to heavy, and also changing the pattern of food and beverage consumption, “said Head of Research Jakpat, Aska Primardi.


The importance of exercise

One in three respondents rated walking somewhere as a form of exercise. Meanwhile, 32% of respondents routinely exercise lightly once a week. As many as 16% did not do physical activity at all.


Get the details on our report here.

financial habit pexels-picas-joe-11348119

Financial Product Survey: Paylater as The Most Desirable

Each generation has different consumption behavior when it comes to finance. This is due to various factors such as exposure, usage, and attitude to available financial products.

Jakpat conducted a survey to find out the perspectives of Generation X, Generation Y (Millennials), and Generation Z in Indonesia related to finance. The report, which involved 602 respondents, shows what types of financial products are used, sources of income, and personas for each generation.

The survey results stated that all generations have savings with a percentage of more than 90% for each. The second most widely used financial product is paylater. Meanwhile, the younger generation (Gen Z) claims to have tried investment products such as stocks (27%).

Paylater is one of the most popular financial products for every generation. However, it could be that each generation has different consideration factors before deciding to use paylater, “said Head of Research Jakpat, Aska Primardi.

He highlighted the number of paylater users in Gen X (38%) which is more than Gen Z (34%). But at the same time, the number of insurance, mortgage, and credit card users is also more than Millennials and Gen Z.

“It could be that Gen X chooses paylater as a short-term financial solution in order to meet their needs, considering that at the same time they also have to allocate budget for other financial products,” said Aska.

Meanwhile, the highest number of paylater users is Millennials (44%). “At the same time they also have loans, mortgages, credit cards, and stocks. In addition, they also have dependents, the family, which must be paid for. Paylater can be a solution for all these needs,” said Aska.


Sources of income

All generations rely on salary as their main source of income, followed by non-formal income such as being a freelancer or owning another business. Gen Z, as predicted, still depends on parental income. As many as 45% of them admitted to making remittances from parents as a source of income. This affects the financial products used by this young generation.

“Gen Z uses paylater and at the same time also invests in stocks. Given that the majority of Gen Z’s income is still not optimal, because one of them comes from parents/family, to optimize the amount of stock investment each month, they will buy some of the necessities through the paylater feature. So that their hope to achieve financial freedom in the future can be achieved, and the most important thing now is that they can still fulfill the needs of life and lifestyle,” explained Aska.

One in four respondents claimed to have double income. Although not significant, Millennials are the generation that has the most dual income with a percentage of almost 30%. Then, 22% of respondents admitted that they only had income in terms of non-formal. One out of three Generation Xers does this.

All generations allocate half of their income to daily needs. Then, as much as 27% of income  is saved as savings.


3 Financial personas 

Jakpat divides financial personas into three types. First, Backwards tend to have little savings and rely on loans. As many as 11% of respondents fall into this category.

Then, the Stable  category where Generation X dominates with a percentage of almost 38%. These personas tend to ‘play it safe’ where they have savings but little investment. Lastly, Fordward-looking tend to be risk savvy where they have savings and investments. This group is dominated by Gen Z (30%).


Get the details on our report here.