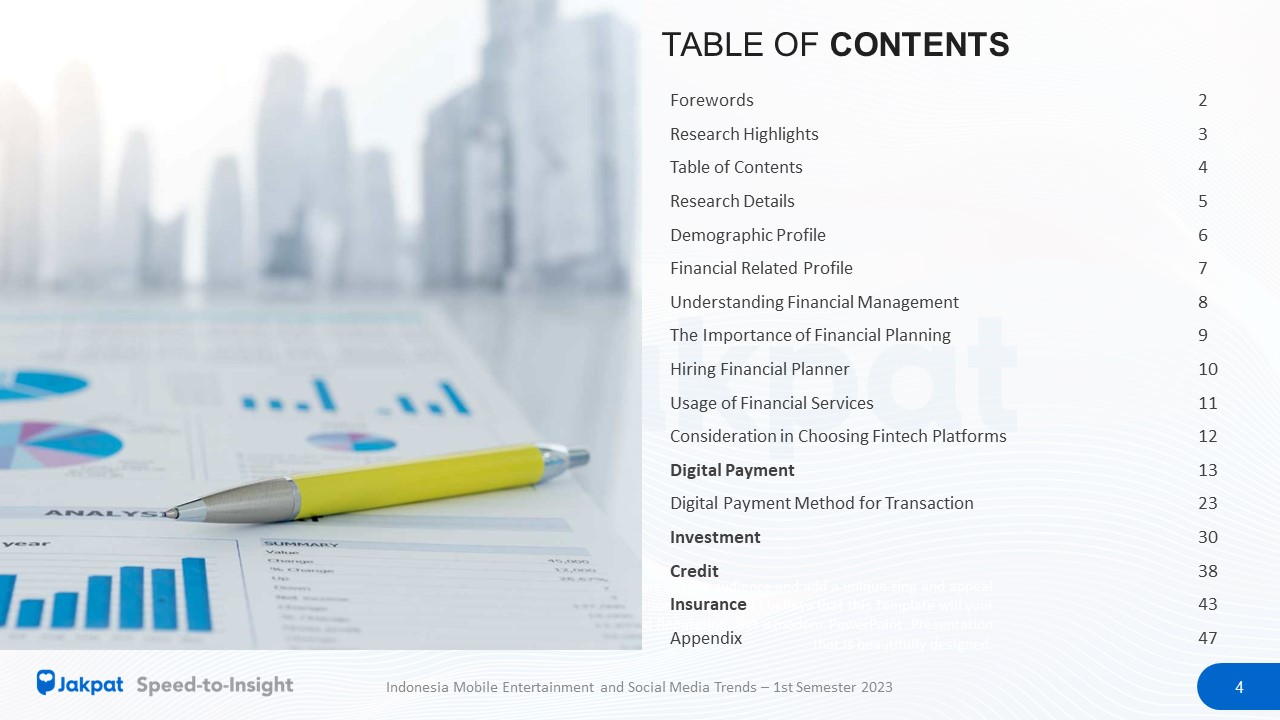
The financial world has witnessed many transformations largely triggered by rapid technological advancements. The intersection between finance and technology has given birth to a dynamic field that we commonly know as Financial Technology or Fintech. Fintech is changing the way individuals and businesses interact with their finances. In the first half of 2023, Jakpat conducted a survey of 1425 respondents in Indonesia regarding the use and habits of respondents in the financial and fintech landscape. The survey, which was later published in the form of a report entitled “Indonesia Fintech Trends 2023″, focuses on several digital financial services such as digital payments, online credit, and investment platforms. In addition, the survey also explored respondents’ financial behavior, insurance, and credit practices.
The Use of Digital Financial Services
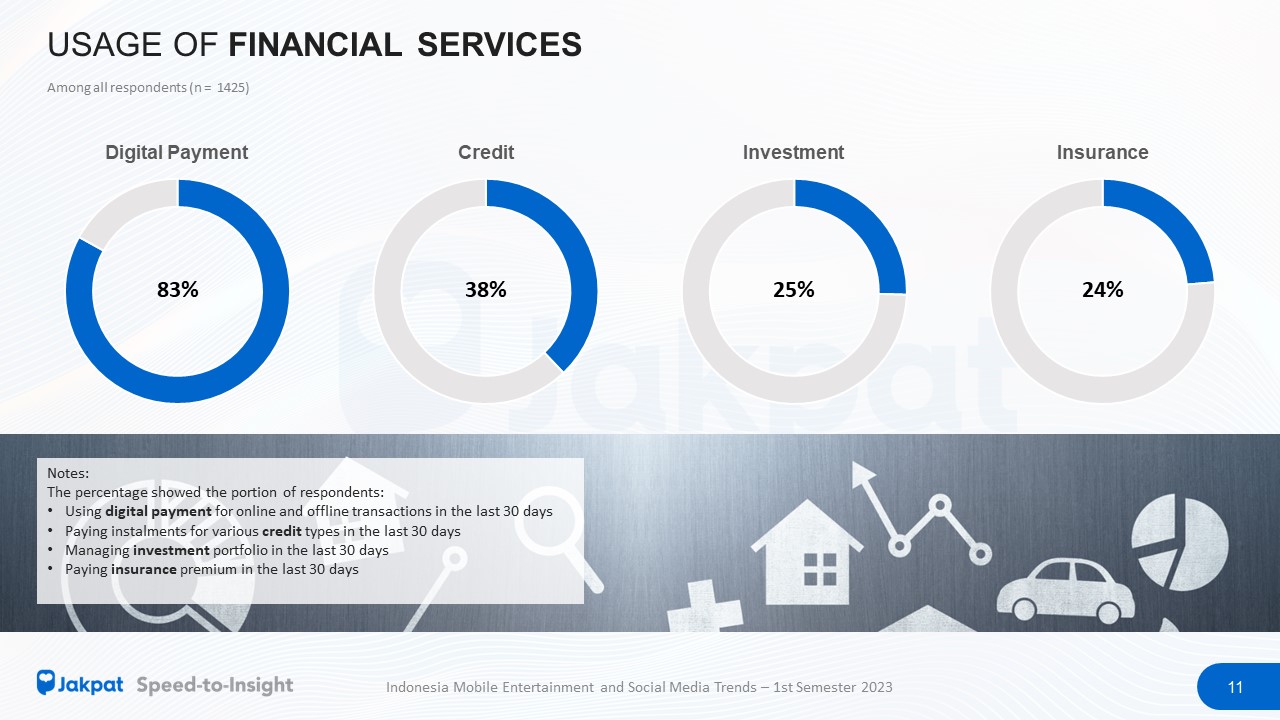
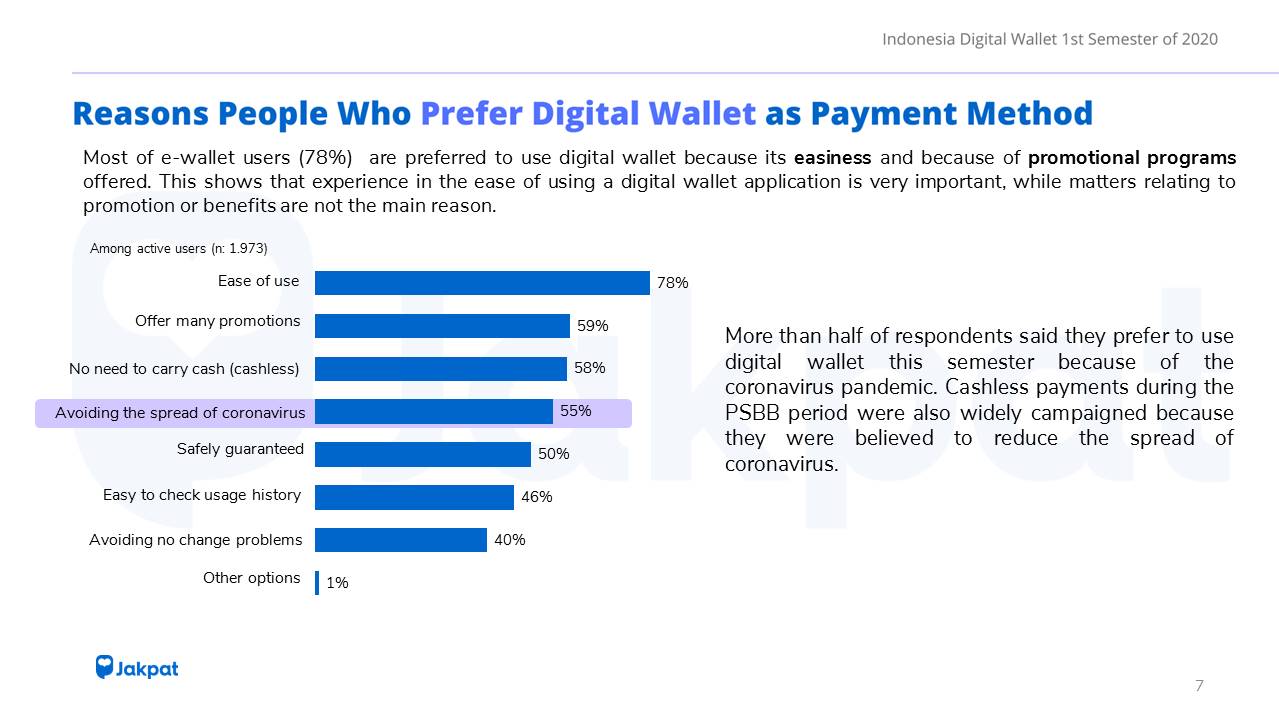
In semester 1 of this year, there were 8 out of 10 respondents who used digital payment platforms to make transactions both offline and online. Some digital payment platforms used include e-wallets or digital wallets, mobile and internet banking including virtual debits, and delayed payments service namely Buy Now Pay Later (BNPL) or commonly called paylater. According to Aska Primardi, Head of Research Jakpat, awareness and the number of users of financial products in Indonesia continue to increase from year to year, with the most widely used platform being digital payment.
E-wallet is the most widely used service by respondents who claim to use digital payments for transactions. As many as 84% of respondents use e-wallets for various needs such as paying for groceries both offline and online, paying for entertainment needs, to paying monthly bills. Followed by the use of digital or mobile and internet banking with 52%, and paylater for 26%. The use of digital payments is indeed more common among young people, namely Millennials and Gen Z, especially for e-wallets. While digital banks are used by more than half of Millennials and Gen X. Millennials are also the segment most exposed to the use of paylater. Among Millennials who usually use digital payment methods, there are 32% who admit to using paylater services. The most common transactions paid using paylater are online shopping (23%) and paying for food with online delivery orders (18%).
Investment and Insurance
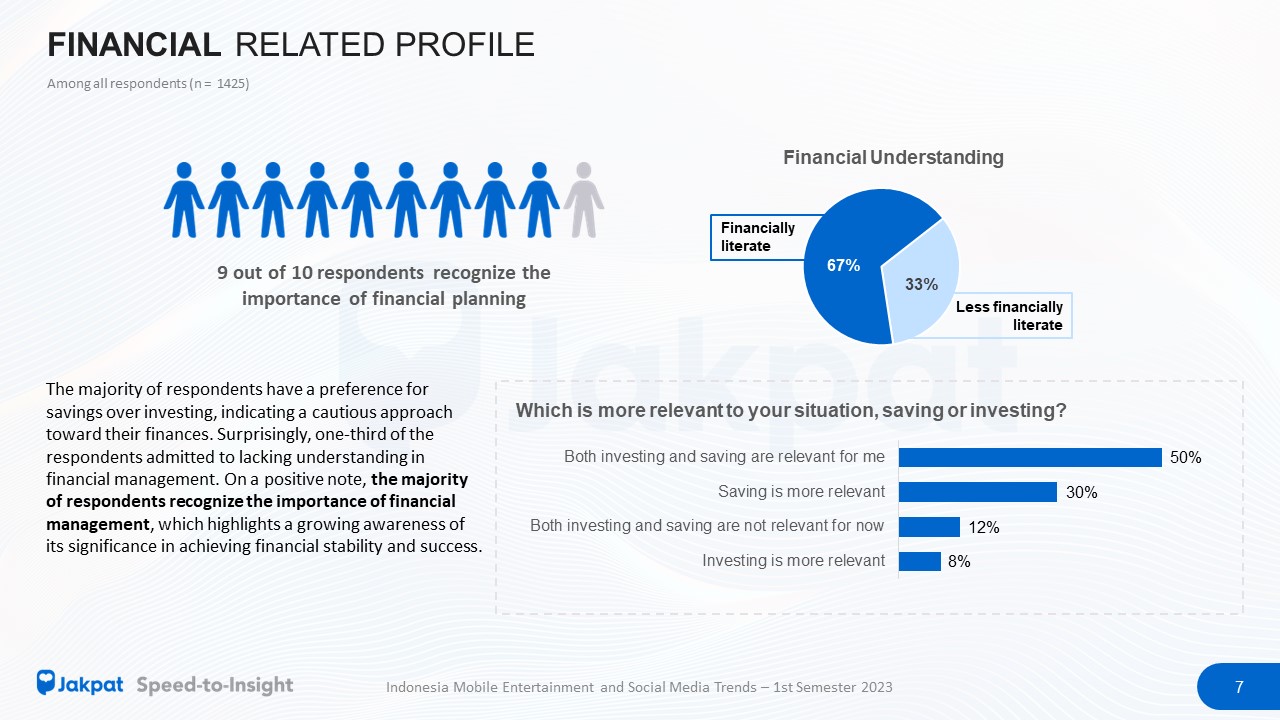
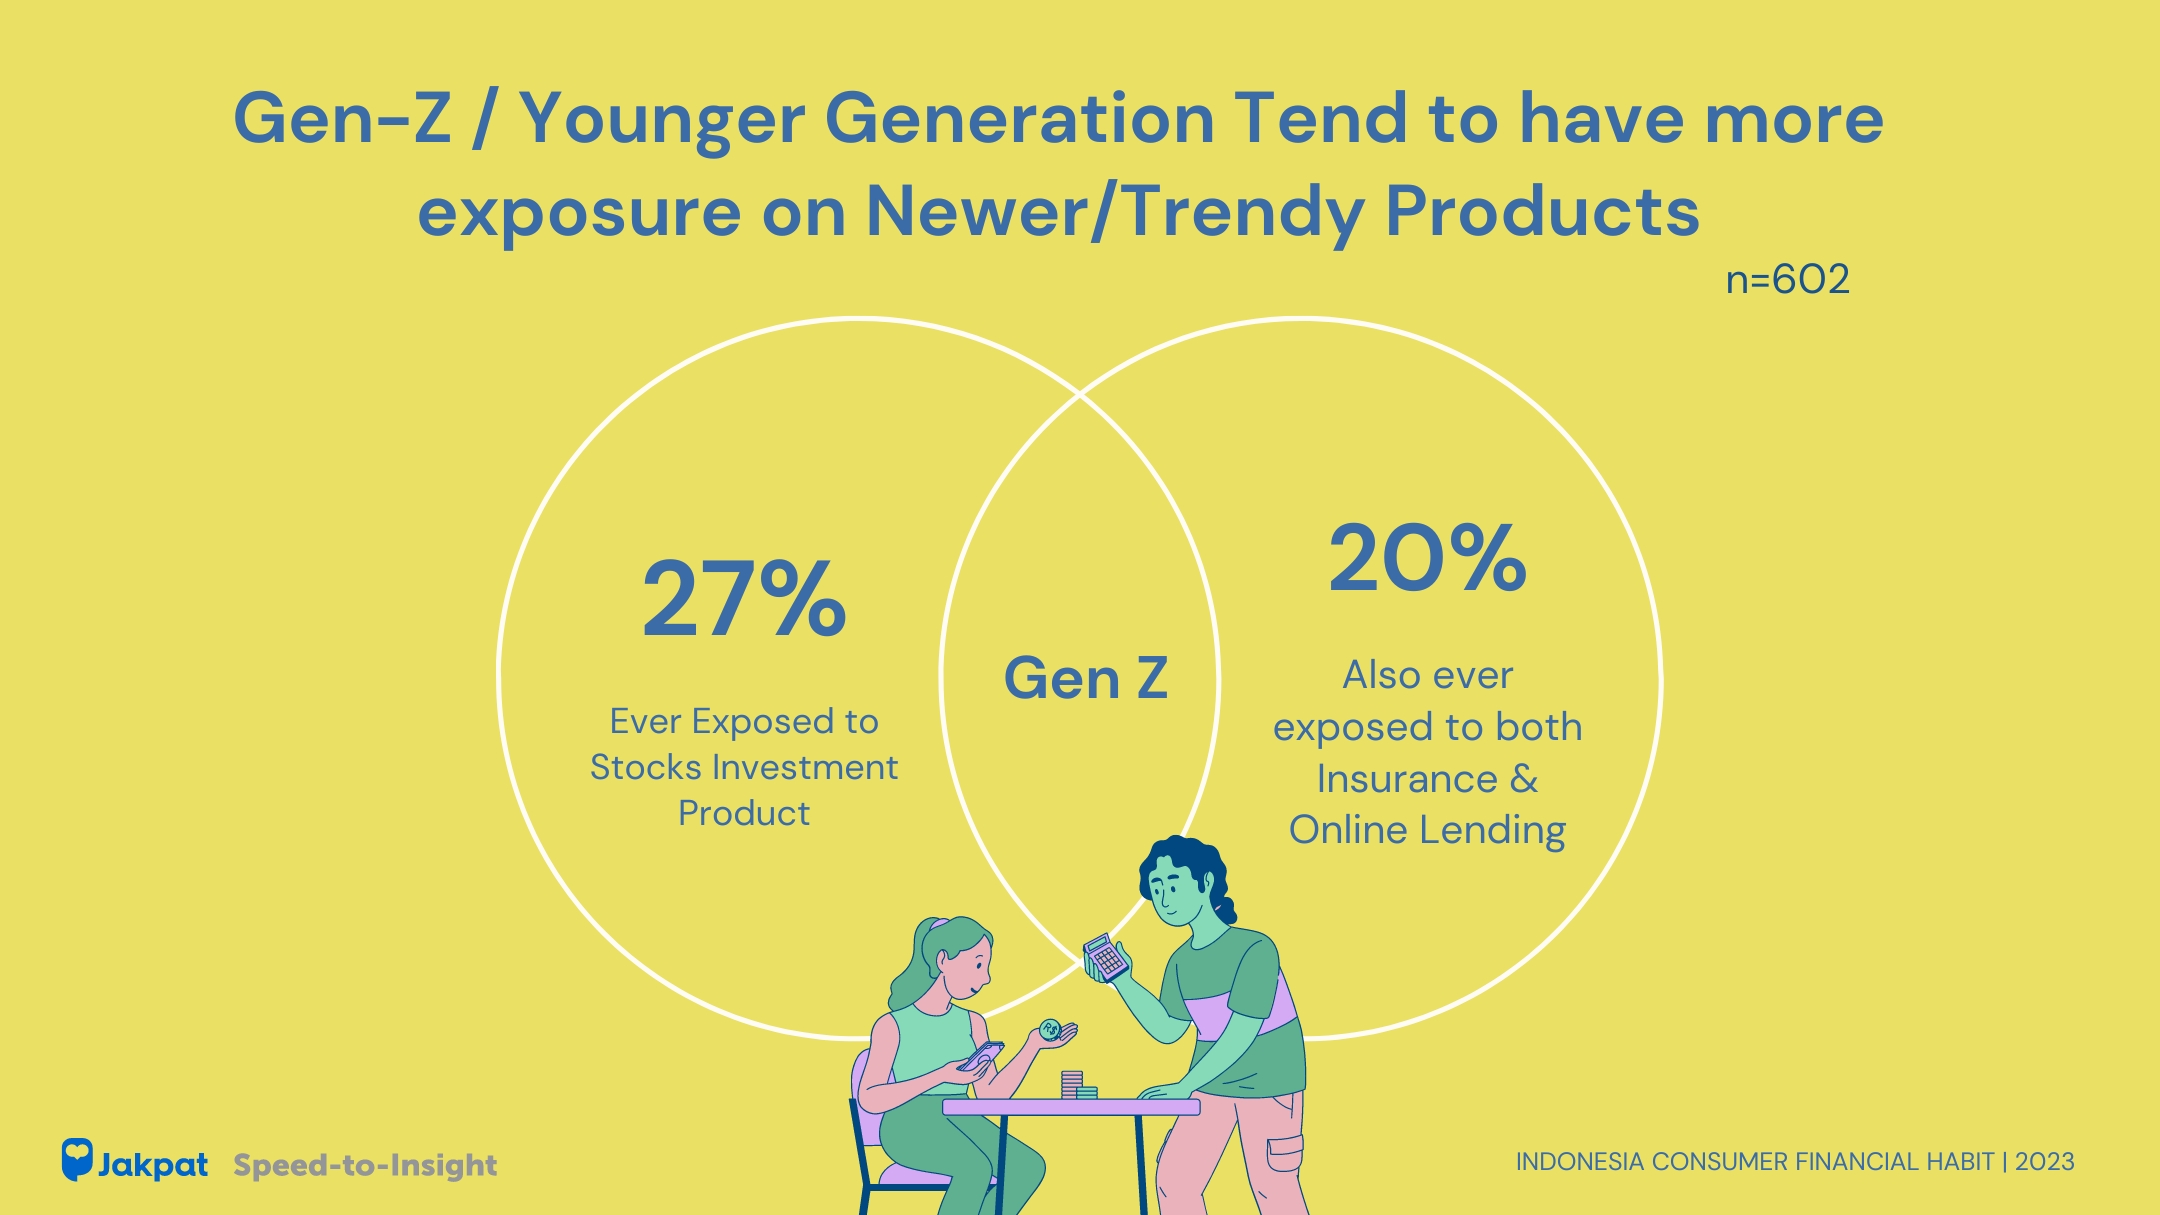
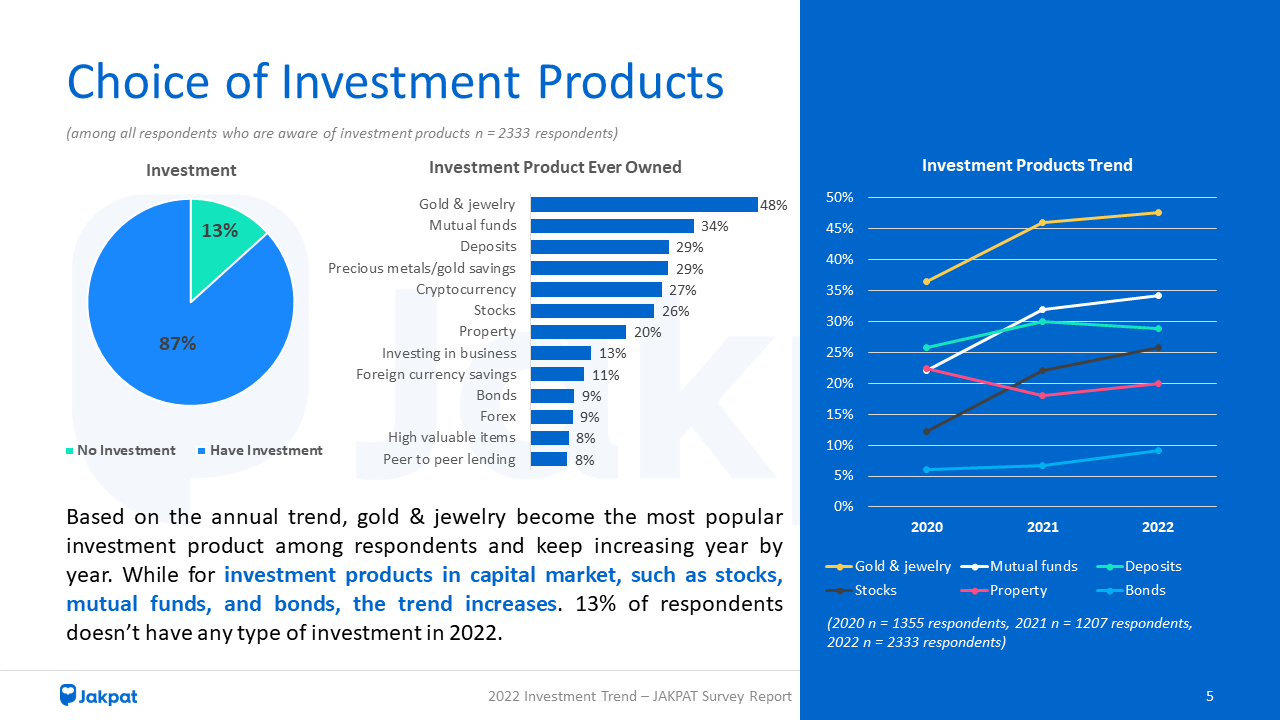
In addition to reviewing the use of various digital payment services, the report also displays data on the use of other financial products such as investment, insurance, and credit. Of all respondents, there are 38% who pay credit installments every month and 24% of respondents pay insurance premiums. While users of investment products are at 25%.
“Users of investment products are at 25%, but after digging deeper, it turns out that not all investment users are users of insurance products. It can be seen that the proportion of Gen Z in the user investment platform segment is 32%, while the proportion of Gen Z in the insurance user segment is 19%. In contrast to Gen X, this segment sees more insurance than investment platforms,” Aska explained.
“If we look at the financial pyramid, then the thing that must first be met is a safety net (for example meeting basic needs, emergency funds, insurance), then followed by investment to accumulate and preserve wealth. This is what Gen Z forgets, where they prefer direct investment to achieve financial freedom, without considering financial “security” first. A common reason why Gen Z is more willing to take risks is because they are currently single and unmarried,” Aska added.
How exactly does Gen Z view the concept of financial management? Do Millennials share the same view?
Get the details in our report here.
![Header-[Premium Report] Fintech 1st Sem 2023_V5](https://blog.jakpat.net/wp-content/uploads/2023/08/Header-Premium-Report-Fintech-1st-Sem-2023_V5-624x243.jpg)