Tag Archives: free report jakpat

beauty trend 2 - shutterstock_1781197340

50% of People Maintain Skin Health Through Drinks & Supplements

There are many ways to maintain skin health, one of them is consuming beauty drinks and skin supplements. Both of these products usually contain collagen or vitamin E which is important for the skin.

Collagen serves to increase skin hydration and elasticity, also helping to reduce wrinkles. Meanwhile, vitamin E has moisturizing benefits and has natural anti-inflammatory properties, so it can and helps soothe the skin.

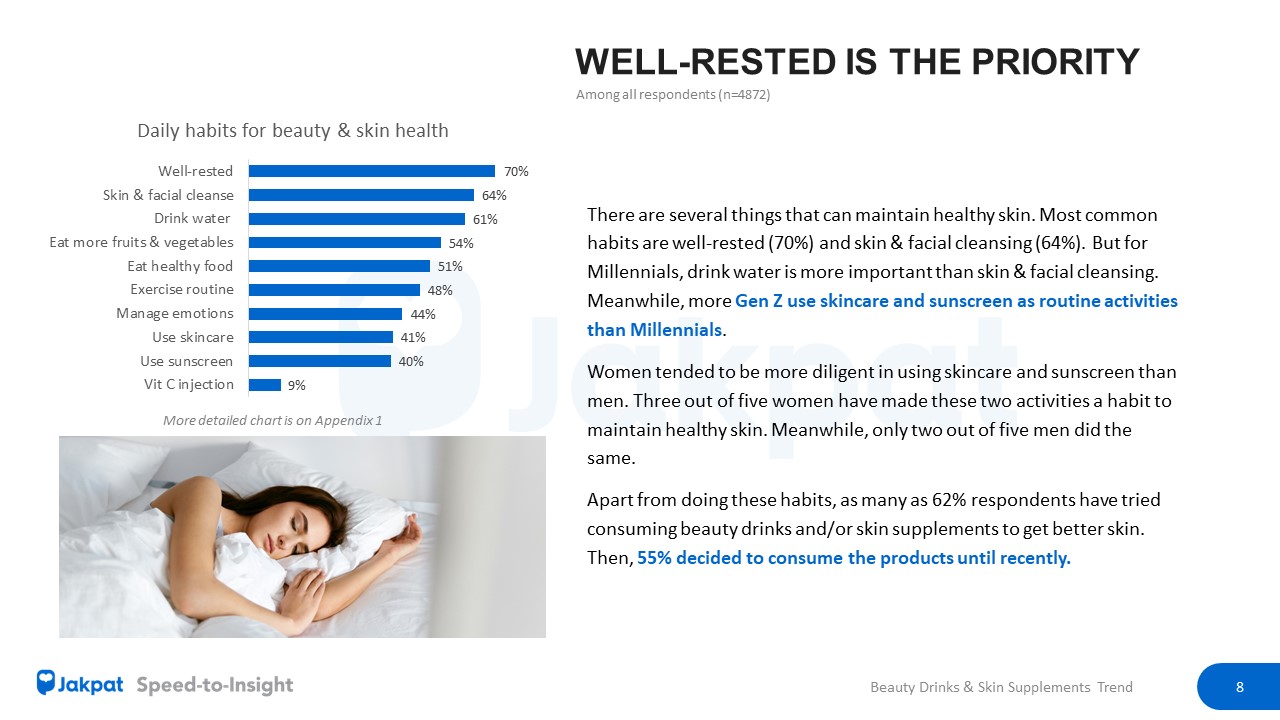
Jakpat conducted a survey of 4872 respondents to see their concern in maintaining healthy skin, especially with the consumption of beauty drinks and skin supplements, as well as the brands used. The most common healthy habits that respondents do is well-rested (70%) and skin & face cleansing (64%). More specifically, Millennials consider drinking water as the priority rather than cleansing the skin & face. Meanwhile, Gen Z use more skin care and sunscreen as routine activities than Millennials.

“The growth of the skincare industry in  Indonesia has grown rapidly in recent years. This can be seen from changes in consumer behavior that assess that skin health conditions and appearance are valuable assets, “said Head of Research Jakpat, Aska Primardi.

Motivation to consume

The Jakpat survey stated that half of respondents consumed beauty drinks and/or skin supplements in the last three months. In details, 56% consumed beauty drinks and 54% consumed skin supplements.

“Skincare products from outside the body usually require a longer process, because they are usually divided into several stages ranging from cleansing to moisturizing, and these stages must be done in the order. So it is not surprising that skin care products in the format of drinks and supplements can be increasingly developed today, “said Aska.

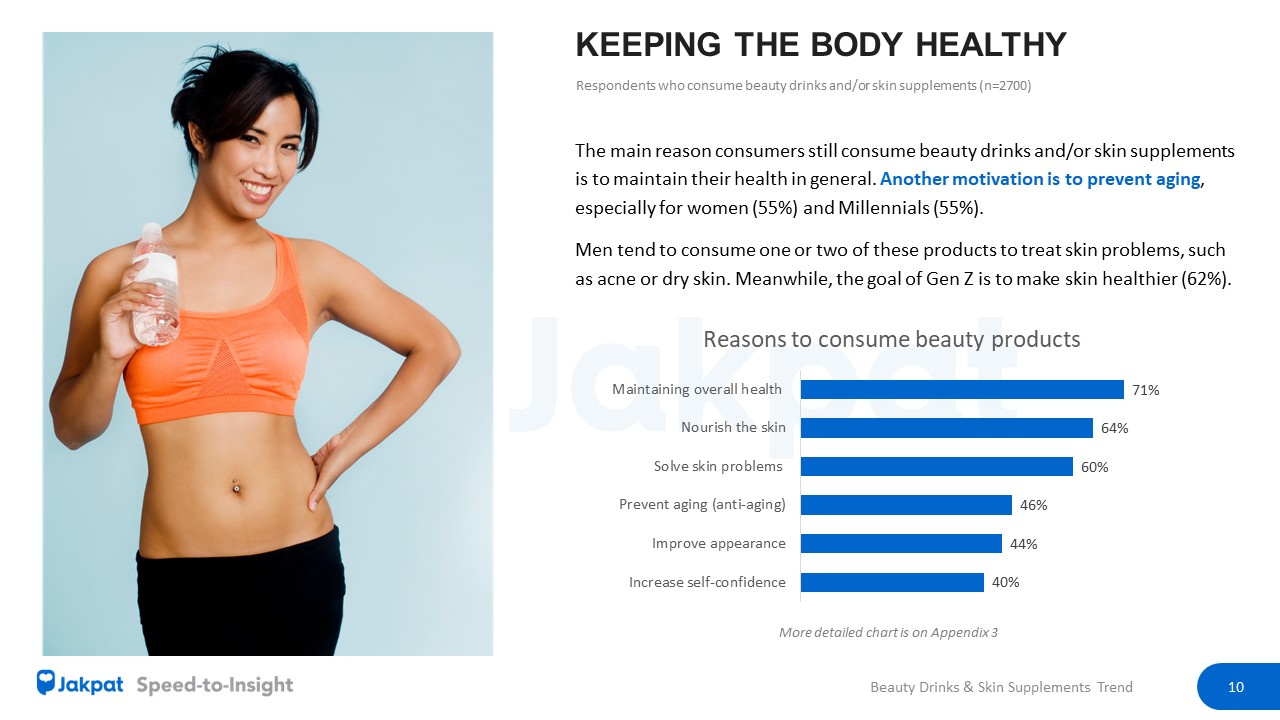
The top reason consumers continue to consume beauty drinks and/or skin supplements is to maintain their general health (71%). Other motivations are to maintain healthy skin (64%) and solved skin problems such as acne or dry skin (59%).

Beauty drinks 

Most respondents consumed beauty drinks once a day (34%). Then, they also preferred to enjoy this product at night (37%).

“Skincare in the form of drinks is considered simpler and easier to do than the use of skincare from outside the body. Moreover, if the beauty drinks can have a taste that consumers like and can cause a positive mood after consuming it,” said Aska.

As many as 86% of consumers claimed to feel the benefits of consuming beauty drinks. One-third of them claimed their skin was brighter, precisely became glowing and not dull. There are also respondents who felt healthier skin (20%) and fitter body (18%).


Skin Supplements

Most respondents took skin supplements once a day (33%). The consumption time of this product is generally at night (41%).

The most common change experienced after taking skin supplements is that the skin becomes brighter (28%), precisely becomes glowing and not dull. In addition, 16% of respondents claimed to have healthy skin.


Get the details on our report here.

Header Blog-Report Beauty Trends 2023-02_V1

Beauty Drinks & Skin Supplements Trend

The development of beauty trends in Indonesian consumers is very fast and widespread, including beauty drinks and skin supplements. Thus, Jakpat conducted research to capture people’s consumption on these products.

These results are based on a survey conducted on 14th-15th of May 2023.

Key Research points:

  • Daily healthy habits
  • Consumption of beauty drinks & skin supplements
  • Impact of beauty drinks & skin supplements usage
  • Important considerations of beauty drinks & skin supplements usage
  • Brands usage for beauty drinks & skin supplements

Here are some previews of the report:

1 Table of Contents - Beauty Drinks & SKin Supplements Report 2 Habit - Beauty Drinks & SKin Supplements Report 3 Reasons - Beauty Drinks & SKin Supplements Report


Complete Report Can Be Downloaded Below

Want to Run A Survey?

or Email Us at partner@jakpat.net

health habit - pexels-ketut-subiyanto-4426318

Health Habits 2023: Knows the Health Risks But Lifestyle Remains Unhealthy

Each generation has different consumption behaviors when it comes to maintaining health. This is caused by various factors such as what is consumed to physical activity that is done.

Jakpat conducted a survey to find out the perspectives of Generation X, Generation Y (Millennials), and Generation Z in Indonesia regarding how they maintain health. The report, which involved 600 respondents, shows the consumption of water, sugar, and carbohydrates; exercise habits; and awareness of health risks.


Water VS Sugary Drinks

Only 16% of respondents have the habit of drinking enough water every day. In fact, those who often forget to drink water are twice as much as those who have this healthy habit. This means that awareness of the importance of drinking water in Indonesia is low for all generations.

The results of the Jakpat survey also found that 67% of respondents consumed sugary drinks 1-2 times a day. However, another 15% claimed to be sugar-free. In terms of gender, the percentage of women who adopt a sugar-free lifestyle is twice than men.

In terms of food, rice is still a staple food with more than 60% of respondents consuming this food every day. On the one hand, 16% of respondents admitted to eating fried foods every day.

However, respondents are aware of the importance of healthy and nutritious food. More than half of them have a balanced eating habit by eating vegetables and fruits. Also, 12% of them reduced their carbohydrate intake and 9% checked nutrition labels.

Women also tend to be healthier than men. The survey results showed that women ate a balanced diet (54%) and reduced sugar (30%) and carbohydrates (15%).


Lurking health hazards

Health risks, namely disease, were also of concern to respondents. More than half of Millennials (55%) and Gen X (52%) are wary of cholesterol. Meanwhile, digestive diseases are more of a concern for Gen Z (54%).

In terms of gender, women who are aware of the risk of diabetes, tend to do prevention. As many as 17% of them cut back on sugar, while only 9% of men did the same.

“They realize that these problems are caused by excessive consumption of sugary drinks, lack of mineral water consumption, excessive consumption of carbohydrates, and lack of exercise. The steps they take to overcome this problem are exercising from light to heavy, and also changing the pattern of food and beverage consumption, “said Head of Research Jakpat, Aska Primardi.


The importance of exercise

One in three respondents rated walking somewhere as a form of exercise. Meanwhile, 32% of respondents routinely exercise lightly once a week. As many as 16% did not do physical activity at all.


Get the details on our report here.

financial habit pexels-picas-joe-11348119

Financial Product Survey: Paylater as The Most Desirable

Each generation has different consumption behavior when it comes to finance. This is due to various factors such as exposure, usage, and attitude to available financial products.

Jakpat conducted a survey to find out the perspectives of Generation X, Generation Y (Millennials), and Generation Z in Indonesia related to finance. The report, which involved 602 respondents, shows what types of financial products are used, sources of income, and personas for each generation.

The survey results stated that all generations have savings with a percentage of more than 90% for each. The second most widely used financial product is paylater. Meanwhile, the younger generation (Gen Z) claims to have tried investment products such as stocks (27%).

Paylater is one of the most popular financial products for every generation. However, it could be that each generation has different consideration factors before deciding to use paylater, “said Head of Research Jakpat, Aska Primardi.

He highlighted the number of paylater users in Gen X (38%) which is more than Gen Z (34%). But at the same time, the number of insurance, mortgage, and credit card users is also more than Millennials and Gen Z.

“It could be that Gen X chooses paylater as a short-term financial solution in order to meet their needs, considering that at the same time they also have to allocate budget for other financial products,” said Aska.

Meanwhile, the highest number of paylater users is Millennials (44%). “At the same time they also have loans, mortgages, credit cards, and stocks. In addition, they also have dependents, the family, which must be paid for. Paylater can be a solution for all these needs,” said Aska.


Sources of income

All generations rely on salary as their main source of income, followed by non-formal income such as being a freelancer or owning another business. Gen Z, as predicted, still depends on parental income. As many as 45% of them admitted to making remittances from parents as a source of income. This affects the financial products used by this young generation.

“Gen Z uses paylater and at the same time also invests in stocks. Given that the majority of Gen Z’s income is still not optimal, because one of them comes from parents/family, to optimize the amount of stock investment each month, they will buy some of the necessities through the paylater feature. So that their hope to achieve financial freedom in the future can be achieved, and the most important thing now is that they can still fulfill the needs of life and lifestyle,” explained Aska.

One in four respondents claimed to have double income. Although not significant, Millennials are the generation that has the most dual income with a percentage of almost 30%. Then, 22% of respondents admitted that they only had income in terms of non-formal. One out of three Generation Xers does this.

All generations allocate half of their income to daily needs. Then, as much as 27% of income  is saved as savings.


3 Financial personas 

Jakpat divides financial personas into three types. First, Backwards tend to have little savings and rely on loans. As many as 11% of respondents fall into this category.

Then, the Stable  category where Generation X dominates with a percentage of almost 38%. These personas tend to ‘play it safe’ where they have savings but little investment. Lastly, Fordward-looking tend to be risk savvy where they have savings and investments. This group is dominated by Gen Z (30%).


Get the details on our report here.

property gen z - pexels-kindel-media-7578939

Gen Z Property Investment: Considerations, Preparations, & Mortgage

Generation Z (Gen Z) is now being the target in the property sector. The majority of this generation are at the level of college students and first jobbers, with single/unmarried status. This age group tends not to have economic strength yet but wants to invest in property. However, there are also those who have already bought property.

Jakpat conducted a survey to find out the perspective of Gen Z when it comes to property. The report involving 1,194 respondents shows what types of property investments they are eyeing, and financial preparation in applying for House Ownership Credit (KPR), and views on property rent.

The survey results stated that three out of five respondents planned to buy property in the future. Vacant land is the most common choice where 69% of Gen Z thought about investing in such properties. Meanwhile, 30% of them planned to buy a landed house.


The purpose of Gen Z buying property

As many as 75% of Gen Z would buy property as an investment. Increasingly expensive prices are also the reason 43% of Gen Z wanted to buy property. Other considerations are housing (40%) and business needs (36%).

The Jakpat report also found that location and property access are the top determinants for Gen Z in choosing the property they want to buy (79%). Interesting locations are those close to access to the city center and public facilities such as public transportation or shopping centers.

“Currently, the main reason they want to buy property, especially vacant land, is as a form of investment for the future. This is reinforced by the main consideration factors are the location and access of the property, as well as the surrounding environmental condition. Hopefully, these factors can later increase the value of their property as an investment product,” said Head of Research Jakpat, Aska Primardi.

In addition, this property investment is also planned to become passive income by renting it out. “This interest arises because of the vision to achieve financial freedom in the future,” added Aska.

Jabodetabek is a dream area for Gen Z to buy property. Only 6% of respondents were interested in buying property outside Java, Bali, and Nusa Tenggara.


Gen Z’s preparation for buying property

As many as 29% of Gen Z planned to buy a property in the next 1-3 years. Meanwhile, 27% of respondents planned something similar in the next 4-5 years and another 20% of them projected it more than 5 years.

Two out of five Gen Zers preferred to buy property at their own budget. Then, 36% wanted to buy it with a partner and 31% were assisted by parents. Only 10% intended to buy property with a business partner.


Gen Z counts mortgage

One in four Gen Z wanted to buy property through a mortgage. The majority of those who choose this option intended to choose a 10-year tenor. There are various reasons for considering the amount of tenor chosen, one of which is the ability to pay installments (70%).


Get the details on our report here.

banner property

Property Perspective from Gen Z

Gen Z is starting to become the target as property buyers. This age group is in the scouting stage, not yet having economic strength but already aspiring to own their own home. Thus, in this report, Jakpat will share some highlights of insights from Gen Z about buying or investing property.

These results are based on a survey conducted on 22nd-23rd of May 2023.

Key research points:

  • Consideration on buying property
  • Preparation of buying property
  • Determining KPR term
  • Thoughts on renting property

Here are some previews of the report:

2 Property Prespective from Gen Z - Thinking about buying property

3 Property Prespective from Gen Z - Timeline of buying

Complete Report Can Be Downloaded Below

Want to Run A Survey?

or Email Us at partner@jakpat.net

Banner Blog - Understanding Gen Z - Insight Report, Vol. 1

Understanding Gen Z

Gen Z is the target now since this population grows and dominates in Indonesia. It is important to understand them. Thus, in this report, Jakpat will share highlights of insights from Gen Z nowadayas.

These results are based on several daily surveys conducted several times in the period of 2022-2023.

Key Research points:

  • Social Media Consumption
  • Shopping Habit
  • Career Choice
  • Personal Lifestyle
  • Financial Plan

Here are some previews of the report

Understanding Gen Z 1

Understanding Gen Z 2

Complete Report Can Be Downloaded Below

Want to Run A Survey?

or Email Us at partner@jakpat.net

pets - pexels-alexander-grey-1909802.jpg

Which One is More Expensive, Taking Care of a Cat or a Dog?

Having pets is fun. It has many benefits, one of them is making the owner healthier, both physically and mentally. On the other hand, taking care of pets should not be underestimated, especially in terms of feeding.

Jakpat conducted a survey to find out how pets are treated, especially in cats and dogs. The report, which involved 1,225 respondents, shows what types of food are given to pets and the costs of that.

The survey results stated that 34% of respondents got a pet by buying it. Then, 30% took street animals and 28% got pets from acquaintances. In terms of numbers, about 42% of respondents claimed to have 2 or 3 pets and 35% had only 1. Almost 60% of them already keep pets for 1-5 years.


What animals are kept the most?

Cats are the most widely kept animals. One out of 4 respondents keep this species. The second most pets are fish with a percentage of 29%. Birds and dogs take third (20%) and fourth place (12%).

“Judging from the distribution by gender, cat keepers are equal in proportion between men and women. However, among fish and bird keepers, more male segments are in as compared to females. As we often see in the neighborhood, the most involved in the community of bird lovers are the male group. Conversely, for dog keepers, there are more in the female segment than men,” said Head of Research Jakpat, Aska Primardi.

The Jakpat report also found that most respondents give their pets 3 times a day, especially for cats (67%) and rodents (51%) such as hamsters. Meanwhile, animals that are usually fed 2 times a day are chickens (65%), reptiles (61%), dogs (51%), and fish (49%).


Comparing the care of cats and dogs

Jakpat compared the care of two of the most common pets, cats and dogs. The average cost of caring for one dog is Rp1.8 million while per cat is Rp1.4 million. In terms of food, the average dog owners spend IDR 1 million while cats owners spend IDR 710 thousand. In conclusion, the maintenance of dogs is more expensive than cats.

“People seem to spend more to raise dogs than cats. From the initial stage, it can be seen that the majority get dogs by buying them, while cat lovers get cats from the streets (abandoned),” commented Aska.

He highlighted the cost of more care in raising dogs than cats. “Because of these larger budget demands, it’s no wonder that in one household, fewer dogs are kept than the number of cats kept. However, this larger budget is still acceptable for animal lovers as long as they can still find a positive experience from this activity,” Aska responded.

Whiskas, Me-O,  and  Royal Canin are the top three most recognized and purchased brands among cat owners. Then, as many as 56% of respondents bought the brand of Whiskas for their furry friends. Followed by Me-O  (34%) and Bolt (29%).

For dog owners, the 3 most recognizable brands are Royal Canin, Happy Dog and Pedigree. Happy Dog is the most purchased food by respondents with a percentage of 42%. Pedigree and Royal Canin are next with a percentage of 40% each.

There are various reasons for choosing a food brand. As many as 73% of respondents admitted to choosing a certain brand because it is suitable for their pet. The other top reasons are that brands are easy to find (66%) and have good quality (58%).


Get the details on our report here.

Header Petcare Cost for Having Cats and Dogs

Petcare: Cost for Having Cats and Dogs

Some people enjoy having pets. Even, some people consider pets as friends. Pets are not just animals. On the other hand, taking care of pets is a serious thing. Feeding pets is not as easy as it seems since there are many pet food choices.

Thus, in this report, Jakpat will present the result of the survey to 1.225 respondents nationwide about how pet owners take care of their favorite animals, especially cats and dogs.

1 Background Petcare Cost for Having Cats and Dogs - Jakpat Survey Report 2023

2 Petcare Cost for Having Cats and Dogs - Jakpat Survey Report 2023

3 Petcare Cost for Having Cats and Dogs - Jakpat Survey Report 2023

For more detailed data, please download the PDF file down below.

Download button

Ready to Send A Survey?

BUTTON CREATE

ramadan 4 - pexels-thirdman-7957121.jpg

Ramadan 2023: Gen Z Choose to Save THR, for Financial Freedom?

It is undeniable that spending in Ramadan 2023 tends to be bigger, such as for holiday needs and religious donations. On the one hand, workers also get a Holiday Allowance (THR).

Jakpat conducted a survey to find out expenses in Ramadan. The report, which involved 1255 Muslim respondents, shows the needs of Ramadan, including the use of THR and zakat payments. Respondents were split between 33% of Gen Z, 49% of Millennials, and 18% of Gen X.


Ramadan 2023 expenses

In general, spending in Ramadan 2023 is related to the moment. Zakat/infaq/shadaqah is in the first position with a percentage of 86%. Other needs of respondents are Ramadan shopping such as clothes, accessories, or worship equipment as much as 74% and food shopping for Ramadan and Eid al-Fitr 73%. Eidi (cash gift), homecoming, and Eid al-Fitr hampers were also included in the calculation of Ramadan expenses this year.

As many as 70% of respondents used their monthly salary for Ramadan 2023 expenses. Other sources were 63% THR and 53% savings. More specifically, Gen Z relied on THR (63%) and savings (61%) as a source of funds for Ramadan 2023 expenses. Two other generations, Millennials and Gen Xers, used salary as their primary source, with a significant gap between THR and savings.


What were THR for?

Jakpat respondents used THR for various things, in addition to shopping for Eid clothes (48%) and zakat/infaq/shadaqah (42%). Some saved the money (41%) and used it for daily needs (35%).

Some respondents used THR to share, such as giving it to loved ones (32%), Eid cash gift (29%), and giving Ramadan hampers (25%).

As many as 53% of Gen Z chose to save THR. Meanwhile, half of Millennials and Gen X spent THR by shopping for Eid clothes and paying zakat/infaq/shadaqah.

“In general, people use THR to meet their needs during Eid, starting from Eid clothes, transportation costs and homecoming accommodation, Eidi cash gift, holidays, celebrations and food. It’s just that there is a different trend among Gen Z, where more than 50% chose to save it. It could be because they are still young and there are no demands to meet the needs of Eid events in their families, or they have certain goals,” said Head of Research Jakpat, Aska Primardi.

“We see that the reason Gen Z saves is to quickly achieve financial freedom. It can be seen that the number of Gen Z who allocate THR to buy investment products is more than Gen X and Gen Y. In addition, Gen Z savings are also planned to buy tickets for various events throughout 2023, one of which is music concerts from international musicians,” he continued.


Paying zakat offline is more convincing

As many as 90% of Jakpat respondents chose to pay zakat directly, either by distributing it to the amil zakat agency in the mosque/neighborhood or giving it directly to those who are entitled to receive the religious donation. The reason is that they felt more confident in the contract (72%) and more practical in the process of giving (56%).

Meanwhile, respondents who chose to pay zakat online were divided in three ways. First, distributed it to online zakat agencies via official websites such as Baznas, Dompet Dhuafa, or Rumah Zakat (5%), then paid through the Gopay, LinkAja, or OVO e-wallet or e-commerce applications (4%). The last one, they chose to pay Zakat through mobile banking  applications such as BCA Mobile, Livin by Mandiri, or Jenius.


Ramadan 2023 edition ads

Ramadan edition ads also enliven the nuance of the holy month, 64% of Jakpat respondents claimed to enjoy this commercial. Four out of 5 of these respondents watched the ad on TV. Followed by YouTube (59%) and social media such as Instagram, Facebook, or TikTok (57%).

Digital Ramadan advertising exposure dominated all generations. After TV, Gen Z admitted to seeing such ads on social media more often (64%) than YouTube (58%). Meanwhile, Gen X (28%) admitted to seeing more Ramadan ads on websites such as online  news than Gen Z (21%) and Millennials (24%).


Get the details on our report  here.