Tag Archives: survey millennials jakpat

health habit - pexels-ketut-subiyanto-4426318

Health Habits 2023: Knows the Health Risks But Lifestyle Remains Unhealthy

Each generation has different consumption behaviors when it comes to maintaining health. This is caused by various factors such as what is consumed to physical activity that is done.

Jakpat conducted a survey to find out the perspectives of Generation X, Generation Y (Millennials), and Generation Z in Indonesia regarding how they maintain health. The report, which involved 600 respondents, shows the consumption of water, sugar, and carbohydrates; exercise habits; and awareness of health risks.


Water VS Sugary Drinks

Only 16% of respondents have the habit of drinking enough water every day. In fact, those who often forget to drink water are twice as much as those who have this healthy habit. This means that awareness of the importance of drinking water in Indonesia is low for all generations.

The results of the Jakpat survey also found that 67% of respondents consumed sugary drinks 1-2 times a day. However, another 15% claimed to be sugar-free. In terms of gender, the percentage of women who adopt a sugar-free lifestyle is twice than men.

In terms of food, rice is still a staple food with more than 60% of respondents consuming this food every day. On the one hand, 16% of respondents admitted to eating fried foods every day.

However, respondents are aware of the importance of healthy and nutritious food. More than half of them have a balanced eating habit by eating vegetables and fruits. Also, 12% of them reduced their carbohydrate intake and 9% checked nutrition labels.

Women also tend to be healthier than men. The survey results showed that women ate a balanced diet (54%) and reduced sugar (30%) and carbohydrates (15%).


Lurking health hazards

Health risks, namely disease, were also of concern to respondents. More than half of Millennials (55%) and Gen X (52%) are wary of cholesterol. Meanwhile, digestive diseases are more of a concern for Gen Z (54%).

In terms of gender, women who are aware of the risk of diabetes, tend to do prevention. As many as 17% of them cut back on sugar, while only 9% of men did the same.

“They realize that these problems are caused by excessive consumption of sugary drinks, lack of mineral water consumption, excessive consumption of carbohydrates, and lack of exercise. The steps they take to overcome this problem are exercising from light to heavy, and also changing the pattern of food and beverage consumption, “said Head of Research Jakpat, Aska Primardi.


The importance of exercise

One in three respondents rated walking somewhere as a form of exercise. Meanwhile, 32% of respondents routinely exercise lightly once a week. As many as 16% did not do physical activity at all.


Get the details on our report here.

financial habit pexels-picas-joe-11348119

Financial Product Survey: Paylater as The Most Desirable

Each generation has different consumption behavior when it comes to finance. This is due to various factors such as exposure, usage, and attitude to available financial products.

Jakpat conducted a survey to find out the perspectives of Generation X, Generation Y (Millennials), and Generation Z in Indonesia related to finance. The report, which involved 602 respondents, shows what types of financial products are used, sources of income, and personas for each generation.

The survey results stated that all generations have savings with a percentage of more than 90% for each. The second most widely used financial product is paylater. Meanwhile, the younger generation (Gen Z) claims to have tried investment products such as stocks (27%).

Paylater is one of the most popular financial products for every generation. However, it could be that each generation has different consideration factors before deciding to use paylater, “said Head of Research Jakpat, Aska Primardi.

He highlighted the number of paylater users in Gen X (38%) which is more than Gen Z (34%). But at the same time, the number of insurance, mortgage, and credit card users is also more than Millennials and Gen Z.

“It could be that Gen X chooses paylater as a short-term financial solution in order to meet their needs, considering that at the same time they also have to allocate budget for other financial products,” said Aska.

Meanwhile, the highest number of paylater users is Millennials (44%). “At the same time they also have loans, mortgages, credit cards, and stocks. In addition, they also have dependents, the family, which must be paid for. Paylater can be a solution for all these needs,” said Aska.


Sources of income

All generations rely on salary as their main source of income, followed by non-formal income such as being a freelancer or owning another business. Gen Z, as predicted, still depends on parental income. As many as 45% of them admitted to making remittances from parents as a source of income. This affects the financial products used by this young generation.

“Gen Z uses paylater and at the same time also invests in stocks. Given that the majority of Gen Z’s income is still not optimal, because one of them comes from parents/family, to optimize the amount of stock investment each month, they will buy some of the necessities through the paylater feature. So that their hope to achieve financial freedom in the future can be achieved, and the most important thing now is that they can still fulfill the needs of life and lifestyle,” explained Aska.

One in four respondents claimed to have double income. Although not significant, Millennials are the generation that has the most dual income with a percentage of almost 30%. Then, 22% of respondents admitted that they only had income in terms of non-formal. One out of three Generation Xers does this.

All generations allocate half of their income to daily needs. Then, as much as 27% of income  is saved as savings.


3 Financial personas 

Jakpat divides financial personas into three types. First, Backwards tend to have little savings and rely on loans. As many as 11% of respondents fall into this category.

Then, the Stable  category where Generation X dominates with a percentage of almost 38%. These personas tend to ‘play it safe’ where they have savings but little investment. Lastly, Fordward-looking tend to be risk savvy where they have savings and investments. This group is dominated by Gen Z (30%).


Get the details on our report here.

pets - pexels-alexander-grey-1909802.jpg

Which One is More Expensive, Taking Care of a Cat or a Dog?

Having pets is fun. It has many benefits, one of them is making the owner healthier, both physically and mentally. On the other hand, taking care of pets should not be underestimated, especially in terms of feeding.

Jakpat conducted a survey to find out how pets are treated, especially in cats and dogs. The report, which involved 1,225 respondents, shows what types of food are given to pets and the costs of that.

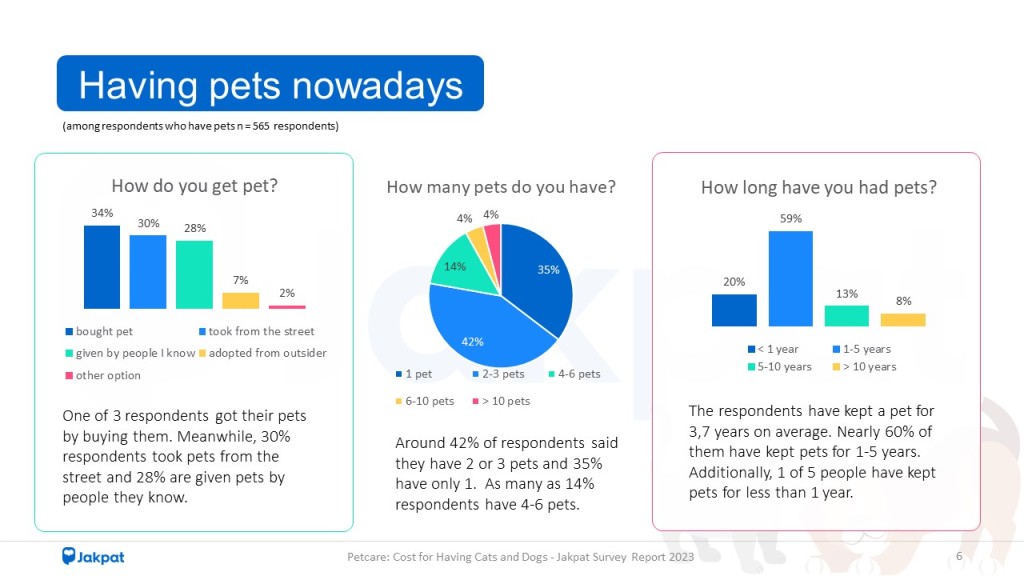
The survey results stated that 34% of respondents got a pet by buying it. Then, 30% took street animals and 28% got pets from acquaintances. In terms of numbers, about 42% of respondents claimed to have 2 or 3 pets and 35% had only 1. Almost 60% of them already keep pets for 1-5 years.


What animals are kept the most?

Cats are the most widely kept animals. One out of 4 respondents keep this species. The second most pets are fish with a percentage of 29%. Birds and dogs take third (20%) and fourth place (12%).

“Judging from the distribution by gender, cat keepers are equal in proportion between men and women. However, among fish and bird keepers, more male segments are in as compared to females. As we often see in the neighborhood, the most involved in the community of bird lovers are the male group. Conversely, for dog keepers, there are more in the female segment than men,” said Head of Research Jakpat, Aska Primardi.

The Jakpat report also found that most respondents give their pets 3 times a day, especially for cats (67%) and rodents (51%) such as hamsters. Meanwhile, animals that are usually fed 2 times a day are chickens (65%), reptiles (61%), dogs (51%), and fish (49%).


Comparing the care of cats and dogs

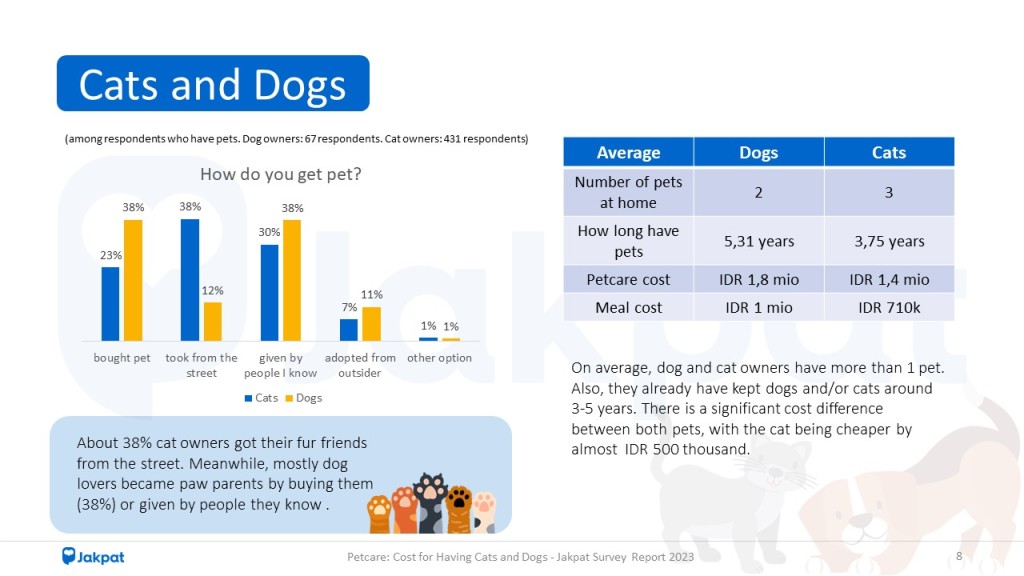
Jakpat compared the care of two of the most common pets, cats and dogs. The average cost of caring for one dog is Rp1.8 million while per cat is Rp1.4 million. In terms of food, the average dog owners spend IDR 1 million while cats owners spend IDR 710 thousand. In conclusion, the maintenance of dogs is more expensive than cats.

“People seem to spend more to raise dogs than cats. From the initial stage, it can be seen that the majority get dogs by buying them, while cat lovers get cats from the streets (abandoned),” commented Aska.

He highlighted the cost of more care in raising dogs than cats. “Because of these larger budget demands, it’s no wonder that in one household, fewer dogs are kept than the number of cats kept. However, this larger budget is still acceptable for animal lovers as long as they can still find a positive experience from this activity,” Aska responded.

Whiskas, Me-O,  and  Royal Canin are the top three most recognized and purchased brands among cat owners. Then, as many as 56% of respondents bought the brand of Whiskas for their furry friends. Followed by Me-O  (34%) and Bolt (29%).

For dog owners, the 3 most recognizable brands are Royal Canin, Happy Dog and Pedigree. Happy Dog is the most purchased food by respondents with a percentage of 42%. Pedigree and Royal Canin are next with a percentage of 40% each.

There are various reasons for choosing a food brand. As many as 73% of respondents admitted to choosing a certain brand because it is suitable for their pet. The other top reasons are that brands are easy to find (66%) and have good quality (58%).


Get the details on our report here.

Header Petcare Cost for Having Cats and Dogs

Petcare: Cost for Having Cats and Dogs

Some people enjoy having pets. Even, some people consider pets as friends. Pets are not just animals. On the other hand, taking care of pets is a serious thing. Feeding pets is not as easy as it seems since there are many pet food choices.

Thus, in this report, Jakpat will present the result of the survey to 1.225 respondents nationwide about how pet owners take care of their favorite animals, especially cats and dogs.

1 Background Petcare Cost for Having Cats and Dogs - Jakpat Survey Report 2023

2 Petcare Cost for Having Cats and Dogs - Jakpat Survey Report 2023

3 Petcare Cost for Having Cats and Dogs - Jakpat Survey Report 2023

For more detailed data, please download the PDF file down below.

Download button

Ready to Send A Survey?

BUTTON CREATE

ramadan 4 - pexels-thirdman-7957121.jpg

Ramadan 2023: Gen Z Choose to Save THR, for Financial Freedom?

It is undeniable that spending in Ramadan 2023 tends to be bigger, such as for holiday needs and religious donations. On the one hand, workers also get a Holiday Allowance (THR).

Jakpat conducted a survey to find out expenses in Ramadan. The report, which involved 1255 Muslim respondents, shows the needs of Ramadan, including the use of THR and zakat payments. Respondents were split between 33% of Gen Z, 49% of Millennials, and 18% of Gen X.


Ramadan 2023 expenses

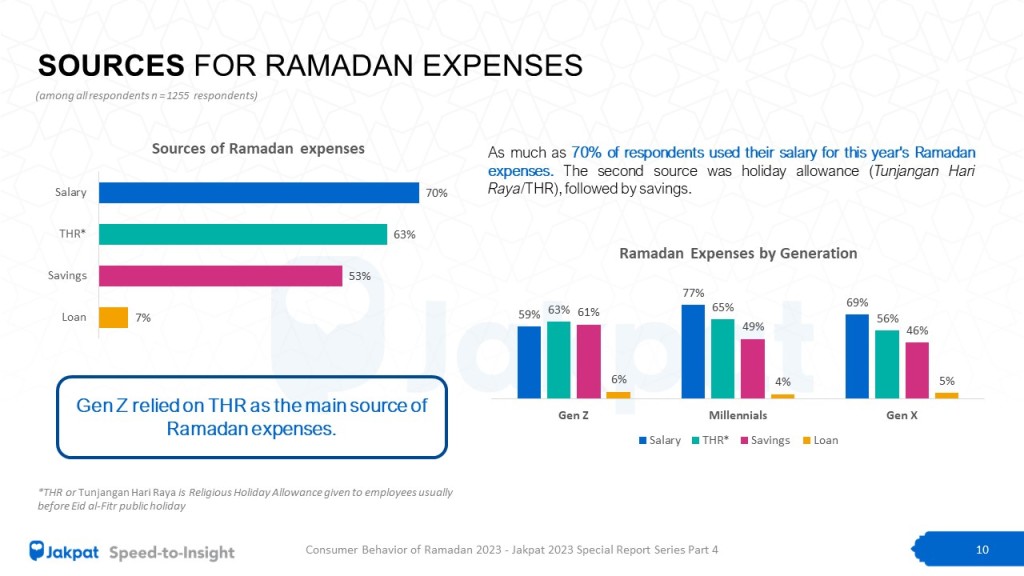
In general, spending in Ramadan 2023 is related to the moment. Zakat/infaq/shadaqah is in the first position with a percentage of 86%. Other needs of respondents are Ramadan shopping such as clothes, accessories, or worship equipment as much as 74% and food shopping for Ramadan and Eid al-Fitr 73%. Eidi (cash gift), homecoming, and Eid al-Fitr hampers were also included in the calculation of Ramadan expenses this year.

As many as 70% of respondents used their monthly salary for Ramadan 2023 expenses. Other sources were 63% THR and 53% savings. More specifically, Gen Z relied on THR (63%) and savings (61%) as a source of funds for Ramadan 2023 expenses. Two other generations, Millennials and Gen Xers, used salary as their primary source, with a significant gap between THR and savings.


What were THR for?

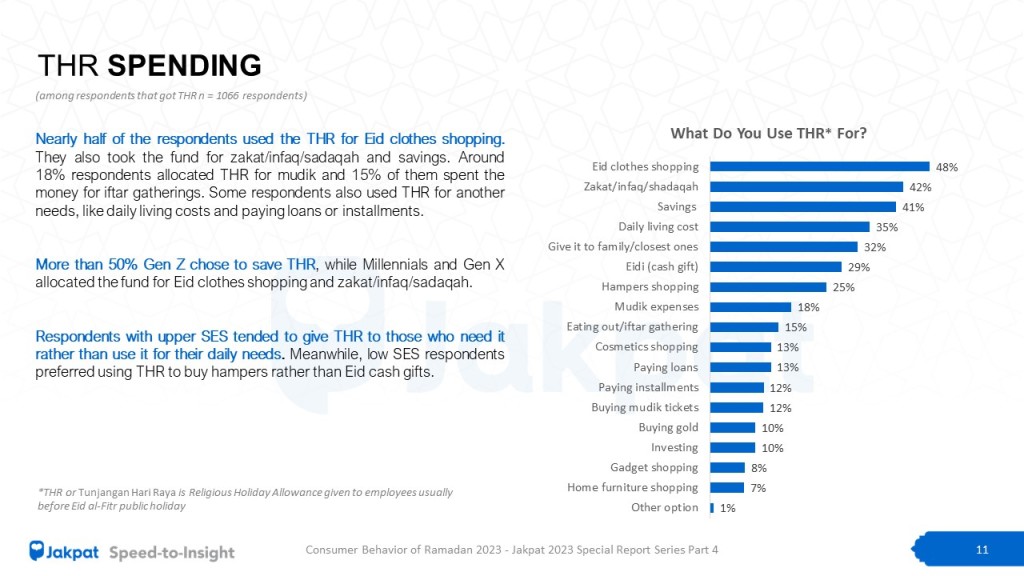
Jakpat respondents used THR for various things, in addition to shopping for Eid clothes (48%) and zakat/infaq/shadaqah (42%). Some saved the money (41%) and used it for daily needs (35%).

Some respondents used THR to share, such as giving it to loved ones (32%), Eid cash gift (29%), and giving Ramadan hampers (25%).

As many as 53% of Gen Z chose to save THR. Meanwhile, half of Millennials and Gen X spent THR by shopping for Eid clothes and paying zakat/infaq/shadaqah.

“In general, people use THR to meet their needs during Eid, starting from Eid clothes, transportation costs and homecoming accommodation, Eidi cash gift, holidays, celebrations and food. It’s just that there is a different trend among Gen Z, where more than 50% chose to save it. It could be because they are still young and there are no demands to meet the needs of Eid events in their families, or they have certain goals,” said Head of Research Jakpat, Aska Primardi.

“We see that the reason Gen Z saves is to quickly achieve financial freedom. It can be seen that the number of Gen Z who allocate THR to buy investment products is more than Gen X and Gen Y. In addition, Gen Z savings are also planned to buy tickets for various events throughout 2023, one of which is music concerts from international musicians,” he continued.


Paying zakat offline is more convincing

As many as 90% of Jakpat respondents chose to pay zakat directly, either by distributing it to the amil zakat agency in the mosque/neighborhood or giving it directly to those who are entitled to receive the religious donation. The reason is that they felt more confident in the contract (72%) and more practical in the process of giving (56%).

Meanwhile, respondents who chose to pay zakat online were divided in three ways. First, distributed it to online zakat agencies via official websites such as Baznas, Dompet Dhuafa, or Rumah Zakat (5%), then paid through the Gopay, LinkAja, or OVO e-wallet or e-commerce applications (4%). The last one, they chose to pay Zakat through mobile banking  applications such as BCA Mobile, Livin by Mandiri, or Jenius.


Ramadan 2023 edition ads

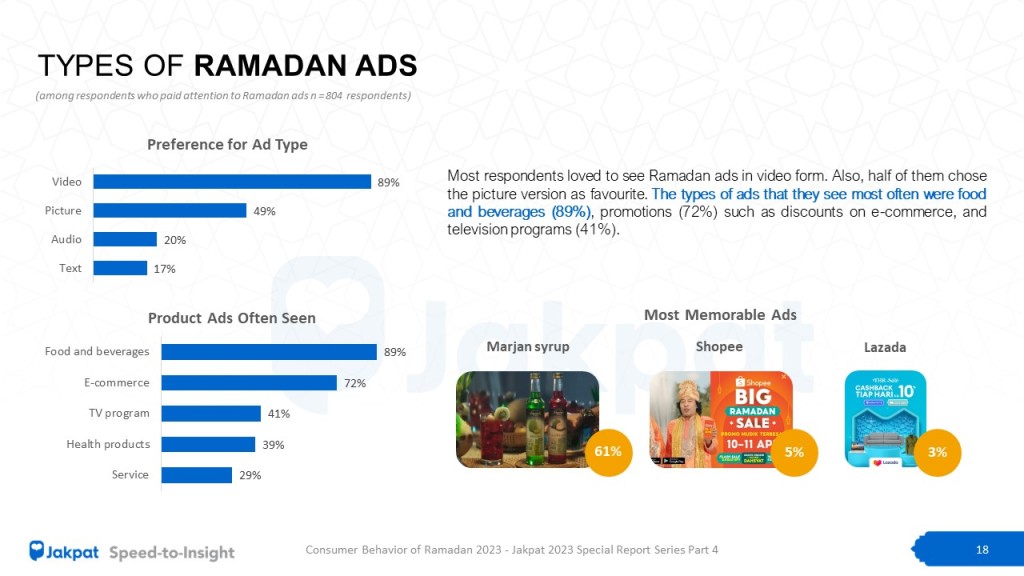
Ramadan edition ads also enliven the nuance of the holy month, 64% of Jakpat respondents claimed to enjoy this commercial. Four out of 5 of these respondents watched the ad on TV. Followed by YouTube (59%) and social media such as Instagram, Facebook, or TikTok (57%).

Digital Ramadan advertising exposure dominated all generations. After TV, Gen Z admitted to seeing such ads on social media more often (64%) than YouTube (58%). Meanwhile, Gen X (28%) admitted to seeing more Ramadan ads on websites such as online  news than Gen Z (21%) and Millennials (24%).


Get the details on our report  here.

Header Blog-Ramadan-Part 4_V1

Part 4: Consumer Behavior of Ramadan 2023 – JAKPAT Ramadan Special Report 2023

Each generation prioritizes different things for Ramadan 2023. However, they still allocate funds for zakat. Apart from that, big spending is also dominated by needs in the holy month, like Ramadan shopping and Ramadan food shopping. Of course, one of the sources is the religious holiday allowance (THR). In addition, many Ramadan edition advertisements (ads) appeared this year. Some of them are interesting to talk about.

Thus, Jakpat conducted a survey of 1255 Muslim respondents across different regions in Indonesia to capture their financial for Ramadan 2023, including THR and zakat, and Ramadan edition ads. This report also contains consumer behavior during the holy month including preparing suhoor & iftar, media consumption, and online & in-store shopping.

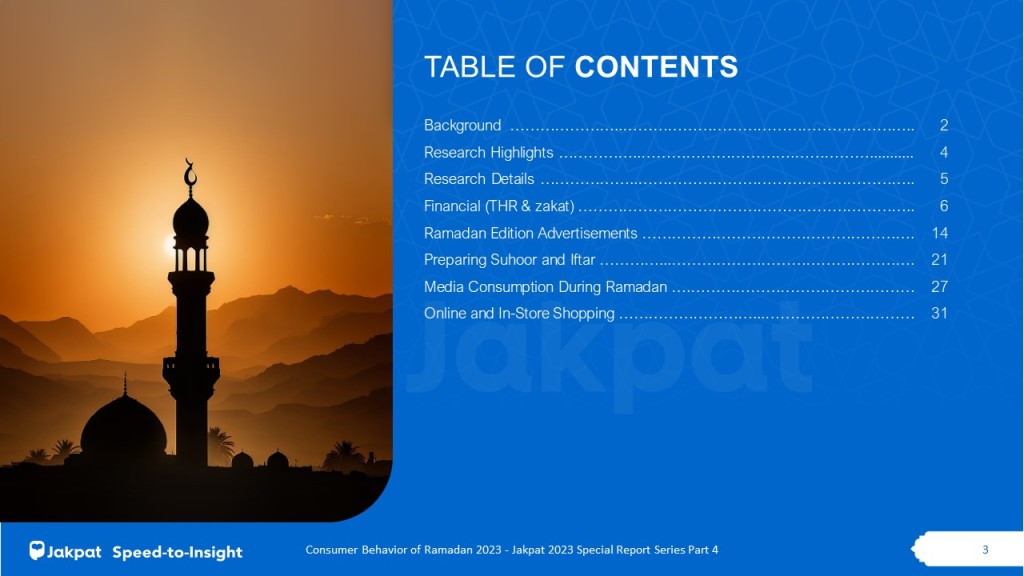
Table of Contents Consumer Behavior of Ramadan 2023 – JAKPAT Ramadan Special Report 2023

Ramadan expenses Consumer Behavior of Ramadan 2023 – JAKPAT Ramadan Special Report 2023

THR Consumer Behavior of Ramadan 2023 – JAKPAT Ramadan Special Report 2023

Ads Consumer Behavior of Ramadan 2023 – JAKPAT Ramadan Special Report 2023

For more detailed data, please download the PDF file down below.

Download button

Ready to Send A Survey?

BUTTON CREATE

ramadan 2 - pexels-rdne-stock-project-7249190

Ramadan 2023: Eating & Hamper Trends Change

A number of changes on Ramadan 2023 occurred such as social media behavior, food consumption, and lifestyle. Preparing hampers have also been done at the beginning of this holy month.

Jakpat conducted a survey to find out how media and eating habits during Ramadan, especially at suhoor and iftar. The report, which involved 1371 Muslim respondents, shows what platforms are happy to use, the most consumed foods, and preparations for giving hampers in the early days of Ramadan 2023.


Youtube as the most accessed media

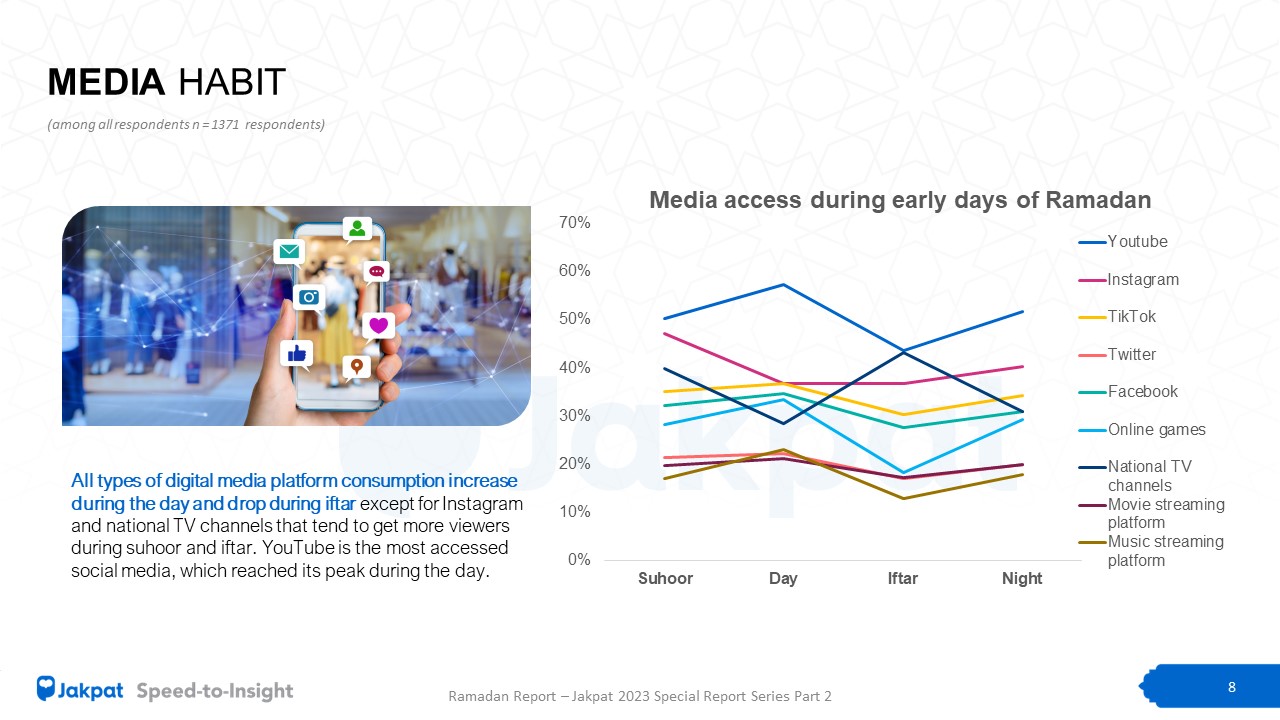
In general, digital media consumption increased during the day and decreased during iftar. But this habit applied inversely to Instagram and national TV channels. In fact, Instagram users tended to open the application more often at suhoor. On the other hand, Youtube was the most opened application during Ramadan, followed by Instagram and Twitter.

Entertainment and culinary were the most talked about topics in Ramadan 2023. Almost 50% of respondents liked these two topics. Other themes that are also often discussed were sports, religion, and the latest information. Almost all respondents used mobile phonesfor digital activities.


Cooked at home at suhoor and iftar 

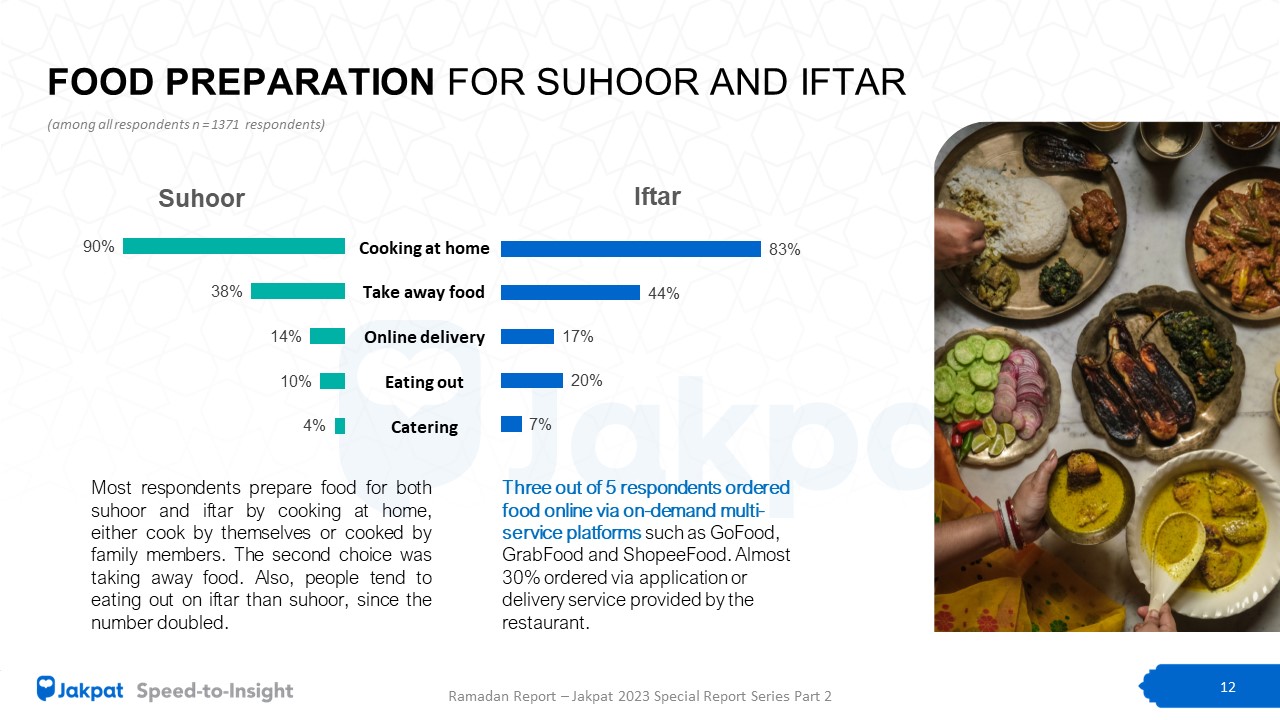
More than 80% of respondents cooked meals at home for suhoor or iftar, either cooking alone or prepared by family members. The types of dishes that are most often cooked at the beginning of Ramadan 2023 came from fresh food.

Other types of dishes that are most cooked at home at dawn were instant noodles (44%) and frozen foods such as nuggets or sausages (42%). Meanwhile, for iftar, 32% of respondents stated cooking frozen food (32%) and ready-to-eat food that can be eaten immediately after heating or frying, such as spiced chicken (ayam ungkep) or rendang.

“When compared with the Jakpat Ramadan report in 2022, we find that there is a downward trend in the number of people who break their fast outside the home. At the same time, there is an upward trend in the number of consumers who break their fast by cooking at home. This seems to be due to people’s purchasing power which has decreased since the second semester of 2022 yesterday due to inflationary factors, rising prices of basic necessities, to mass layoffs,” said Head of Research Jakpat, Aska Primardi.

“When viewed in more detail, we also find the fact that types of food with more expensive prices such as bread, ready-to-eat food, and frozenfood; Everything has decreased this year. The types of food that remain stable consumed by the majority of people are instant noodles for suhoor, and their own dishes for iftar,” he added.

Home dishes such as tempeh, fried chicken, or vegetable soup; became the most popular types of dishes to order  online  (online delivery). The second favorite food was fast food  for suhoor and Indonesian cuisine (such as meatballs, chicken noodles, and soto) for iftar at the beginning of Ramadan 2023. In addition, those who order food online tended to use multi-platform applications such as GoFood, GrabFood, and ShopeeFood.

Regarding drinks, almost 50% of respondents liked to consume tea-based drinks at dawn and iftar. Tea bags were the most popular type of drink. Then, milk and fruit-based drinks became the next two favorite choices.

The Jakpat survey also found that 3 out of 4 respondents took supplements and vitamins at the start of Ramadan 2023. Vitamin C (37%) and honey (31%) were the most consumed. As many as 64% of respondents consumed it at suhoor.


Hamper Ramadan as a form of friendship

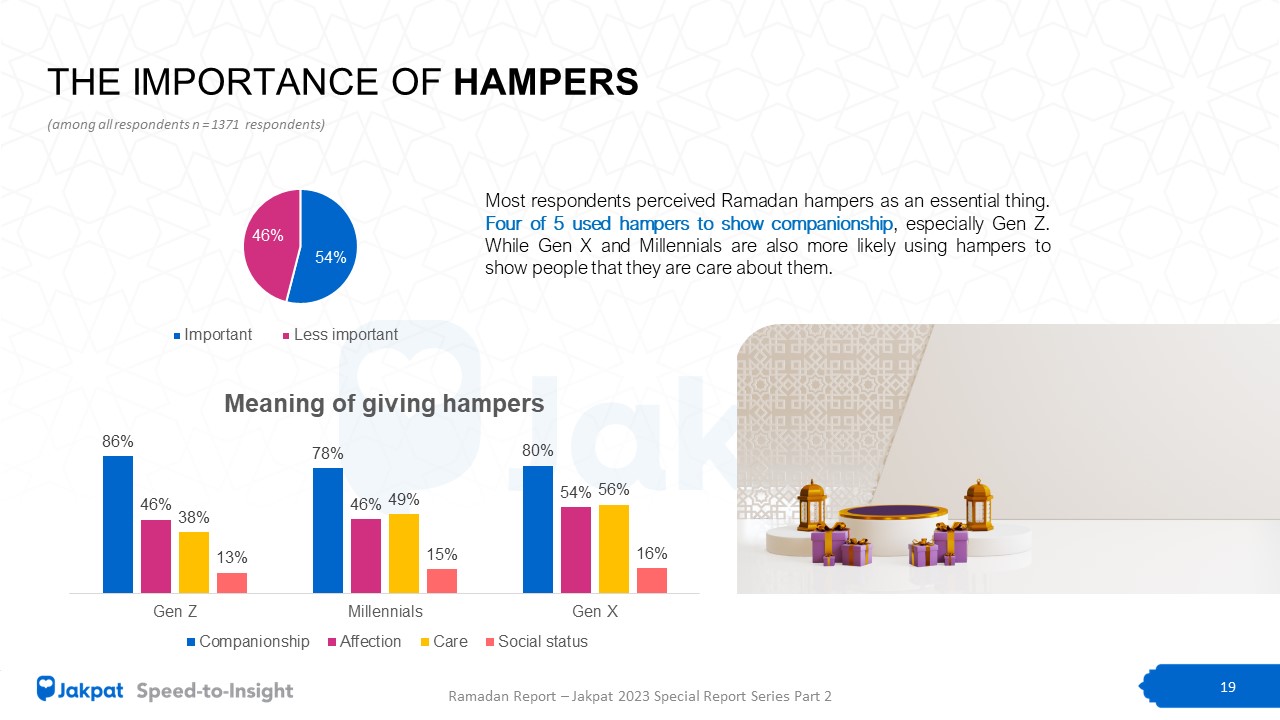
Half of respondents rated Ramadan as important. Four in 5 respondents viewed hampers as a form of friendship, especially Gen Z. Meanwhile, Gen X (56%) and Millennials (49%) tended to see Ramadan hampers as a form of their attention to the people they are given.

Four out of 5 respondents wanted to give a Ramadan hamper this year. A total of 63% planned to give to less than 10 people with the most targets being family and friends.

As many as 63% of respondents intended to order Ramadan hampers online, but they wanted to give them in person (70%). Basic necessities and packaged food & beverages were the most popular types of goods as hamper contents with a percentage of around 60% each. Regarding the budget, almost 45% of respondents allocated Rp100-200 thousand for each Ramadan hamper given with an average of Rp186,848.

“The impact of decreasing people’s purchasing power is also seen here, that in 2022 in the Jakpat report, the majority of people prefer to give cookies as an Eid al-Fitr hamper. This year the majority of people prefer to give basic necessities.. So it seems that in the current economic situation, people are refocusing on meeting their basic needs first,” concluded Aska.


Get the details on our report here.

Header Ramadan Report 1 Part 2_V2

Part 2: Media Habit, Food Consumption, & Hampers – JAKPAT Ramadan Special Report 2023

A few things change in the month of Ramadan 2023, such as media habit, food consumption, and lifestyle. Easiness in digital era helps people to do their activities, especially in spending time and ordering food at suhoor and iftar. In fact, most people also rely on ordering and buying digitally in delivering Ramadan hampers. But some people still enjoy doing conventional things, like home cooking when break fasting.

Thus, Jakpat conducted a survey of 1371 Muslim respondents across different regions in Indonesia to capture their habits during the early days of Ramadan 2023 including media habit, food preparation, lifestyle, and plans to give hampers.

Ramadan Report – Jakpat 2023 Special Report Series Part 2 Table of Contents

Ramadan Report – Jakpat 2023 Special Report Series Part 2 Media Habit

Ramadan Report – Jakpat 2023 Special Report Series Part 2 Food Preparation

Ramadan Report – Jakpat 2023 Special Report Series Part 2 Hampers

For more detailed data, please download the PDF file down below.

Download button

Ready to Send A Survey?

BUTTON CREATE

childfree - pexels-ксения-11686456

Gen Z and Millennials Views About Having Kids on Family

The presence of children in the family has become an exciting conversation on social media some time ago. Influencer Gita Savitri said not having children is natural anti-aging. Pros and cons regarding childfree also emerged. On the other hand, apart from the presence of children, the younger generation realizes that building a family is not easy.

Jakpat conducted a survey to find out how the younger generation views in preparing the household. The report, which involved 1,216 respondents, shows the considerations for stepping into a more serious level with their partner and the meaning of having kids in a family.

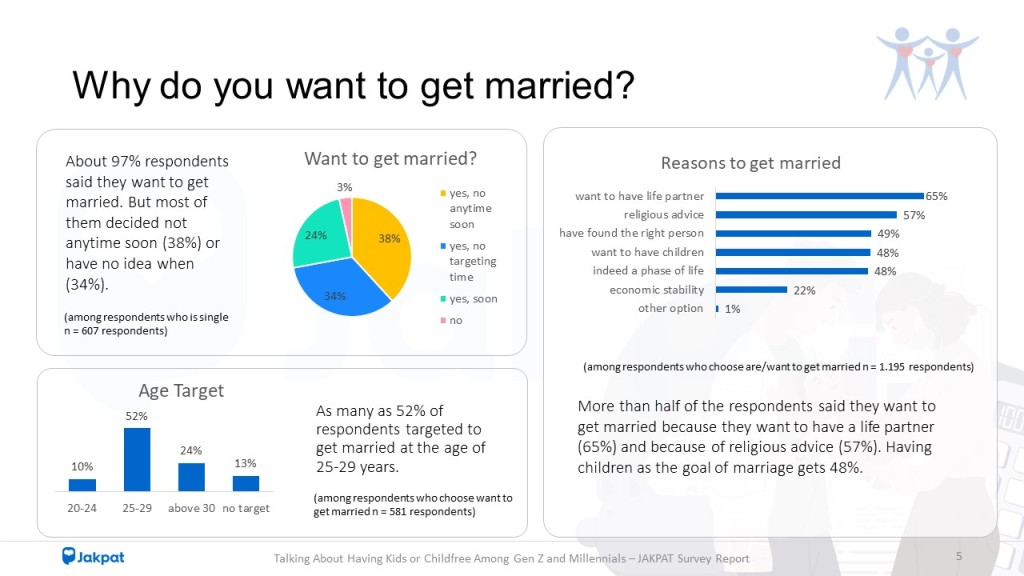
The survey result showed that 97% of single respondents, whether they have children or not, wanted or planned to get married. More than half of respondents said they wanted to get married because they wanted to have a mate (65%) and because of religious teachings (57%). In addition, 48% of them reasoned that they had found the right person, wanted to have children, and felt that getting married was indeed a phase of life that must be passed. As many as 52% of respondents targeted to get married at the age of 25-29 years.

“Among Gen Z and Millennials who are currently unmarried, they both want to get married in the future. The difference is Millennials want to get married in the near future, while Gen Z does not in the near future. This can be caused by the perception that the Millennials segment has now entered the upper limit of the ideal age in marriage,” said Head of Research Jakpat, Aska Primardi.

Meanwhile, the top three reasons respondents do not want to get married are not a priority, aware of being financially inadequate, and wanting to focus on a career with a percentage of 33% each.


What needs to be prepared in building a family?

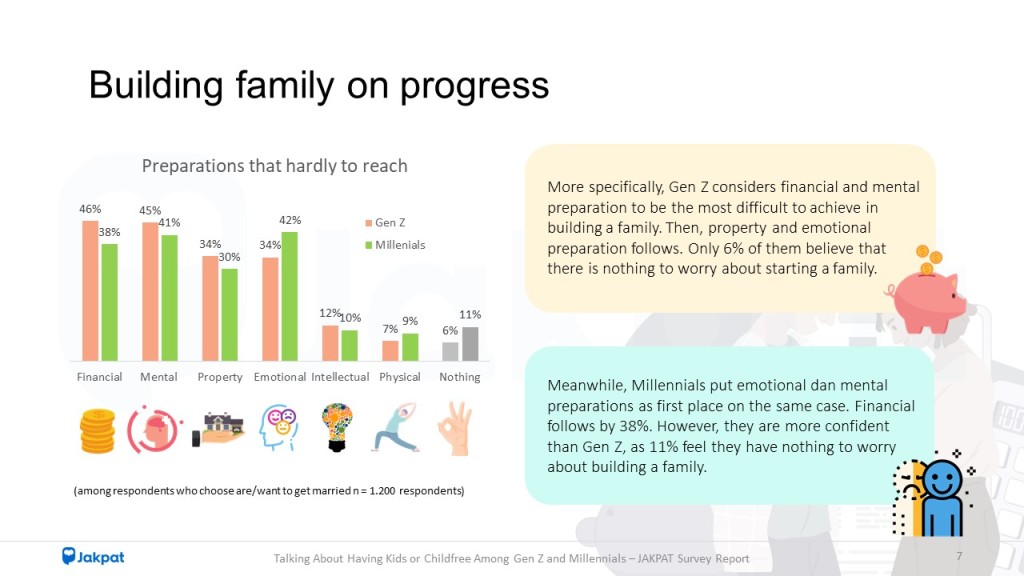
Jakpat grouped six types of abilities that need to be prepared in a household. First, mental preparation, meaning adaptation to life in pairs and families. Followed by financial preparation (such as the cost of daily needs and the cost of raising children) and property (such as owning a place to live and/or a vehicle). Then, physical preparation (physically health) and emotional preparation (being able to control actions). The last one, intellectual preparation, which means finding information about marriage and family.

As many as 91% of respondents rated mental preparation as the main thing in marriage. Then followed by financial preparation (87%) and emotion (78%). However, on the other hand, they are also aware that mental preparation is also the most difficult preparation to achieve (43%).


Young people’s views on having children in a family 

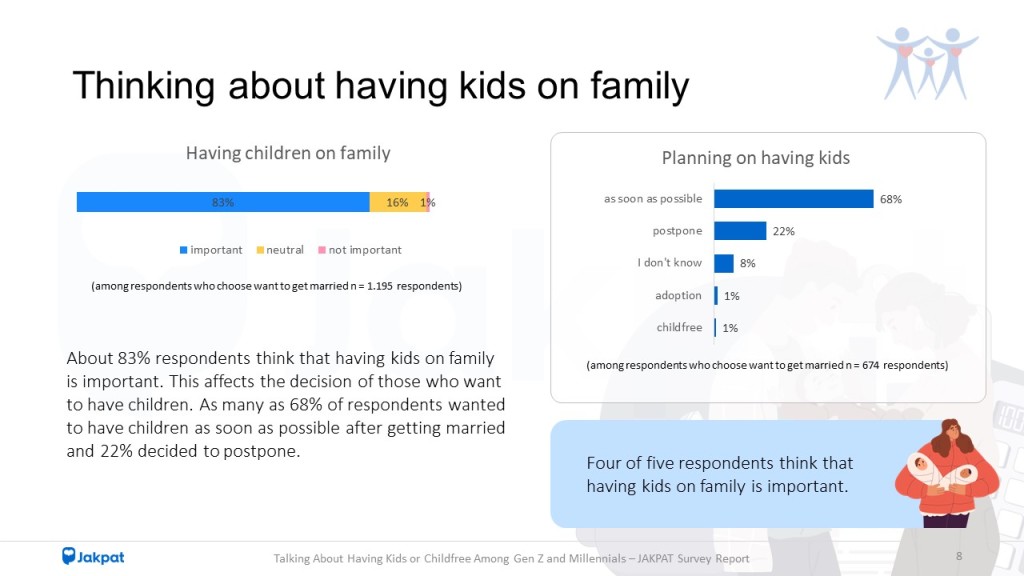
More than half of the respondents, consisting of Gen Z and Millennials, rated the presence of children as very important. While 16% thought the presence of a baby is normal and less than 1% felt it is unimportant.

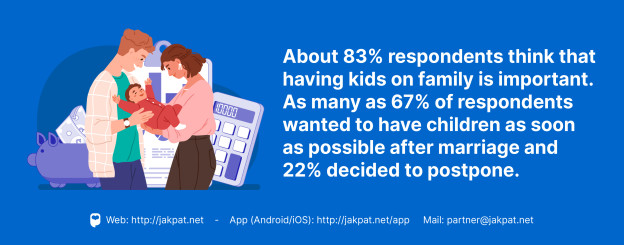
This certainly affects the decision of those who want to have children. As many as 67% of respondents wanted to have children as soon as possible after marriage. Meanwhile, 22% decided to postpone children after marriage and some others thought about adoption options.

Jakpat survey also shows that the group that wants to have children as soon as possible is dominated by the Millennial segment, while most Gen Z choose to postpone children after marriage.

“So although both of them wanted to get married, they had different plans about having children. When we explore the reason, we found that fewer Gen Z than Millennials agree with the opinion that “children are the door to sustenance” or “children who will take care of us in old age”. So it seems that there has been a shift in these values in the Gen Z segment,” said Aska.

This, he added, is in line with the projection data of the Central Statistics Agency (BPS) which stated that the population of children under five years old (toddlers) will decrease, in line with the downward trend in the birth rate in Indonesia.

On the other hand, there are various reasons to have children in a household. A total of 75% of respondents admitted that they really wanted to have offspring. The presence of the baby is also considered as a complement (69%) and an enhancer of happiness (68%) in the family.


Get the details on our report here.

survei jakpat childfree

Talking About Having Kids or Childfree Among Gen Z and Millennials – JAKPAT Survey Report 2023

Having children in the family became an interesting topic to talk about some time ago. It was triggered by an influencer, who declared herself as childfree, said not having kids is indeed a natural anti-aging. Her comments brought up various pro and con opinions about “baby on board” in family these days.

On the one hand, building a family is not as easy as it seems. Young generation realizes that there are many things that must be prepared to build a family. Starting from financial, emotional, and other things. Thus, in this report, JAKPAT will present the result of the survey to 1.216 respondents nationwide about what people think about creating a family, especially having children on it.

Slide5 Slide7 Slide8


For more detailed data, please download the PDF file down below.

Download button

Ready to Send A Survey?

BUTTON CREATE