Each generation has different consumption behavior when it comes to finance. This is due to various factors such as exposure, usage, and attitude to available financial products.
Jakpat conducted a survey to find out the perspectives of Generation X, Generation Y (Millennials), and Generation Z in Indonesia related to finance. The report, which involved 602 respondents, shows what types of financial products are used, sources of income, and personas for each generation.
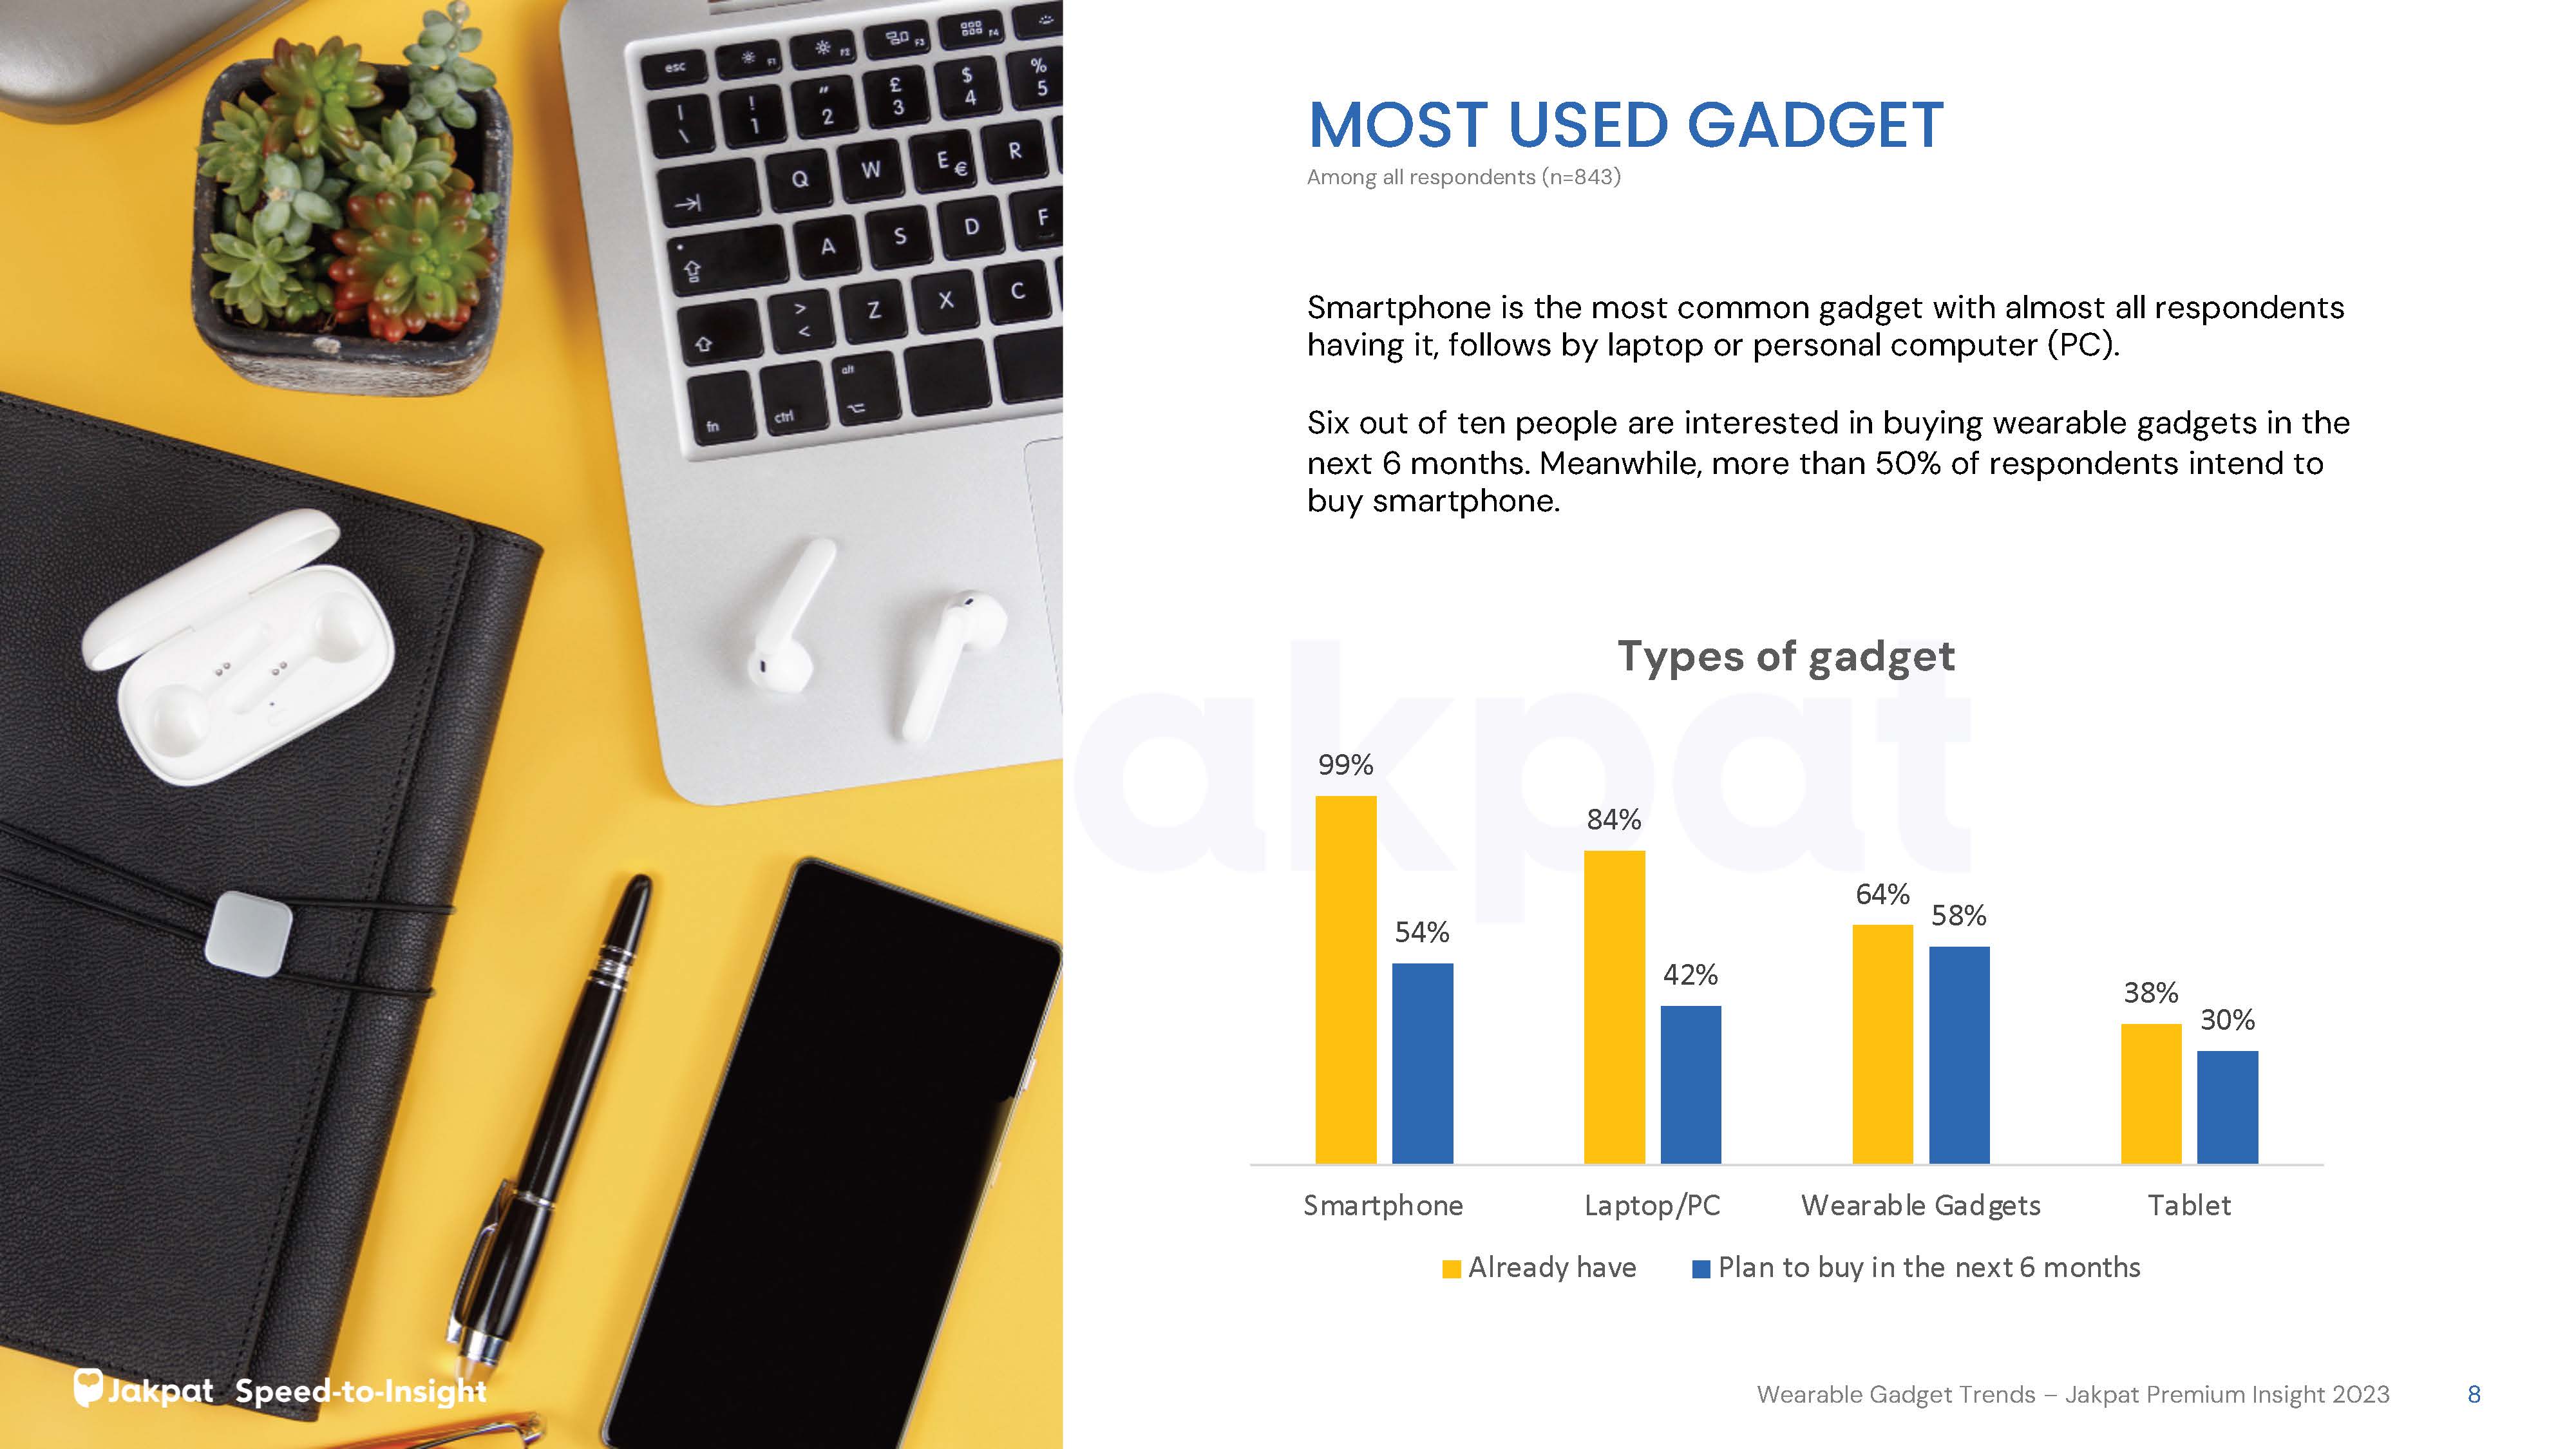
The survey results stated that all generations have savings with a percentage of more than 90% for each. The second most widely used financial product is paylater. Meanwhile, the younger generation (Gen Z) claims to have tried investment products such as stocks (27%).
“Paylater is one of the most popular financial products for every generation. However, it could be that each generation has different consideration factors before deciding to use paylater, “said Head of Research Jakpat, Aska Primardi.
He highlighted the number of paylater users in Gen X (38%) which is more than Gen Z (34%). But at the same time, the number of insurance, mortgage, and credit card users is also more than Millennials and Gen Z.
“It could be that Gen X chooses paylater as a short-term financial solution in order to meet their needs, considering that at the same time they also have to allocate budget for other financial products,” said Aska.
Meanwhile, the highest number of paylater users is Millennials (44%). “At the same time they also have loans, mortgages, credit cards, and stocks. In addition, they also have dependents, the family, which must be paid for. Paylater can be a solution for all these needs,” said Aska.
Sources of income
All generations rely on salary as their main source of income, followed by non-formal income such as being a freelancer or owning another business. Gen Z, as predicted, still depends on parental income. As many as 45% of them admitted to making remittances from parents as a source of income. This affects the financial products used by this young generation.
“Gen Z uses paylater and at the same time also invests in stocks. Given that the majority of Gen Z’s income is still not optimal, because one of them comes from parents/family, to optimize the amount of stock investment each month, they will buy some of the necessities through the paylater feature. So that their hope to achieve financial freedom in the future can be achieved, and the most important thing now is that they can still fulfill the needs of life and lifestyle,” explained Aska.
One in four respondents claimed to have double income. Although not significant, Millennials are the generation that has the most dual income with a percentage of almost 30%. Then, 22% of respondents admitted that they only had income in terms of non-formal. One out of three Generation Xers does this.
All generations allocate half of their income to daily needs. Then, as much as 27% of income is saved as savings.
3 Financial personas
Jakpat divides financial personas into three types. First, Backwards tend to have little savings and rely on loans. As many as 11% of respondents fall into this category.
Then, the Stable category where Generation X dominates with a percentage of almost 38%. These personas tend to ‘play it safe’ where they have savings but little investment. Lastly, Fordward-looking tend to be risk savvy where they have savings and investments. This group is dominated by Gen Z (30%).
Get the details on our report here.


![Header-[Premium Report] Fintech 1st Sem 2023_V5](https://blog.jakpat.net/wp-content/uploads/2023/08/Header-Premium-Report-Fintech-1st-Sem-2023_V5-624x243.jpg)

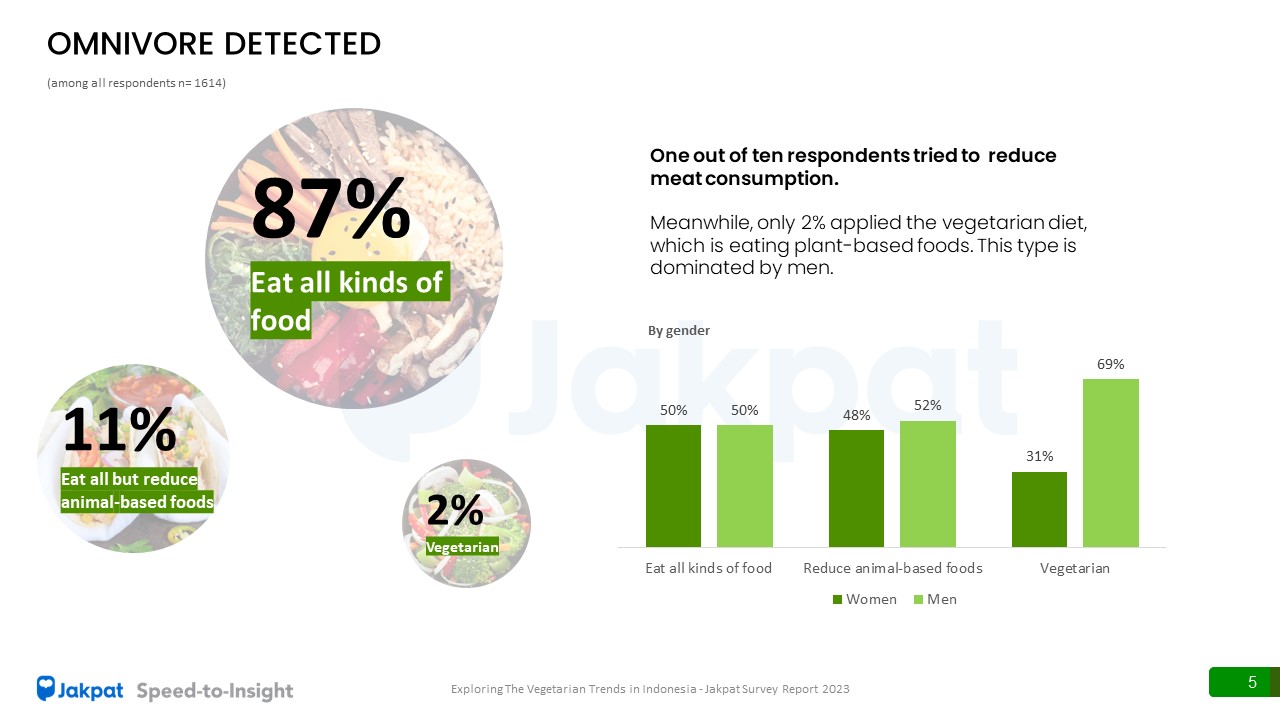
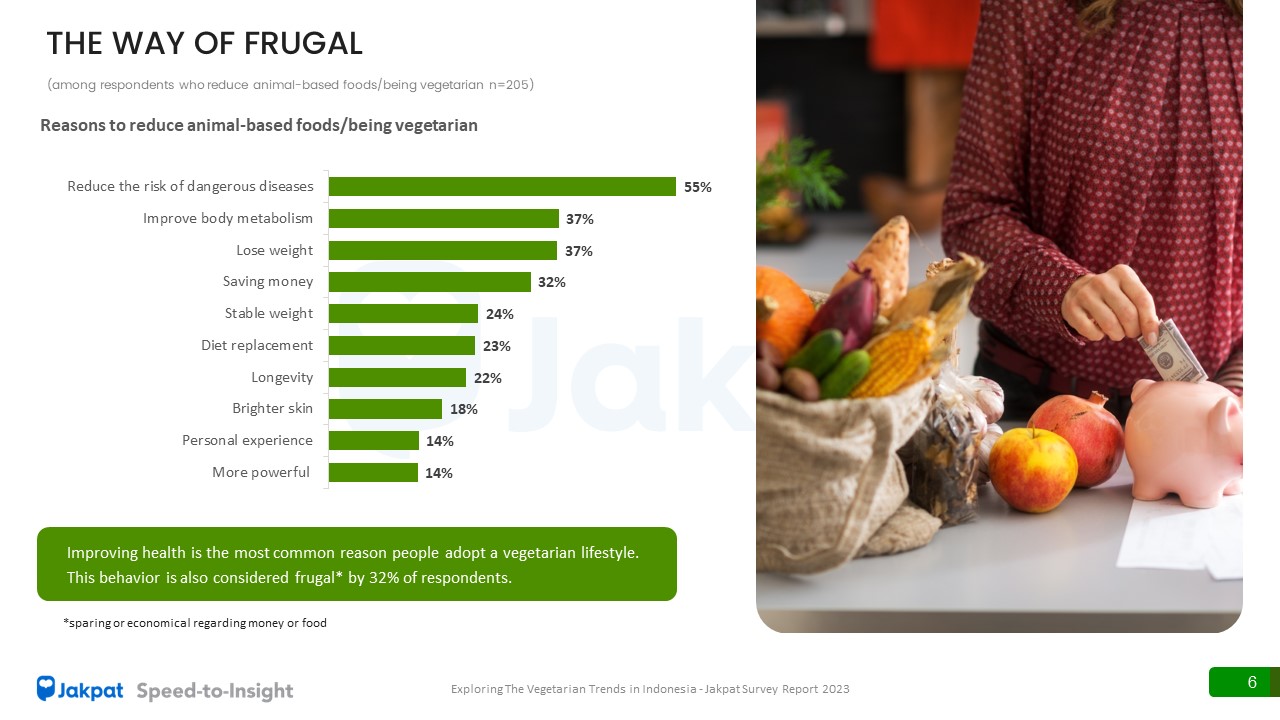
![Header-[Free Report] Vegetarian Trend_V1](https://blog.jakpat.net/wp-content/uploads/2023/07/Header-Free-Report-Vegetarian-Trend_V1-624x243.jpg)