Tag Archives: survey jakpat

The Installation of Billboards is The Type of Campaign Most Disliked by The Public

The Installation of Billboards is The Type of Campaign Most Disliked by The Public

Currently, Indonesian is faced with various campaign activities in various places and media ahead of the upcoming elections. Starting from the election of President and Vice President, members of the House of Representatives, members of district/city Legislative Councils, and members of regional representative councils.

Jakpat surveyed 1276 respondents to find out people’s perspectives on current political campaign activities. In addition, this survey also to find out the political preferences of respondents neutrally without having associations or supporting certain political parties.

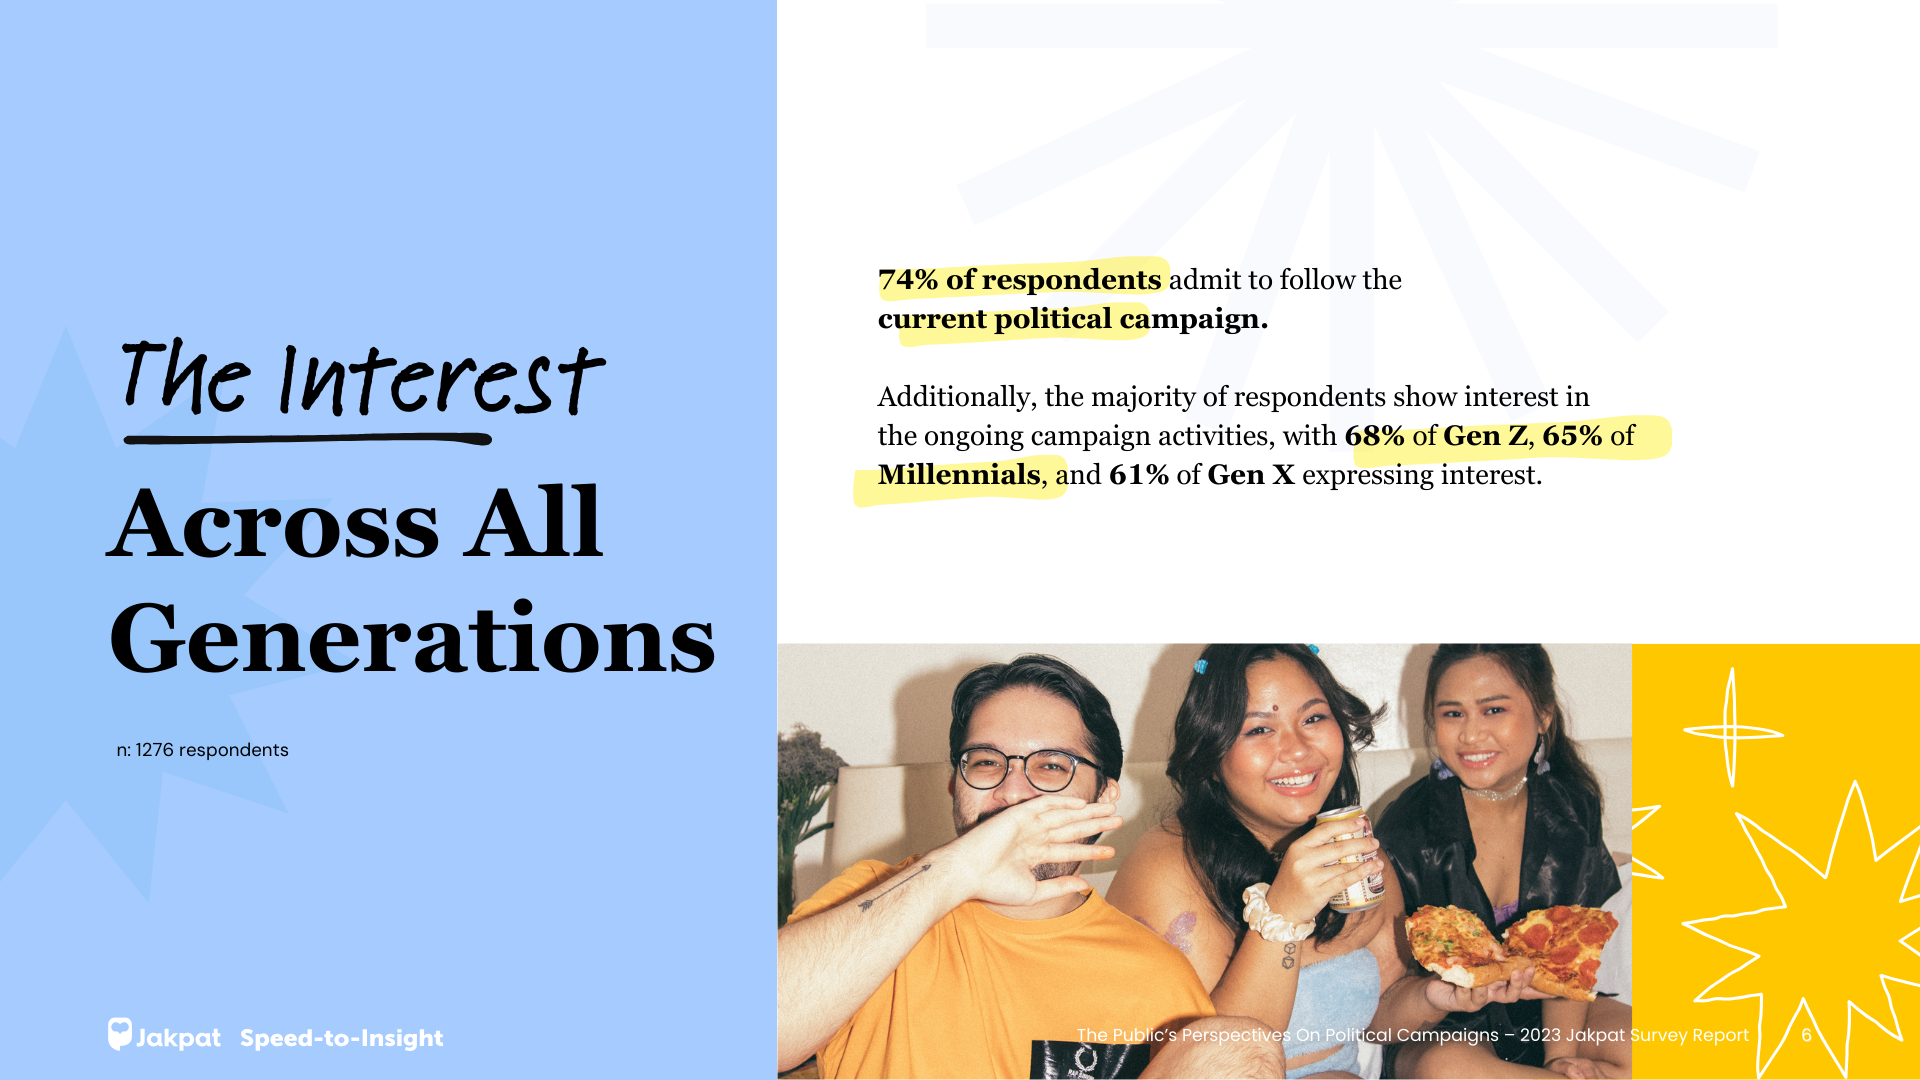
The survey results showed that 74% of respondents claimed to follow the progress of the current political campaign. Then, the majority of respondents also expressed interest in ongoing political campaigns, with 68% of Gen Z, 65% of Millennials, and 61% of Gen X showing interest.

Furthermore, 70% of respondents chose to know the quality of the candidates as the first reason for their interest in the current political campaign, followed by 55% who wanted to get insights/references/views to convince the choice, and 53% of respondents who chose as a real action in supporting the growth of the Indonesian nation.

For those who are not interested in campaigns, 41% of respondents choose if they don’t want to bother themselves, then 39% do not like things related to political issues, and 30% of respondents admit that a lot of negative information or news involving government elements is the reason for their disinterest in current political campaigns.

Types of Campaigns Respondents Like and Dislike

Social activities are the first type of campaign preferred by respondents (61%), then the type of direct campaign, which is when candidates are present in front of the public (55%). In addition, conducting debates with other candidates (40%), campaigns with digital publications such as TV, radio, podcasts, YouTube, and others (33%), to candidates having limited discussions with a group of people (24%).

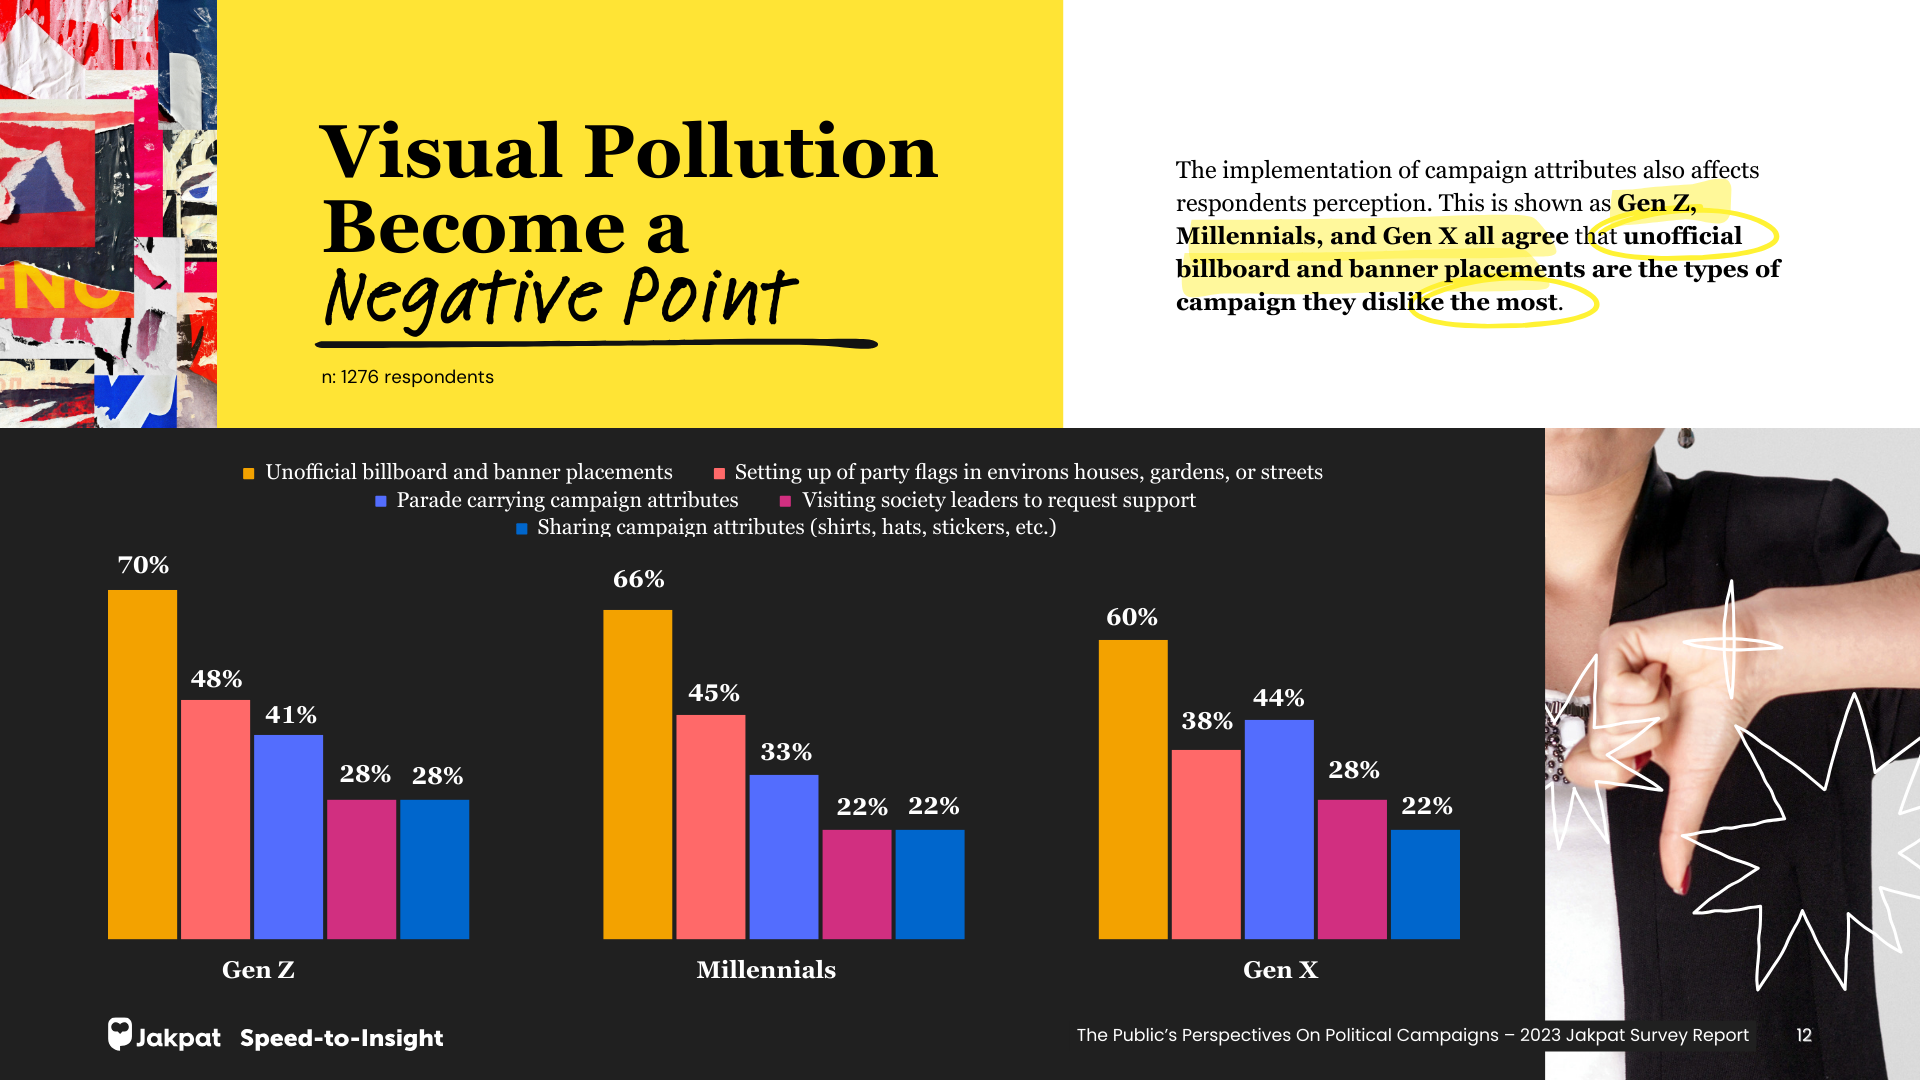
Meanwhile, for the type of campaign they disliked, respondents chose the installation of billboards and banners unofficially to be the type of campaign they disliked the most (66%). Then the installation of party flags in neighborhoods, parks, or streets (44%), marches carrying campaign attributes (38%), going to community leaders to ask for support (25%), to distributing campaign attributes such as t-shirts, hats, stickers, and others (24%).

Resources & Choosing Decisions

Respondents get information about ongoing campaign activities from different sources. TV and radio (53%) are the most preferred sources by Gen X, while for Gen Z and Millennials who use digital media and social media the most, information comes from Instagram and TikTok.

Head of Research Jakpat, Aska Primardi explained that the current campaign situation is assessed differently by each group of voters. For Gen Z, this 2024 election is their first experience of being involved and exercising their right to vote, so, naturally, the majority of Gen Z does not yet have a final say on who to vote for. What’s more, the majority of Gen Z prefer TikTok (51%) as a means of getting to know presidential candidates and legislative candidates, where there are many debates they pay attention to. This is why the majority of them are still confused in making their choices.

“Unlike the case with Gen X, the majority of whom have decided who to choose, because indeed Gen X has learned from previous experience and knowledge about presidential candidates or legislative candidates. The majority of Gen X prefer conventional media such as TV and radio as sources of campaign information, and they consider that the current campaign situation is still peaceful and conducive. Thus, it is natural that Gen Z is the main target of candidates and political parties because in addition to the proportion in the population being one of the largest after Gen Y, the majority of Gen Z is also still very open to all choices, and may still change until the last moment before entering the voting booth on election day,” continued Aska.

Regarding the decision to choose, this is indicated by 52% of respondents considering the possibility of changing their mind or changing choices after the campaign or ahead of the election, especially for Gen Z with 61%, followed by Millennials 54%, and Gen X 41%.

Get the details on our report here.

banner blog socmed trends 2023

Indonesia Mobile Entertainment & Social Media Trends – 2nd Semester of 2023

Mobile entertainment and social media have become vital in our interconnected lives, redefining how we consume content and interact. The rapid emergence of new features and platforms continues to reshape the digital landscape for entertainment and social engagement. In this report, Jakpat will share our research findings on the habit of utilizing mobile entertainment and social media.

These results are based on a survey conducted monthly in the second semester of 2023.

Key research points:

  • The habit of using mobile entertainment on over-the-top (OTT) and audio streaming platforms, including music and podcast
  • Consumer behavior on social media
  • Platform comparison on mobile entertainment and social media

Here are some previews of the report:

1 Table of Contents - Mobile Ent & Socmed Trends 2023

2 OTT - Mobile Ent & Socmed Trends 2023

3 Access - Mobile Ent & Socmed Trends 2023

Complete Report Can Be Downloaded Below

Want to Run A Survey?

or Email Us at partner@jakpat.net

Exploring the Beauty Trends of Makeup and Skincare Products in Indonesia

Exploring the Beauty Trends of Makeup and Skincare Products in Indonesia

Beauty products are growing with the presence of various makeup and skincare. Especially now, local skincare brands are gaining popularity and attracting the attention of skincare users.

Jakpat was surveyed to understand people’s habits in using makeup and skincare products, and to identify the brands frequently used in 2023. The report, which involved more than 2000 respondents, covers three sections: makeup trends among female respondents, followed by skincare trends and beauty product purchases among both female and male respondents.

The survey results state that the majority of Indonesian women consider the use of makeup important, especially for those who work every day. Daily activities seem to influence how essential makeup is used. A majority of students (54%) and employed individuals (69%) consider makeup to be crucial compared to those who aren’t employed (47%).

Makeup Trends 

Most Indonesian women admit to wearing simple makeup for their daily activities. Simple makeup refers to the use of a limited number of makeup products, typically no more than 3. This trend is observed across all age groups, socioeconomic levels, and occupations. This trend is observed across all age groups, socioeconomic levels, and occupations.

In the use of lip products, lip balm leads with 44%, then lip cream 40%, lipstick 38%, liptint 39%, and lip gloss 20%. Meanwhile, in the use of brow products, many use brow pencil at 82%, followed by brow gel at 40%, and brow pomade at 7%.

Skincare Trends

74% of consumers said local brands still attracted their attention in the last 6 months. Compared to foreign brands, 73% admit that local skincare products are more suitable for their skin conditions.

Vitamin C is still the most popular skincare ingredient, with more than half of respondents claiming that their skincare products contain vitamin C. In addition, niacinamide and salicylic acid are the most popular top skincare ingredients.

“Most respondents consider halal, alcohol-free, and dermatologically tested skincare claims as the most important. Women tend to consider these skincare claims more than men.

Purchase Beauty Products

E-commerce is the top place to buy makeup and skincare online, in addition to social media and official websites. Meanwhile, offline makeup purchases from cosmetic stores lead with 51%, minimarkets/supermarkets with 37%, department stores 15%, and sales 10%.

Then, offline skincare purchases are more commonly made at minimarkets/supermarkets with 38%, cosmetic stores 32%, department stores 17%, and sales 8%.”

Looking at the 2023 retail data, makeup and cosmetics sales have increased compared to the previous year. Although the majority of purchases are made online via e-commerce, we still need to pay attention to offline purchases via cosmetic stores for makeup, and via minimarkets for skincare, because the experience of buying offline can help consumers to assess the product directly and try it on their skin/face before buying it. Only then at the repurchasing stage can it be done online, “said Head of Research Jakpat, Aska Primardi.

Regarding sources of makeup and skincare information, social media accounts and advertisements are the 2 main sources of information about beauty products. Moreover, most respondents rely on Instagram and TikTok when looking for beauty product references.

Get the details on our report here.


Jakpat

The Public’s Perspectives On Political Campaigns

Currently, the Indonesians public is faced with various campaign activities in preparation for the upcoming 2024 democratic celebration. Through this report, Jakpat surveyed 1276 respondents to capture their perspectives on the current political campaigns.

These results are based on a survey conducted on 23rd-25th of December 2023.

Key research points:

  • Respond to the interests of the respondents on the current political campaigns
  • Identify the types of the current political campaigns the respondents like and dislike
  • Respondents’ expectations from the current political campaigns

Jakpat as an independent market research and online survey institution, remains neutral and doesn’t take sides or affiliate with any individual or specific political party. The survey is intended to neutrally identify the political preferences of respondents.

Here are some previews of the report:

Jakpat Survei - Image 1Jakpat Survei - Image 2Jakpat Survei - Image 3

Complete Report Can Be Downloaded Below

Want to Run A Survey?

or Email Us at partner@jakpat.net

Banner blog Indonesia E-commerce Trends – 2nd Semester of 2023

TikTok Shop Closed for 2 Months, Which E-commerce Consumers Turn to?

There is an interesting issue in terms of online business this year, namely TikTok Shop which was closed for two months. Meanwhile, in terms of sales strategy, live shopping features and affiliate links are still in demand.

Jakpat conducted a survey to find out the behavior and habits of Indonesians who like to shop online in the second half of 2023. The report, which involved 1509 respondents, also looked at how shopping platforms are used in e-commerce and quick-commerce as well as sales strategies, especially live shopping and affiliate links.

The survey results stated that 88% of respondents made online transactions in the second half of 2023. As many as 43% of e-commerce users like to shop online at 18.01-21.00 WIB, while quick-commerce users at 09.01-12.00 WIB with a percentage of 46%.


Online shopping payments

Digital wallets (e-wallets) are the most widely used payment method by e-commerce buyers (73%). Furthermore, there is cash on delivery (COD) and mobile/internet banking systems with 58% and 42% respectively. This trend also applies to quick-commerce payments with e-wallet percentages of 76%, COD 50%, and mobile/internet banking 48%.

The amount of e-commerce users spending is almost twice of quick-commerce users. The average shopping expenditure in e-commerce per month is Rp429,509 while in quick-commerce is Rp227,222.


Live shopping & affiliate link
Live shopping and affiliate links are two familiar online sales strategies. As many as 87% of respondents claimed to have watched live shopping and 77% of them made transactions via the feature.

Head of Research Jakpat, Aska Primardi, assessed that the live shopping model does provide a new and unique experience for consumers. It makes sense that consumers interested in live shopping in semester 2 will increase compared to semester 1 2023*.

“It’s not surprising that they are interested in this experience. Although this live shopping option will not replace 100% of online commerce transactions in e-commerce,” he said.

Meanwhile, 4 out of 5 online shoppers have opened affiliate links from social media and 70% of them decided to buy the product.


When TikTok Shop vacuum
In the second half of 2023, TikTok Shop was closed on October 4, 2023 due to the policy of banning social commerce services based on Minister of Trade Regulation Number 31 of 2023. However, this shopping service will reopen on December 12, 2023 by cooperating with Tokopedia.

The temporary closure was quite influential. The percentage of Tiktok Shop users decreased from 22% to 17% compared to the previous semester. This contrasts with Lazada users who rose 6% from 26% to 32%.

Meanwhile, the percentage of users of two other e-commerce, namely Shopee and Tokopedia, has not changed with 76% and 38% respectively throughout 2023.

“With the vacuum of TikTok Shop in the middle of semester 2, shoppers try to find the same experience through other platforms. From here, you can see Shopee Live which has increased for live shopping. This is reasonable considering that overall, the most popular e-commerce platform is still Shopee,” said Aska.


Get the details on our report here.

Jakpat

Beauty Trends 2023

The beauty product industry is growing with the presence of various local products. In this report, Jakpat conducted research to capture beauty trends in 2023, like consumer’s habits in using makeup and skincare products, their skin conditions, and considerations in choosing products. We also identify the top BUMO (Brand Used Most Often) of 2023.

These results are based on a survey conducted on 5-7th of November 2023.

Key research points:

  • Makeup daily routine & product used
  • Top 10 skincare product usage
  • Top 5 BUMO for each makeup & skincare products
  • Source of awareness beauty product
  • Spending beauty product

Here are some previews of the report:

Preview Beauty Trends Makeup & Skincare 2023 - 1

Preview Beauty Trends Makeup & Skincare 2023 - 2

Preview Beauty Trends Makeup & Skincare 2023 - 3

 Complete Report Can Be Downloaded Below

Want to Run A Survey?

or Email Us at partner@jakpat.net

Indonesia E-Commerce Trends 2nd Semester of 2023 - Jakpat Premium Report

Indonesia E-commerce Trends – 2nd Semester of 2023

During the second half of 2023, the total money spent on online shopping dropped compared to the previous year, signalling a potential downturn in consumer purchasing power. Notably, this drop in spending is most apparent among the Millennial generation and those with lower incomes.

Thus, Jakpat conducted a tracking survey related to e-commerce trends in the second semester of 2023.

Key research points:

  • Online shopping behavior
  • Perception of e-commerce and quick-commerce players in Indonesia
  • The usage of live shopping and affiliate links as marketing strategies

Here are some previews of the report:

Table of Contents E-commerce Trends - 2nd Sem 2023 [FREE] E-Commerce Trends 2nd Semester 2023-Jakpat Premium Report_241223_10

Time to Shop E-commerce Trends - 2nd Sem 2023

Complete Report Can Be Downloaded Below

Want to Run A Survey?

or Email Us at partner@jakpat.net

release motorcycle use in indonesia

Sales Trend on the Rise, How is the Motorcycle Brand Image in Indonesia?

After experiencing a correction due to the pandemic in 2020, the motorcycle market has rebounded.In 2022[1], motorcycle sales volume for the domestic market reached 5,221,470 units, or an increase of 3.2% compared to the previous year, which was 5,057,516 units. Meanwhile, until November 2023[2], motorcycle sales volume for the domestic market has reached 5,809,959 units, or an increase of 22.6% compared to the same period last year, which was 4,738,216 units. With such a large market volume, it is not surprising that until now motorcycles are still the most popular mode of transportation in Indonesia.

Jakpat conducted a survey to find out the purchase rate of Indonesian motorcycles and what are the factors that make people choose the vehicle brand. The report involving 1021 respondents shows the use of motorcycles, the level of interest in using motorcycles, the age and brand of motorcycles used, and the impression/brand image of motorcycles in Indonesia. This survey involved respondents aged 17-54 people and was conducted online on November 17-23, 2023.


Motorcycle use in Indonesia

The results of the Jakpat survey stated that 9 out of 10 people use motorcycles as their daily transportation. Meanwhile, 67% of respondents who do not use motorcycles claim to be interested in using this two-wheeled vehicle for daily life.

Of the 930 respondents who used motorcycles, almost 60% stated to drive two-wheeled vehicles under 5 years old. That is, the vehicles they own are produced between 2018 and 2023.

Of all respondents, as many as 75% use Honda motorcycles. The next rank is Yamaha and Kawasaki with percentages of 16% and 1%. In general, the most widely used motorcycle category is matic with the three largest namely Scoopy, BeAT Sporty, and Vario 125.


Impression/brand image of motorcycles in Indonesia

In choosing a motorcycle, many things are considered both rational and emotional. Brand impression/image is one of the factors considered and consists of several aspects including trusted brands, high quality, and high/stable resale prices.

Jakpat respondents assessed that the trusted brand aspect was dominated by Honda at 73%, followed by Yamaha (21%), Kawasaki (3%), and Suzuki (2%). In addition, Honda also excels as a high-quality brand (67%) compared to Yamaha (20%), Kawasaki (7%), and Suzuki (5%). Another aspect is the high/stable resale price with the highest percentage being Honda at 71%, followed by Yamaha (18%), Kawasaki (9%), and Suzuki (3%).

“A high positive image of a brand will be directly proportional to the number of users. This is what Honda brand shows. A positive image can make consumers interested in Honda motorcycles. Then when he uses the motorbike, and it turns out he also gets a positive experience, then he can become a loyal advocate consumer, “said Head of Research Jakpat, Aska Primardi.


Get the details on our report here.


[1]https://www.aisi.or.id/statistic/

[2] Idem

banner blog motorcycle use in indonesia

Motorcycle Use in Indonesia

In choosing a motorcycle, apart from functional aspects, consumers also consider the image of a brand, both emotional and rational. Brand image is quite important in deciding to buy a two-wheeled vehicle. In this report, Jakpat will describe the perspectives of respondents regarding several aspects of motorcycle brand image in Indonesia.

These results are based on a survey conducted 17th-23rd of November 2023.

Key research points:

  • Motorcycle sales in Indonesia
  • Brands of motorcycles used
  • Motorcycle brand images in Indonesia

Here are some previews of the report:

1 Daftar isi - Penggunaan Sepeda Motor di Indonesia

2 Merek - Penggunaan Sepeda Motor di Indonesia

3 Brand Image - Penggunaan Sepeda Motor di Indonesia

Complete Report Can Be Downloaded Below

Want to Run A Survey?

or Email Us at partner@jakpat.net

indo fintech trends 2nd blog banner

Fintech Trends 2023: 1 Out of 4 People Use Pay Later

The use of financial technology (fintech) applications is now increasingly massive. Not only as a payment method, fintech can also be used for various financial activities.

Jakpat conducted a survey to find out the behavior and habits of fintech users in Indonesia in the second half of 2023. The report, which involved 1503 respondents, shows how to view financial planning and use in the fields of digital payments, investment, online borrowing, and insurance.

The survey, which involved Gen X, Millennials, and Gen Z; focused on three types of digital payments. Namely e-wallets, internet / mobile banking (consisting of mobile/internet/digital banking and virtual debit cards), and buy now pay later/BNPL that commonly known as pay later (online loans and peer-to-peer/P2P lending).

In general, there are various considerations in choosing a fintech platform. Some of them are registered with the Financial Services Authority/OJK (55%), easy payment methods (54%), and user-friendly applications (50%).
Financial planning literacy
The results of the Jakpat survey stated that two out of three respondents are familiar with financial planning. That means they realize that they must have financial management to achieve life goals.

Half of the respondents are also aware that saving and investing are two things that are relevant to their current financial condition. As many as 28% feel saving is the best option right now while 10% admit they don’t have a budget for both.

“More than half of respondents already understand the importance of financial planning, and some of them also understand the importance of savings, emergency funds, insurance, and investment,” said Head of Research Jakpat, Aska Primardi.
Digital payments
In the second half of 2023, 86% of respondents will make digital payments. Other financial activities that are also carried out, both digitally and conventionally, are paying credit (37%), investment (25%), and insurance (24%).

In more detail, 3 out of 4 respondents use e-wallets as a digital payment method, followed by mobile/internet banking (45%), and pay later (25%). E-wallets dominate payments, both directly (offline) and online.

Aska revealed that sometimes salaries and savings have been eroded by daily needs and lifestyles. On the other hand, there is a possibility of rising incomes being outweighed by the cost of living rising faster and higher.

“With the consideration of a month’s salary that can run out in less than a month, they began to turn to the pay later feature as a solution,” he added.
Investment, credit, and insurance
The top three investment products in the second half of 2023 are mutual funds (42%), deposits (36%), and stocks (32%). Cryptocurrency and National Securities such as bonds and sukuk are also still in demand.

Regarding credit, as many as 66% of respondents who have bills claim to pay later every month. Other installments include House Ownership Credit/KPR (25%), online loans (22 %), and motor vehicles (22%).

Meanwhile, one in four respondents pays for insurance. Some types of insurance owned are health insurance (80%), life insurance (55%), and pension funds (39%).

Get the details on our report here.